Active
New
$985,000 $237/sqft
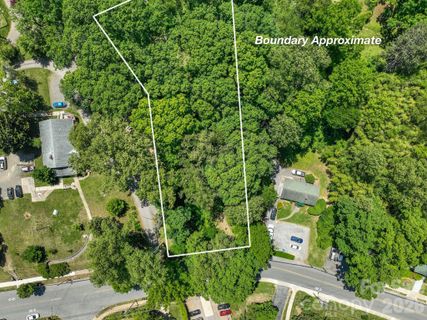
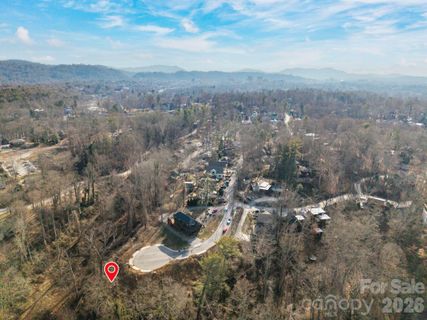
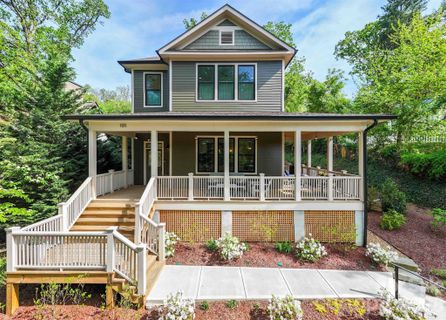
174 Pearson Drive
Asheville, NC 28801
7 bd · 3 ba · 4,149 sqft · 1927 · 1 d ago
Fireplace
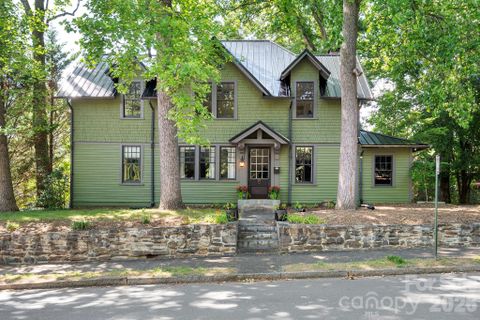
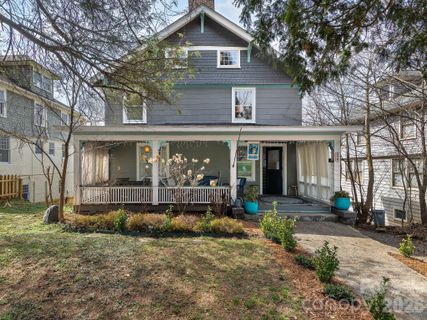
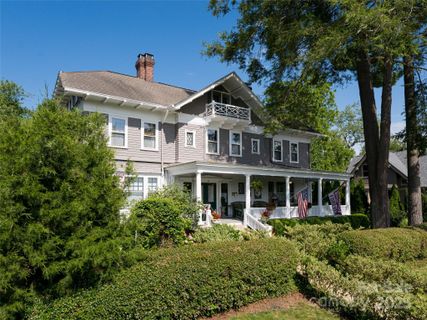
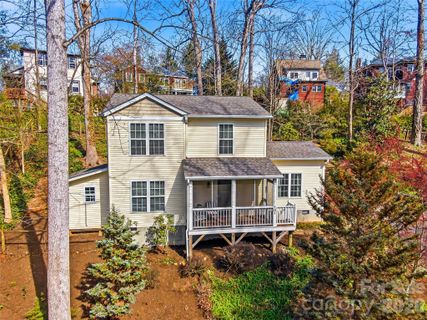
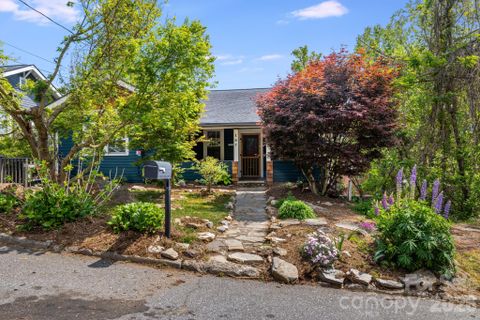
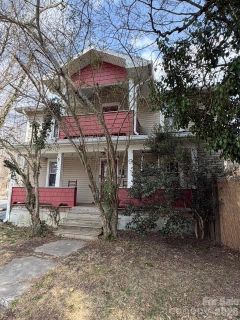
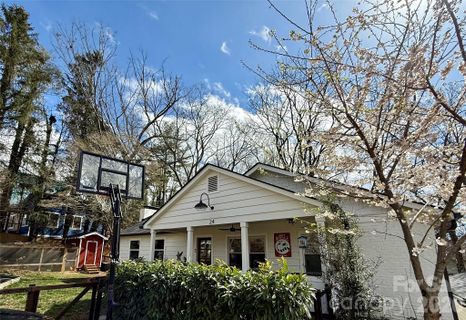
Montford is one of Asheville’s most recognizable historic neighborhoods, where tree-lined streets, classic porches, and a mix of carefully kept older homes create a setting that feels deeply rooted in the city’s story.
Community overview based on MLS listing data for Montford, Asheville
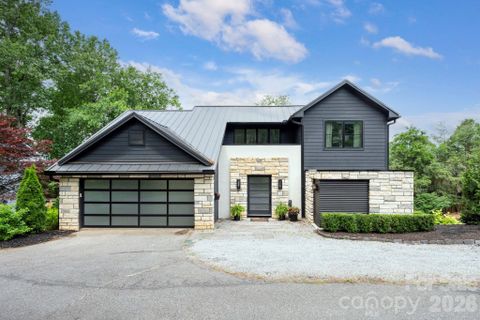
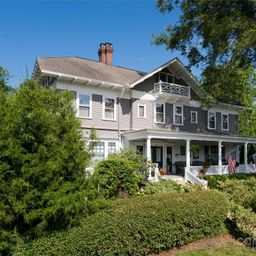
Montford is one of Asheville’s most recognizable historic neighborhoods, where tree-lined streets, classic porches, and a mix of carefully kept older homes create a setting that feels deeply rooted in the city’s story. The area has a distinctly urban-in-fill character: close to downtown, yet still defined by residential blocks, mature landscaping, and a strong sense of architectural continuity. Many homes sit on modest lots, but the neighborhood also includes larger parcels, corner lots, and a few rare opportunities for new construction. That blend of old and new gives Montford a layered, lived-in appeal that stands out immediately.
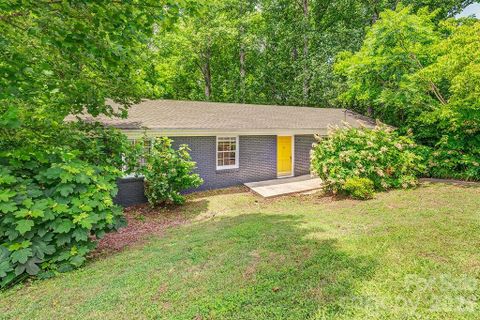
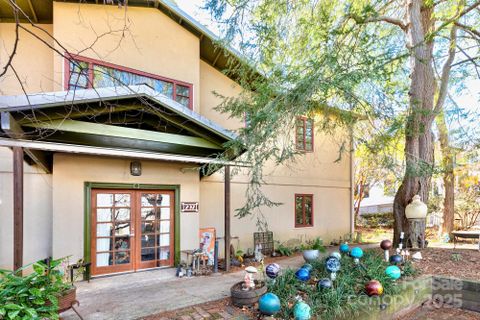
Architecturally, Montford leans heavily into historic charm. Craftsman, Tudor, Victorian, and early-1900s homes appear alongside newer custom builds and renovated duplexes, so the streetscape has real variety without losing cohesion. Many homes feature brick accents or brick streets nearby, while others emphasize cedar shake, stone details, covered porches, sunrooms, and original hardwoods. Basements are common, and some properties have been reimagined with separate apartments, studios, or flexible lower-level living spaces. That versatility is part of Montford’s identity, especially in homes that have been updated for modern use while preserving their period character. The neighborhood also includes new cul-de-sac lots and a few fresh builds, showing that Montford continues to evolve without abandoning its historic fabric.
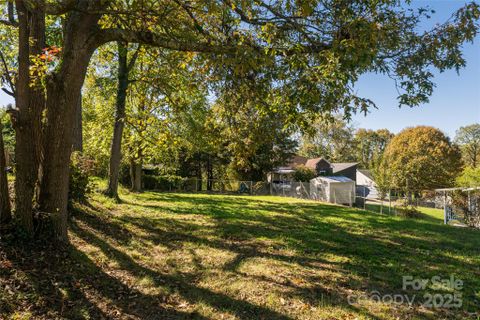
Daily life in Montford tends to center on walkability and easy access to Asheville’s core. Neighborhood favorites such as Tall John’s, Nine Mile, and All Day Darling are repeatedly mentioned, along with quick access to downtown restaurants, breweries, galleries, and the River Arts District. Montford Park adds tennis, pickleball, basketball, and green space, while the community also connects to the greenway and nearby walking paths, including routes by Riverside Cemetery and the Reed Creek Greenway. Several listings highlight native plantings, fenced yards, terraces, firepits, decks, and garden spaces, reinforcing the neighborhood’s outdoor-oriented feel. It is a place where front porches, patios, and shaded backyards matter just as much as interior updates.
Montford sits in Asheville’s historic core, just off the downtown area and close to major city destinations. Listings place homes under one mile from downtown Asheville, about 1 mile away, 1.5 miles away, and in one case just a block from downtown and the greenway. The neighborhood is also noted as being about 10 minutes from the Biltmore Estate and close to the River Arts District, Botanical Gardens, and UNCA. School assignments commonly point to Asheville City schools, with Asheville City listed for elementary, Asheville for middle, and Asheville for high school. For buyers who want a central Asheville address with immediate access to dining, parks, and city amenities, Montford offers one of the most established and recognizable settings in town.
Palmetto Park Realty Team · Asheville
Ask about Montford — we answer fast
See what it's worth — your home's own sale history plus recent Montford sales, free.
What's my home worth?Communities similar to Montford
 0.4 mi
 Montford Hills, Asheville
5 active · $620,000
 0.3 mi
 Arborvale Park, Asheville
3 active · $749,000
 0.6 mi
 Five Points, Asheville
3 active · $699,000
 1.5 mi
 Villa Heights, Asheville
2 active · $674,500
 1.7 mi
 Gracelyn, Asheville
3 active · $599,000
 1.0 mi
 Hillside Park, Asheville
2 active · $634,950
Showing 1-48+ recently sold in Montford, Asheville
| Property | Sold | Sold Price | Days on Market | Size | Sold to Ask | Sold $/SF |
|---|---|---|---|---|---|---|
| | Jun 26 2026 | $1,070,000 | 46 | 2,440 sq ft | 93.0% | $439 |
| | Jun 22 2026 | $783,000 | 80 | 2,569 sq ft | 98.0% | $305 |
| | Jun 15 2026 | $187,000 | 553 | — | 93.5% | — |
| | Jun 15 2026 | $550,000 | 80 | 1,090 sq ft | 94.0% | $505 |
| | Jun 12 2026 | $755,000 | 155 | 1,904 sq ft | 95.0% | $397 |
| | Jun 5 2026 | $725,000 | 30 | 1,549 sq ft | 100.1% | $468 |
| | May 21 2026 | $875,000 | 48 | 1,948 sq ft | 95.6% | $449 |
| | May 19 2026 | $885,000 | 26 | 1,915 sq ft | 100.0% | $462 |
| | May 1 2026 | $1,135,000 | 69 | 3,107 sq ft | 94.6% | $365 |
| | Apr 29 2026 | $864,000 | 36 | 1,866 sq ft | 98.3% | $463 |
| | Apr 27 2026 | $664,000 | 17 | 1,626 sq ft | 108.9% | $408 |
| | Apr 27 2026 | $779,900 | 43 | 1,962 sq ft | 100.0% | $398 |
| | Apr 1 2026 | $754,000 | 341 | 1,598 sq ft | 96.7% | $472 |
| | Mar 27 2026 | $1,275,000 | 55 | 2,118 sq ft | 98.5% | $602 |
| | Mar 3 2026 | $590,000 | 243 | 963 sq ft | 93.8% | $613 |
| | Jan 30 2026 | $2,200,000 | 380 | 7,150 sq ft | 89.8% | $308 |
| | Dec 15 2025 | $2,175,000 | 151 | 4,188 sq ft | 90.6% | $519 |
| | Dec 12 2025 | $750,000 | 120 | 3,254 sq ft | 93.9% | $230 |
| | Dec 10 2025 | $1,100,000 | 71 | 2,436 sq ft | 100.0% | $452 |
| | Dec 2 2025 | $650,000 | 137 | 1,780 sq ft | 96.3% | $365 |
| | Nov 26 2025 | $640,000 | 80 | 1,632 sq ft | 98.5% | $392 |
| | Nov 14 2025 | $1,075,000 | 127 | 2,703 sq ft | 100.0% | $398 |
| | Sep 16 2025 | $640,000 | 39 | 1,918 sq ft | 98.6% | $334 |
| | Aug 28 2025 | $400,000 | 48 | 1,262 sq ft | 83.3% | $317 |
| | Aug 27 2025 | $770,000 | 146 | 2,480 sq ft | 96.9% | $310 |
| | Aug 22 2025 | $1,125,000 | 261 | 2,363 sq ft | 104.7% | $476 |
| | Aug 21 2025 | $660,000 | 181 | 1,436 sq ft | 98.5% | $460 |
| | Aug 21 2025 | $2,300,000 | 77 | 4,167 sq ft | 94.8% | $552 |
| | Aug 15 2025 | $880,000 | 132 | — | 88.4% | — |
| | Aug 5 2025 | $723,000 | 28 | 2,028 sq ft | 95.8% | $357 |
| | Jul 30 2025 | $720,000 | 103 | 3,057 sq ft | 96.0% | $236 |
| | Jul 15 2025 | $1,070,000 | 54 | 1,933 sq ft | 97.7% | $554 |
| | Jun 24 2025 | $1,100,000 | 81 | 2,820 sq ft | 97.8% | $390 |
| | May 22 2025 | $890,000 | 27 | 2,315 sq ft | 98.9% | $384 |
| | May 16 2025 | $565,000 | 249 | 1,223 sq ft | 94.3% | $462 |
| | Apr 22 2025 | $795,000 | 18 | 1,532 sq ft | 100.0% | $519 |
| | Apr 11 2025 | $519,000 | 36 | 930 sq ft | 100.0% | $558 |
| | Apr 10 2025 | $624,000 | 34 | 1,286 sq ft | 100.8% | $485 |
| | Apr 9 2025 | $550,000 | 70 | 1,326 sq ft | 75.9% | $415 |
| | Apr 8 2025 | $985,000 | 47 | 2,120 sq ft | 99.0% | $465 |
| | Jan 16 2025 | $830,000 | 142 | 2,495 sq ft | 94.4% | $333 |
| | Jan 16 2025 | $630,000 | 27 | 980 sq ft | 100.0% | $643 |
| | Jan 7 2025 | $650,000 | 110 | 895 sq ft | 96.3% | $726 |
| | Jan 6 2025 | $850,000 | 256 | 3,001 sq ft | 86.8% | $283 |
| | Dec 16 2024 | $395,000 | 52 | 618 sq ft | 102.6% | $639 |
| | Dec 9 2024 | $1,500,000 | 171 | 2,272 sq ft | 85.7% | $660 |
| | Dec 6 2024 | $1,500,000 | 99 | 4,209 sq ft | 96.8% | $356 |
| | Sep 25 2024 | $1,295,000 | 77 | 2,462 sq ft | 88.7% | $526 |
Closed sales from MLS history for Montford, Asheville
Montford median sale price is $774,950, up 0.3% from a year ago; Asheville is down 4.8%.
+7 outside price range.
The Montford real estate market shows buyer's market conditions. Homes typically sell within 72 days. With 20 active listings and 31 homes sold in the past year, buyers have more negotiating power and time to decide.
Listings taken off the market in the past year in Montford, Asheville
Asheville, NC 28801
3 bd · 2 ba · 1,882 sqft
Asheville, NC 28801
4 bd · 3 ba · 1,607 sqft
Asheville, NC 28801
4 bd · 3 ba · 2,282 sqft
Asheville, NC 28801
3 bd · 2 ba · 1,657 sqft
Asheville, NC 28801
4 bd · 3 ba · 2,479 sqft
Asheville, NC 28801
4 bd · 2 ba · 1,949 sqft
Asheville, NC 28801
4 bd · 4 ba · 1,949 sqft
Asheville, NC 28801
4 bd · 4 ba · 3,733 sqft
Asheville, NC 28801
2 bd · 1 ba · 1,476 sqft
Asheville, NC 28801
4 bd · 2 ba · 1,728 sqft
These homes are no longer available, but they show recent pricing and listing activity in Montford. Our agents can help you watch for new listings in this area.
Contact an agentFree account needed — create one to continue viewing homes.
Members see everything — free👋 Still browsing Montford?
Full photos, price history, and every active & pending home in Montford with a free account.
Palmetto Park Realty Team
 $2.1M
$2.1M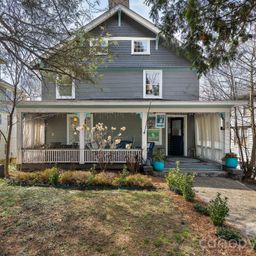 $1.52M
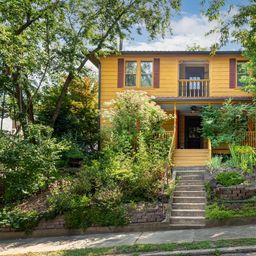 $999K
$999K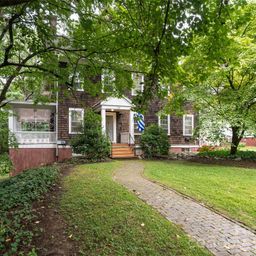 $985K
$985K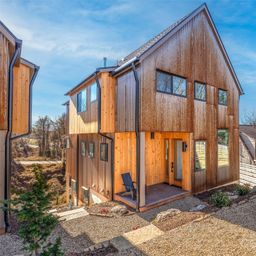 $870K
$870K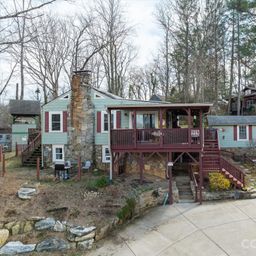 $829K
$829KCheck your messages
We sent a code to .
Verify your number and we'll text you price drops and new Montford listings. 1–2 texts a month, stop anytime.
Enjoy full access to this home and every home on Palmetto Park.