Active
New
$400,000 $381/sqft
41 Wilmington Street
Asheville, NC 28806
3 bd · 2 ba · 1,051 sqft · 2004 · 8 d ago
Villa Heights sits in the heart of West Asheville with the kind of lived-in charm that feels both established and evolving.
Community overview based on MLS listing data for Villa Heights, Asheville
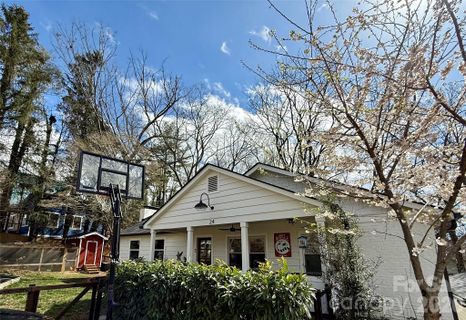
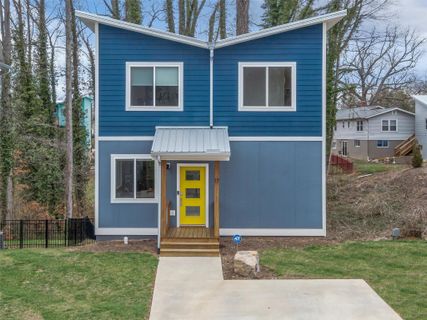
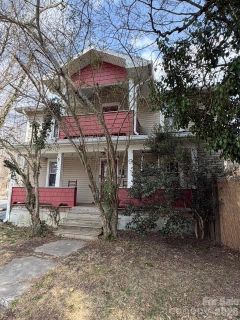
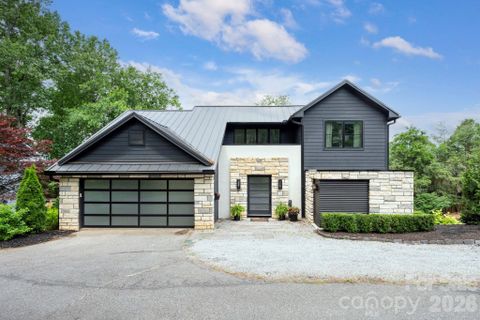
Villa Heights sits in the heart of West Asheville with the kind of lived-in charm that feels both established and evolving. Streets like Dellwood, Vandalia, Branning, and Wilmington are lined with early-20th-century cottages and bungalows, many of them updated with fresh kitchens, renovated baths, and outdoor spaces that make the most of Asheville’s mountain setting. The neighborhood’s appeal is immediate: classic architecture, mature landscaping, and a location that keeps daily errands and evening plans close at hand.
"A West Asheville pocket where historic character and walkable convenience meet."
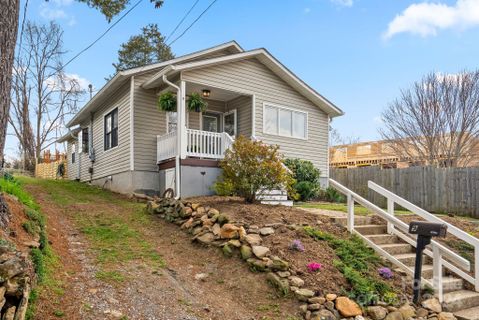
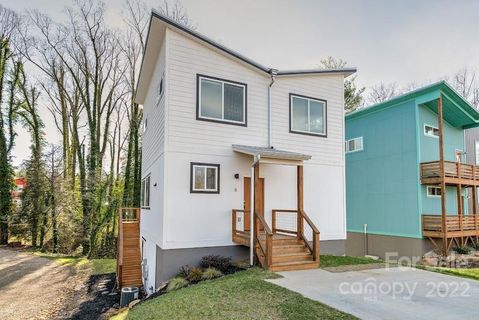
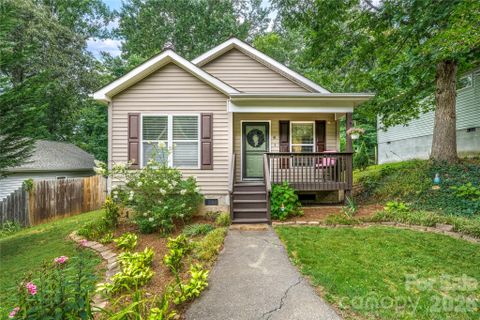
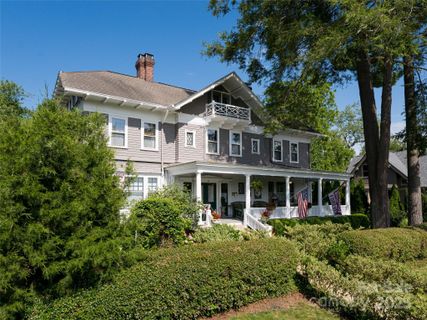
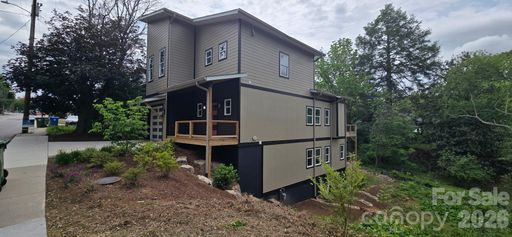
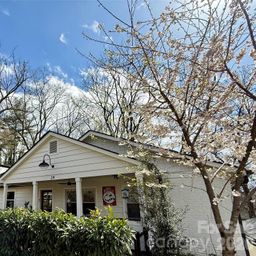
Most homes here are single-family residences, and the architectural story leans heavily toward 1920s and 1950s construction, with newer homes mixed in for contrast. You’ll see plenty of original hardwoods, built-ins, fireplaces, covered porches, and fenced yards, along with thoughtful additions such as detached studios, finished basement space, and bonus rooms. Many homes feature brick or traditional exterior materials, though the overall feel is more varied than uniform. Lots tend to be modest in size, but they’re often used well, with decks, gardens, and private outdoor corners that extend the living space beyond the walls.
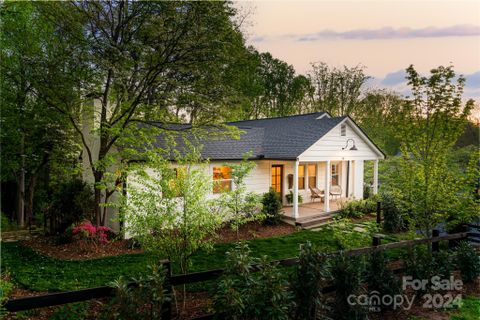
The neighborhood has a creative, adaptable rhythm. Some properties are polished and fully renovated; others keep their vintage bones and invite a more hands-on approach. Either way, Villa Heights offers a strong sense of character without feeling frozen in time.
Daily life here naturally revolves around West Asheville’s amenities. Haywood Road is the headline draw, with its cluster of shops, restaurants, breweries, and coffee spots just a short walk or quick drive away. The River Arts District is also close, and several listings point to easy access to the greenway, Reed Creek Greenway, Magnolia Park, Carrier Park, New Belgium Brewery, and the French Broad River corridor. That combination gives the area a nice balance of neighborhood energy and outdoor access.
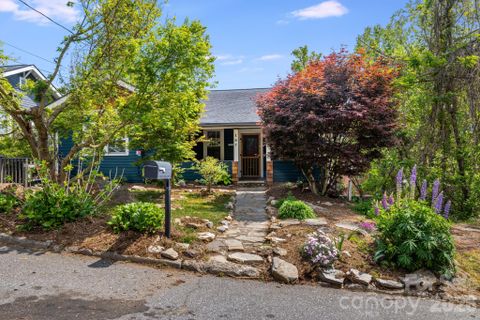
"Close to the action, yet still grounded by tree-lined lots and private outdoor space."
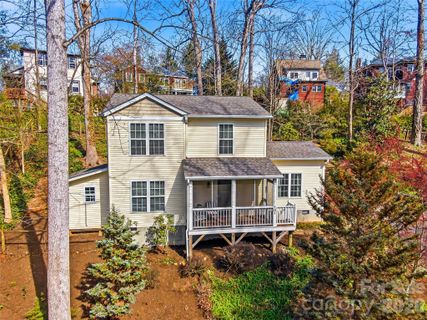
Outdoor living matters in Villa Heights. Covered porches, large decks, fenced yards, and garden beds show up again and again, and a few homes include outbuildings or studio spaces that suit creative work, storage, or flexible use. The result is a neighborhood that feels practical during the week and inviting on the weekends.
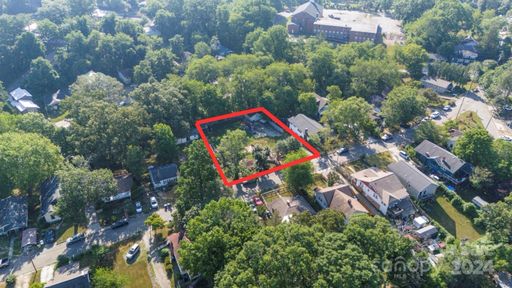
Villa Heights is positioned in West Asheville, near the Haywood Road corridor and within easy reach of downtown Asheville, the River Arts District, and the city’s west-side trail network. Public remarks repeatedly note about 5 minutes to Downtown Asheville and the River Arts District, about 2 minutes to Haywood Road, and roughly 3 minutes to Interstate 240. Some listings also reference access to I-26 and I-40, making regional travel straightforward. Nearby destinations include New Belgium Brewery, Carrier Park, Magnolia Park, Reed Creek Greenway, and the West Asheville Greenway.
The community is served by Asheville City schools: Asheville City Elementary, Asheville Middle, and Asheville High. That school assignment, paired with the neighborhood’s central west-side location, keeps Villa Heights firmly connected to the broader city while preserving its distinct residential feel.
Palmetto Park Realty Team · Asheville
Ask about Villa Heights — we answer fast
See what it's worth — your home's own sale history plus recent Villa Heights sales, free.
What's my home worth?Communities similar to Villa Heights
 1.5 mi
 Montford, Asheville
19 active · $670,000
 2.0 mi
 Five Points, Asheville
3 active · $699,000
 1.0 mi
 West Asheville Estates, Asheville
2 active · $937,500
 1.5 mi
 Montford Hills, Asheville
5 active · $620,000
 1.3 mi
 Arborvale Park, Asheville
3 active · $749,000
 3.3 mi
 Gracelyn, Asheville
3 active · $599,000
Showing 1-48+ recently sold in Villa Heights, Asheville
| Property | Sold | Sold Price | Days on Market | Size | Sold to Ask | Sold $/SF |
|---|---|---|---|---|---|---|
| | Jul 8 2026 | $406,000 | 79 | 1,112 sq ft | 101.5% | $365 |
| | Dec 17 2025 | $590,000 | 126 | 1,967 sq ft | 96.0% | $300 |
| | Feb 24 2025 | $415,000 | 101 | 916 sq ft | 94.5% | $453 |
| | Dec 13 2024 | $490,000 | 169 | 1,529 sq ft | 99.0% | $320 |
| | Sep 9 2024 | $305,000 | 66 | — | 93.8% | — |
| | May 17 2024 | $1,195,000 | 15 | 2,746 sq ft | 100.0% | $435 |
| | Mar 1 2024 | $322,500 | 56 | 916 sq ft | 92.1% | $352 |
| | Jul 20 2023 | $350,000 | 33 | 1,007 sq ft | 100.0% | $348 |
| | May 15 2023 | $530,000 | 70 | 1,372 sq ft | 98.3% | $386 |
| | Apr 6 2023 | $664,000 | 118 | 2,003 sq ft | 97.8% | $332 |
| | Mar 30 2023 | $340,000 | 24 | 1,799 sq ft | 104.6% | $189 |
| | Feb 21 2023 | $415,000 | 32 | 1,200 sq ft | 105.1% | $346 |
| | Jan 18 2023 | $510,000 | 60 | 1,334 sq ft | 96.2% | $382 |
| | Oct 3 2022 | $405,000 | 38 | 1,092 sq ft | 102.5% | $371 |
| | Sep 9 2022 | $475,000 | 29 | 1,316 sq ft | 99.4% | $361 |
| | Jan 26 2022 | $425,000 | 49 | 1,674 sq ft | 107.6% | $254 |
| | Nov 17 2021 | $331,000 | 41 | 1,020 sq ft | 101.8% | $325 |
| | Nov 9 2021 | $345,000 | 57 | 1,210 sq ft | 100.0% | $285 |
| | Oct 29 2021 | $265,000 | 35 | 699 sq ft | 106.0% | $379 |
| | Sep 22 2021 | $220,000 | 35 | 961 sq ft | 110.1% | $229 |
| | Aug 24 2021 | $460,000 | 75 | 2,392 sq ft | 96.0% | $192 |
| | Jan 29 2021 | $285,500 | 70 | 974 sq ft | 95.5% | $293 |
| | Nov 19 2020 | $340,000 | 36 | 1,204 sq ft | 100.6% | $282 |
| | Oct 5 2020 | $530,000 | 201 | 2,000 sq ft | 100.0% | $265 |
| | Sep 11 2020 | $335,000 | 91 | 1,642 sq ft | 87.0% | $204 |
| | Aug 31 2020 | $310,000 | 52 | 1,316 sq ft | 100.0% | $236 |
| | Jun 26 2020 | $430,000 | 73 | 1,691 sq ft | 100.0% | $254 |
| | Jun 8 2020 | $255,000 | 72 | 1,088 sq ft | 98.1% | $234 |
| | Apr 9 2020 | $361,500 | 51 | 1,325 sq ft | 97.7% | $273 |
| | Jul 3 2019 | $240,000 | 24 | 1,077 sq ft | 98.4% | $223 |
| | Jun 4 2019 | $347,000 | 147 | 1,352 sq ft | 100.6% | $257 |
| | May 6 2019 | $185,000 | 151 | 910 sq ft | 97.4% | $203 |
| | Feb 25 2019 | $80,000 | 44 | — | 100.0% | — |
| | Nov 20 2018 | $226,500 | 137 | 864 sq ft | 94.8% | $262 |
| | Sep 26 2018 | $215,000 | 90 | 2,204 sq ft | 86.0% | $98 |
| | Oct 12 2017 | $195,000 | 114 | 806 sq ft | 97.5% | $242 |
| | Jul 24 2017 | $270,000 | 82 | 1,176 sq ft | 96.5% | $230 |
| | Aug 31 2016 | $162,000 | 138 | 713 sq ft | 104.6% | $227 |
| | Jul 21 2016 | $218,000 | 57 | 1,103 sq ft | 94.8% | $198 |
| | May 31 2016 | $200,100 | 46 | 864 sq ft | 105.6% | $232 |
| | Jun 12 2015 | $331,000 | 46 | 1,890 sq ft | 98.5% | $175 |
| | Nov 14 2014 | $230,000 | 73 | 1,234 sq ft | 96.2% | $186 |
| | Aug 6 2014 | $176,000 | 471 | 1,008 sq ft | 88.0% | $175 |
| | Jul 31 2014 | $226,000 | 65 | 1,196 sq ft | 100.9% | $189 |
| | Jul 1 2014 | $220,000 | 124 | 1,196 sq ft | 98.2% | $184 |
| | Mar 15 2013 | $115,000 | 37 | 941 sq ft | 93.9% | $122 |
| | Nov 30 2012 | $171,000 | 46 | 1,576 sq ft | 114.1% | $109 |
| | Aug 31 2012 | $195,000 | 113 | 1,197 sq ft | 93.3% | $163 |
Closed sales from MLS history for Villa Heights, Asheville
Villa Heights median sale price is $415,000; Asheville is down 4.8%.
The Villa Heights real estate market shows buyer's market conditions. Homes typically sell within 68 days. With 2 active listings and 2 homes sold in the past year, buyers have more negotiating power and time to decide.
Listings taken off the market in the past year in Villa Heights, Asheville
Asheville, NC 28806
2 bd · 1 ba · 1,088 sqft
Asheville, NC 28806
3 bd · 1 ba · 1,102 sqft
These homes are no longer available, but they show recent pricing and listing activity in Villa Heights. Our agents can help you watch for new listings in this area.
Contact an agentFree account needed — create one to continue viewing homes.
Members see everything — free👋 Still browsing Villa Heights?
Full photos, price history, and every active & pending home in Villa Heights with a free account.
Palmetto Park Realty Team
 $949K
$949K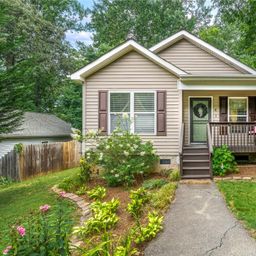 $400K
$400KCheck your messages
We sent a code to .
Verify your number and we'll text you price drops and new Villa Heights listings. 1–2 texts a month, stop anytime.
Enjoy full access to this home and every home on Palmetto Park.