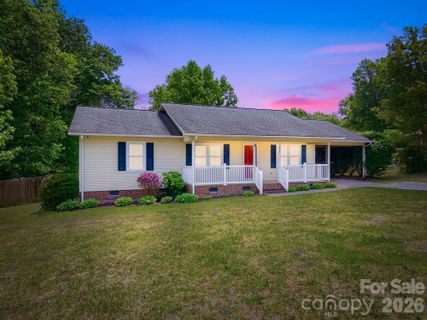
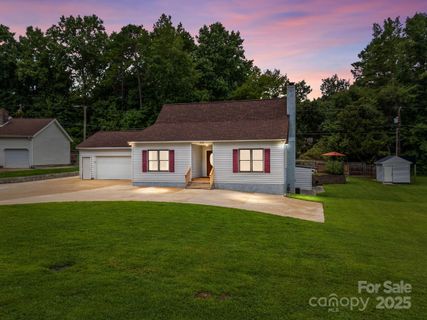
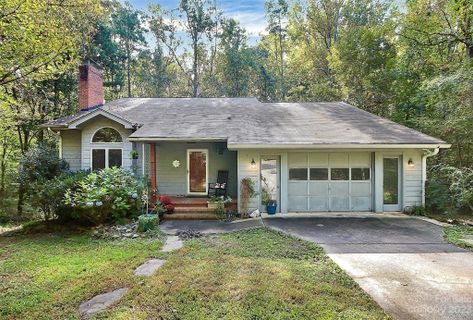
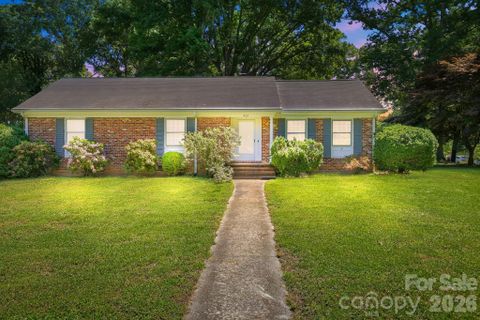
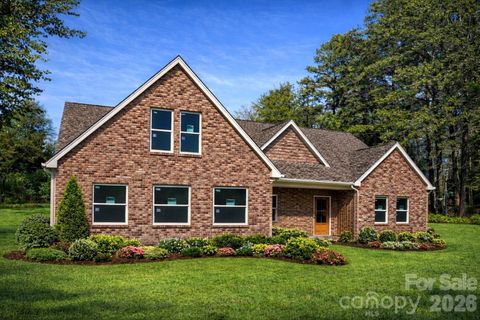
Active
$265,000 $211/sqft
425 Catawba Drive
Salisbury, NC 28147
3 bd · 2 ba · 1,254 sqft · 1989 · 2 mo ago
Greenleigh in Salisbury has the feel of an established West Rowan pocket with room to breathe.
Listing summary: 2 Active1 Pending32 Recently Sold
$265,000 $211/sqft
Salisbury, NC 28147
3 bd · 2 ba · 1,254 sqft · 1989 · 2 mo ago
$239,500
Salisbury, NC 28147
1 yr ago
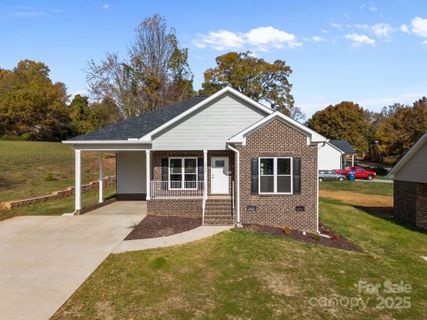
$264,900 $220/sqft
Salisbury, NC 28147
3 bd · 1 ba · 1,202 sqft · 1966 · 3 mo ago
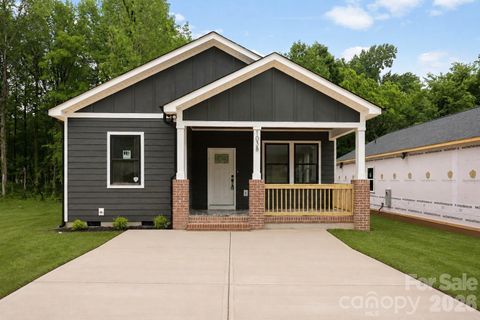
$280,000 $212/sqft
Salisbury, NC 28147
3 bd · 2 ba · 1,320 sqft · 2025 · DOM: 33 d
$324,000 $165/sqft
Salisbury, NC 28147
3 bd · 3 ba · 1,960 sqft · 1987 · DOM: 50 d
$268,900 $202/sqft
Salisbury, NC 28147
3 bd · 2 ba · 1,330 sqft · 2025 · DOM: 33 d
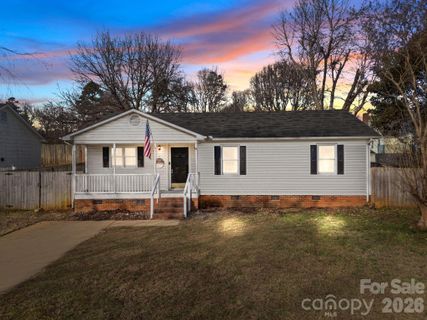
$249,900 $201/sqft
Salisbury, NC 28147
3 bd · 1 ba · 1,244 sqft · 1965 · DOM: 113 d
$235,000 $168/sqft
Salisbury, NC 28147
3 bd · 1 ba · 1,396 sqft · 1966 · DOM: 49 d
$309,000 $192/sqft
Salisbury, NC 28147
3 bd · 2 ba · 1,611 sqft · 1990 · DOM: 36 d
Midlands region, central NC
$229,900 $186/sqft
Salisbury, NC 28147
3 bd · 2 ba · 1,233 sqft · 1978 · DOM: 71 d
$330,000 $154/sqft
Salisbury, NC 28147
3 bd · 2 ba · 2,147 sqft · 1990 · DOM: 55 d
$250,000 $193/sqft
Salisbury, NC 28147
3 bd · 1 ba · 1,293 sqft · 1966 · DOM: 32 d
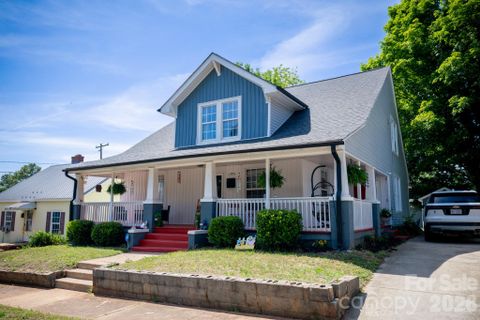
Community overview based on MLS listing data for Greenleigh, Salisbury
Greenleigh in Salisbury has the feel of an established West Rowan pocket with room to breathe. The streetscape leans residential and spread out, with many homes set on generous lots, mature trees, and long driveways that give the neighborhood a more rural edge than an in-town subdivision. The housing mix ranges from classic ranches to newer builds, and the overall impression is one of practical comfort with plenty of outdoor space.
"Greenleigh blends country-style space with everyday convenience just beyond Salisbury."
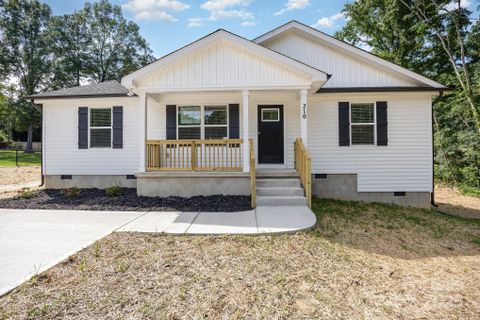
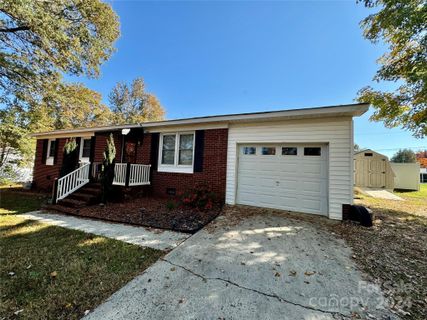
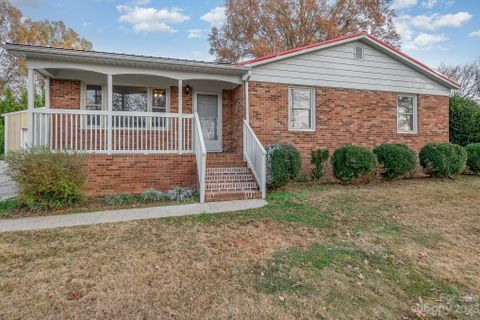
Most homes here are single-family residences, and that shows in the way the neighborhood lives: front porches, back decks, fenced yards, storage buildings, and detached or attached garages are all part of the landscape. Construction spans from the mid-1960s to brand-new 2025 builds, so buyers will find everything from updated brick ranches with hardwoods and fireplaces to fresh homes with open floor plans, vaulted ceilings, shaker cabinetry, and granite counters. Many homes feature brick exteriors, while others mix brick and vinyl or lean into a more traditional siding look.
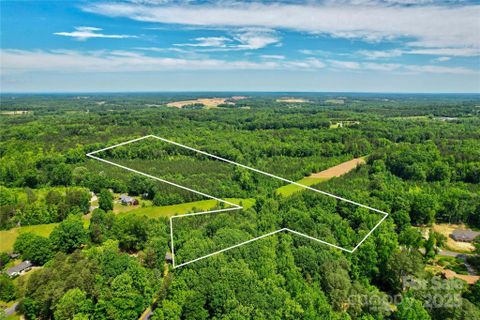
The lots are a real calling card. Several properties sit on half-acre-plus parcels, and some stretch well beyond that, creating a sense of privacy that is hard to duplicate closer to town. Outdoor living is a recurring theme, with covered decks, patios, fire pits, and wooded backdrops showing up often. Garage parking is common, and storage buildings are a familiar bonus.
Greenleigh’s rhythm is shaped less by shared amenities and more by the space each property offers. There is no clear community-wide amenity package to center the story, but the neighborhood does stand out for its usable yards, workshop space, and room for hobbies or extra parking. That makes day-to-day life feel flexible and unhurried, especially for anyone who values a larger lot and a little separation between homes.
"The appeal here is less about clubhouse living and more about usable land, privacy, and room for projects."
Greenleigh sits in the West Rowan area of Salisbury, with Catawba Drive and Pinecrest Street forming the core of the community. Public remarks point to easy access to I-85, and several listings note that downtown Salisbury, shopping, restaurants, and entertainment are just minutes away. Troyers Market is also mentioned nearby, adding a useful local stop to the everyday routine. School references consistently point to West Rowan Middle and West Rowan High, with the overall school setting described as part of the West Rowan district. That combination of a Salisbury address, West Rowan placement, and quick highway access gives Greenleigh a well-connected feel without losing its spacious, country-leaning character.
Talk to a local agent about homes in Greenleigh, Salisbury
Communities similar to Greenleigh
 1.9 mi
 Westcliffe, Salisbury
4 active · $292,500
 6.9 mi
 Sedgefield Acres, Salisbury
2 active · $297,400
 7.1 mi
 Green Hills, Salisbury
2 active · $244,900
 7.9 mi
 Brentwood Place, Salisbury
2 active · $219,000
 3.3 mi
 Cameron Glen Phase 2, Salisbury
2 active · $557,000
 6.5 mi
 Arlington, Salisbury
2 active · $264,450
32 recently sold in Greenleigh, Salisbury
| Property | Sold | List Price | DOM | Size | List $/SF |
|---|---|---|---|---|---|
| | Apr 13 2026 | $280,000 | 33 | 1,320 sq ft | $212 |
| | Oct 2 2025 | $324,000 | 50 | 1,960 sq ft | $165 |
| | Sep 29 2025 | $268,900 | 33 | 1,330 sq ft | $202 |
| | Feb 21 2025 | $249,900 | 113 | 1,244 sq ft | $201 |
| | Jan 4 2024 | $235,000 | 49 | 1,396 sq ft | $168 |
| | Dec 1 2023 | $309,000 | 36 | 1,611 sq ft | $192 |
| | Nov 3 2023 | $229,900 | 71 | 1,233 sq ft | $186 |
| | Jul 21 2023 | $330,000 | 55 | 2,147 sq ft | $154 |
| | Jun 13 2023 | $250,000 | 32 | 1,293 sq ft | $193 |
| | Nov 4 2022 | $299,000 | 38 | 1,745 sq ft | $171 |
| | Sep 30 2022 | $250,000 | 34 | 1,526 sq ft | $164 |
| | Nov 23 2021 | $210,000 | 21 | 1,614 sq ft | $130 |
| | Jul 22 2021 | $189,900 | 67 | 1,369 sq ft | $139 |
| | Feb 23 2021 | $197,500 | 49 | 1,883 sq ft | $105 |
| | Feb 16 2021 | $190,000 | 48 | 1,171 sq ft | $162 |
| | Aug 8 2019 | $199,500 | 148 | 2,258 sq ft | $88 |
| | Oct 16 2018 | $125,000 | 77 | 1,235 sq ft | $101 |
| | Oct 3 2018 | $18,000 | 119 | — | — |
| | Apr 27 2018 | $178,000 | 28 | 2,147 sq ft | $83 |
| | Jun 30 2017 | $129,777 | 149 | 1,542 sq ft | $84 |
| | Jun 30 2017 | $129,777 | 149 | 1,542 sq ft | $84 |
| | Mar 10 2017 | $129,900 | 183 | 1,448 sq ft | $90 |
| | Mar 10 2017 | $129,900 | 183 | 1,450 sq ft | $90 |
| | Jan 27 2017 | $166,500 | 81 | 1,500 sq ft | $111 |
| | Jan 27 2017 | $166,500 | 81 | 1,500 sq ft | $111 |
| | Jul 15 2016 | $69,900 | 77 | 1,295 sq ft | $54 |
| | Jan 12 2016 | $99,900 | 70 | 1,300 sq ft | $77 |
| | Jul 17 2015 | $107,500 | 366 | 1,204 sq ft | $89 |
| | Jul 17 2015 | $107,500 | 366 | 1,204 sq ft | $89 |
| | Sep 4 2013 | $97,200 | 162 | 1,328 sq ft | $73 |
| | Sep 4 2013 | $97,200 | 162 | 1,328 sq ft | $73 |
| | Apr 30 2012 | $72,900 | 49 | 1,448 sq ft | $50 |
Aggregated from MLS listing history for Greenleigh, Salisbury
The Greenleigh real estate market shows buyer's market conditions. Homes typically sell within 61 days. With 3 active listings and 3 homes sold in the past year, buyers have more negotiating power and time to decide.
Listings taken off the market in the past year in Greenleigh, Salisbury
These homes are no longer available, but they show recent pricing and listing activity in Greenleigh. Our agents can help you watch for new listings in this area.
Contact an agent