Active
New
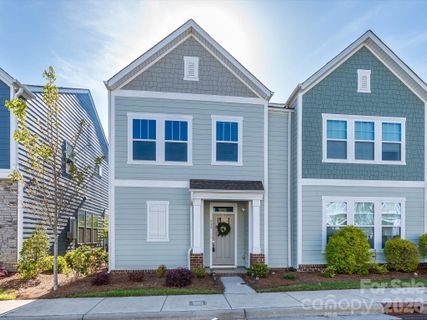
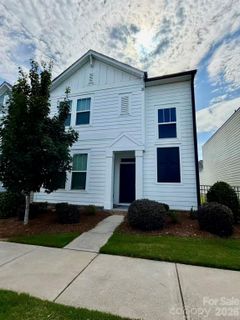
$427,800 $215/sqft
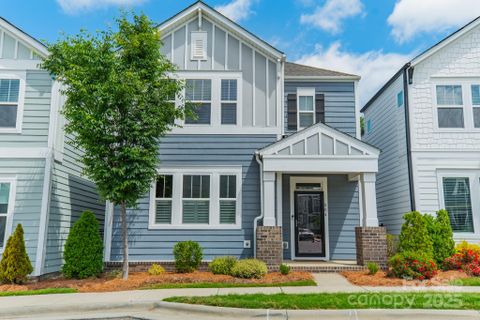
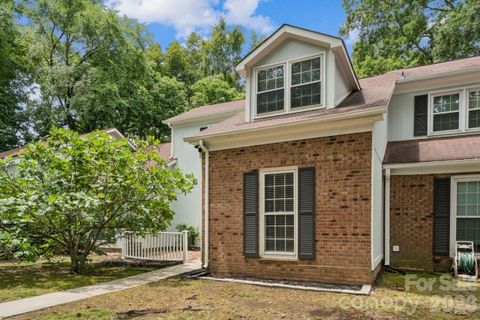
325 Johnston Drive
Pineville, NC 28134
3 bd · 2 ba · 1,986 sqft · 2021 · 8 d ago
Garage
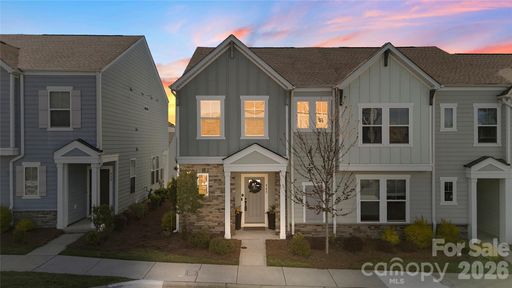
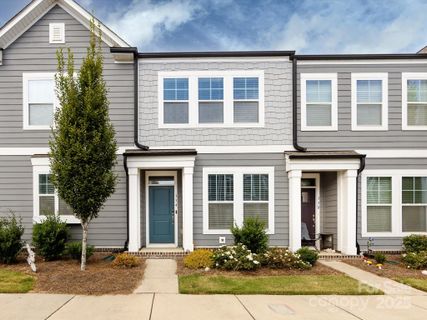
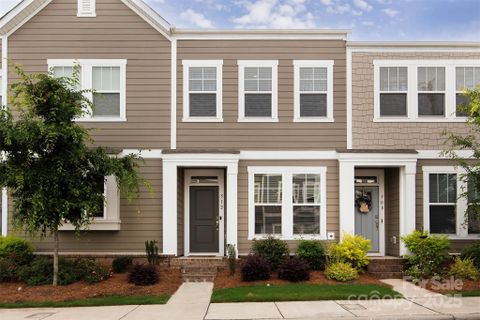
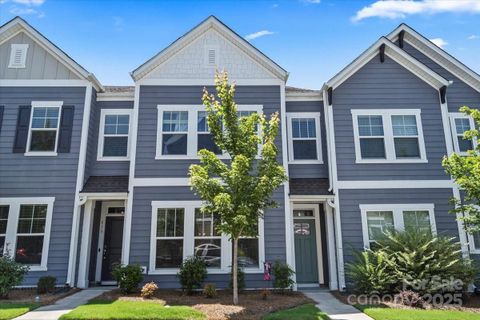
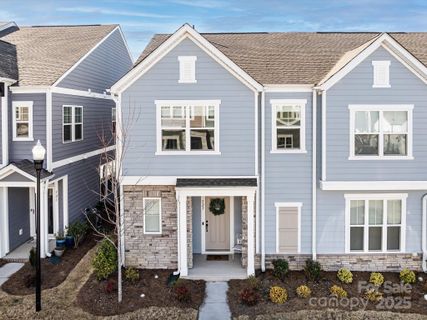
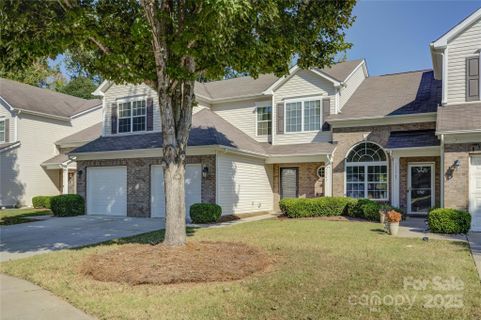
Chadwick Park feels like one of Pineville’s most polished in-town townhome communities, where newer construction, rear-entry garages, and a compact streetscape create a crisp, low-maintenance look.
Community overview based on MLS listing data for Chadwick Park, Pineville
Chadwick Park feels like one of Pineville’s most polished in-town townhome communities, where newer construction, rear-entry garages, and a compact streetscape create a crisp, low-maintenance look. Most homes here were built between 2018 and 2022, and that newer build era shows in the clean lines, open layouts, and upgraded finishes that repeat throughout the neighborhood. The setting is especially appealing for anyone who wants to be close to downtown Pineville without giving up a modern home style.
"A modern townhome setting with walkable access to Pineville’s most recognizable local spots."
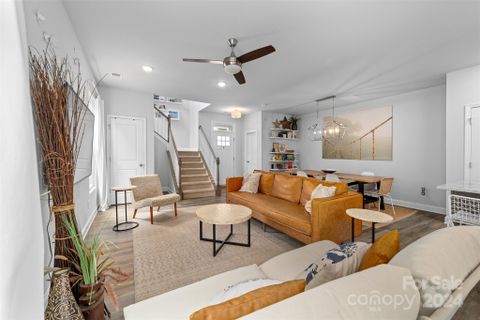
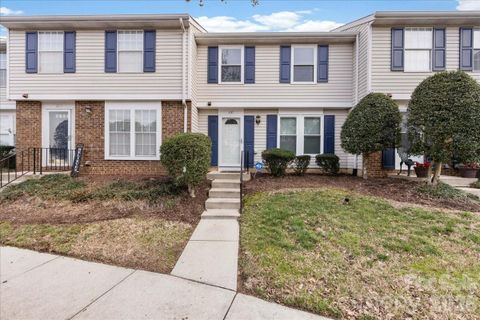
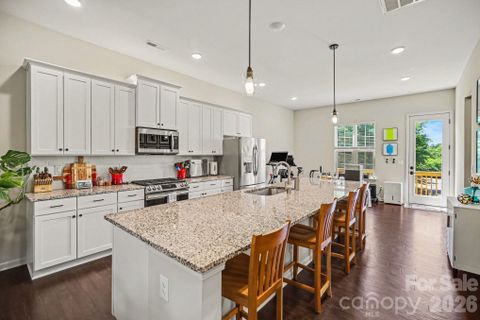
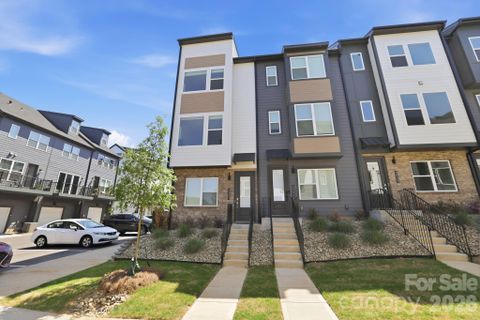
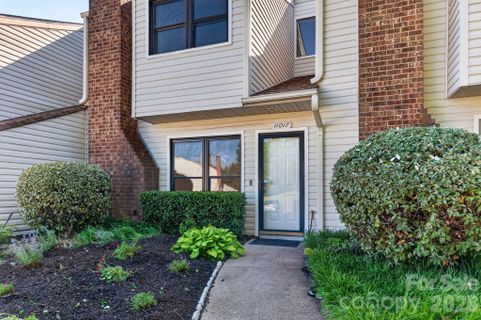
The community is dominated by residential townhomes, with a few single-family-style floor plans mixed in, but the overall feel is cohesive and thoughtfully planned. Inside, the homes lean into the features buyers notice right away: quartz countertops, gas cooktops, stainless appliances, large islands, lofts, and flexible office or bonus spaces. Many homes also include fenced or patio-style outdoor areas, and the rear-load garages keep the front elevations tidy. With average lot sizes staying modest, the neighborhood is built for easy upkeep rather than oversized yard work, and that gives the streets a streamlined, urban-in-a-small-town feel.
Chadwick Park’s daily rhythm is shaped by its location near Pineville’s downtown core. Residents can walk to restaurants, coffee, boutiques, the library, and Pineville Lake Park, which adds trails, a dog park, playgrounds, shelters, and fitness facilities to the mix. The neighborhood also sits close to Pineville Library, Belle Johnson Community Park, and the Pineville town center, so errands and casual outings are close at hand. The nearby streets and public spaces give the area a lively, connected feel without losing its residential character.
"This is the kind of place where a morning coffee run or an evening park visit can be part of the routine."
Chadwick Park is set in the Pineville area of the Charlotte metro, just off the downtown Pineville corridor and within easy reach of I-77 and I-485. Public remarks repeatedly note quick access to both interstates, plus proximity to the Blue Line light rail station, Uptown Charlotte, and the airport. For school assignments, the community is commonly linked with Pineville Elementary, Quail Hollow Middle, and South Mecklenburg High. That combination of central location, transit access, and established school zoning gives Chadwick Park a practical, well-connected address in one of Pineville’s most walkable pockets.
Palmetto Park Realty Team · Pineville
Ask about Chadwick Park — we answer fast
See what it's worth — your home's own sale history plus recent Chadwick Park sales, free.
What's my home worth?Communities similar to Chadwick Park
 0.7 mi
 Carolina Crossing, Pineville
7 active · $309,500
 0.6 mi
 Park Lake, Pineville
2 active · $260,000
 3.4 mi
 Hadley At Arrowood Station, Charlotte
12 active · $419,950
 2.3 mi
 Renaissance On Carmel, Charlotte
2 active · $294,900
 4.2 mi
 Southmont, Charlotte
5 active · $406,290
 2.1 mi
 Carmel Crossing, Charlotte
4 active · $249,200
Showing 1-48+ recently sold in Chadwick Park, Pineville
| Property | Sold | Sold Price | Days on Market | Size | Sold to Ask | Sold $/SF |
|---|---|---|---|---|---|---|
| | Jun 30 2026 | $425,000 | 74 | 2,053 sq ft | 99.3% | $207 |
| | Jun 3 2026 | $415,000 | 54 | 1,703 sq ft | 97.6% | $244 |
| | Apr 28 2026 | $421,000 | 171 | 1,905 sq ft | 96.8% | $221 |
| | Jan 6 2026 | $342,000 | 123 | 1,477 sq ft | 102.1% | $232 |
| | Sep 12 2025 | $355,000 | 105 | 1,508 sq ft | 97.3% | $235 |
| | Aug 21 2025 | $450,000 | 111 | 2,314 sq ft | 98.9% | $194 |
| | Jul 30 2025 | $418,000 | 34 | 1,963 sq ft | 99.5% | $213 |
| | Jun 23 2025 | $435,000 | 25 | 2,157 sq ft | 102.4% | $202 |
| | May 1 2025 | $420,000 | 49 | 1,689 sq ft | 102.4% | $249 |
| | Oct 28 2024 | $411,500 | 137 | 2,013 sq ft | 96.8% | $204 |
| | Oct 11 2024 | $365,000 | 41 | 1,513 sq ft | 100.0% | $241 |
| | May 30 2024 | $471,500 | 55 | 2,010 sq ft | 99.3% | $235 |
| | Nov 7 2023 | $414,000 | 75 | 1,695 sq ft | 100.5% | $244 |
| | Jun 2 2023 | $417,500 | 32 | 1,677 sq ft | 98.2% | $249 |
| | May 31 2023 | $414,000 | 54 | 1,703 sq ft | 97.4% | $243 |
| | May 10 2023 | $394,000 | 44 | 1,951 sq ft | 98.7% | $202 |
| | Apr 4 2023 | $445,000 | 60 | 2,065 sq ft | 99.1% | $215 |
| | Mar 20 2023 | $384,000 | 167 | 1,821 sq ft | 96.0% | $211 |
| | Sep 1 2022 | $450,000 | 117 | 2,314 sq ft | 98.9% | $194 |
| | Jun 14 2022 | $489,907 | 208 | 2,246 sq ft | 100.0% | $218 |
| | Jun 6 2022 | $378,620 | 195 | 1,703 sq ft | 99.3% | $222 |
| | Jun 3 2022 | $397,235 | 193 | 1,703 sq ft | 100.0% | $233 |
| | May 31 2022 | $406,168 | 198 | 1,692 sq ft | 100.6% | $240 |
| | May 17 2022 | $388,483 | 161 | 1,677 sq ft | 100.0% | $232 |
| | Mar 30 2022 | $375,178 | 165 | 1,677 sq ft | 102.7% | $224 |
| | Mar 29 2022 | $369,217 | 163 | 1,703 sq ft | 102.8% | $217 |
| | Mar 29 2022 | $382,607 | 159 | 1,692 sq ft | 100.0% | $226 |
| | Mar 23 2022 | $369,659 | 143 | 1,703 sq ft | 100.0% | $217 |
| | Feb 4 2022 | $356,678 | 361 | 1,703 sq ft | 100.0% | $209 |
| | Jan 31 2022 | $345,664 | 0 | 1,703 sq ft | 100.0% | $203 |
| | Jan 31 2022 | $343,185 | 303 | 1,703 sq ft | 100.0% | $202 |
| | Jan 27 2022 | $361,836 | 147 | 1,703 sq ft | 100.0% | $212 |
| | Dec 10 2021 | $341,307 | 284 | 1,677 sq ft | 100.0% | $204 |
| | Nov 12 2021 | $452,034 | 91 | 2,234 sq ft | 100.0% | $202 |
| | Sep 29 2021 | $405,354 | 233 | 2,250 sq ft | 100.0% | $180 |
| | Sep 14 2021 | $361,348 | 253 | 1,987 sq ft | 100.0% | $182 |
| | Jul 9 2021 | $362,149 | 217 | 1,939 sq ft | 100.0% | $187 |
| | May 6 2021 | $344,000 | 63 | 2,113 sq ft | 98.3% | $163 |
| | Apr 21 2021 | $355,000 | 19 | 1,999 sq ft | 101.5% | $178 |
| | Feb 25 2021 | $324,897 | 190 | 2,130 sq ft | 97.6% | $153 |
| | Feb 19 2021 | $323,397 | 227 | 1,987 sq ft | 106.4% | $163 |
| | Feb 5 2021 | $340,000 | 169 | 2,058 sq ft | 98.3% | $165 |
| | Feb 2 2021 | $391,000 | 2 | 2,260 sq ft | 100.0% | $173 |
| | Jan 27 2021 | $328,000 | 145 | 2,130 sq ft | 98.2% | $154 |
| | Jan 14 2021 | $360,394 | 42 | 2,058 sq ft | 100.0% | $175 |
| | Dec 14 2020 | $316,320 | 131 | 1,855 sq ft | 101.2% | $171 |
| | Dec 11 2020 | $286,690 | 128 | 1,498 sq ft | 100.2% | $191 |
| | Dec 10 2020 | $280,000 | 127 | 1,502 sq ft | 97.4% | $186 |
Closed sales from MLS history for Chadwick Park, Pineville
Chadwick Park median sale price is $418,000; Pineville is down 2.0%.
The Chadwick Park real estate market shows buyer's market conditions. Homes typically sell within 143 days. With 2 active listings and 7 homes sold in the past year, buyers have more negotiating power and time to decide.
Listings taken off the market in the past year in Chadwick Park, Pineville
These homes are no longer available, but they show recent pricing and listing activity in Chadwick Park. Our agents can help you watch for new listings in this area.
Contact an agentFree account needed — create one to continue viewing homes.
Members see everything — free👋 Still browsing Chadwick Park?
Full photos, price history, and every active & pending home in Chadwick Park with a free account.
Palmetto Park Realty Team
 $430K
$430K $428K
$428KCheck your messages
We sent a code to .
Verify your number and we'll text you price drops and new Chadwick Park listings. 1–2 texts a month, stop anytime.
Enjoy full access to this home and every home on Palmetto Park.