Cobblestone Homes in Matthews, NC on Larger Lots
2 homes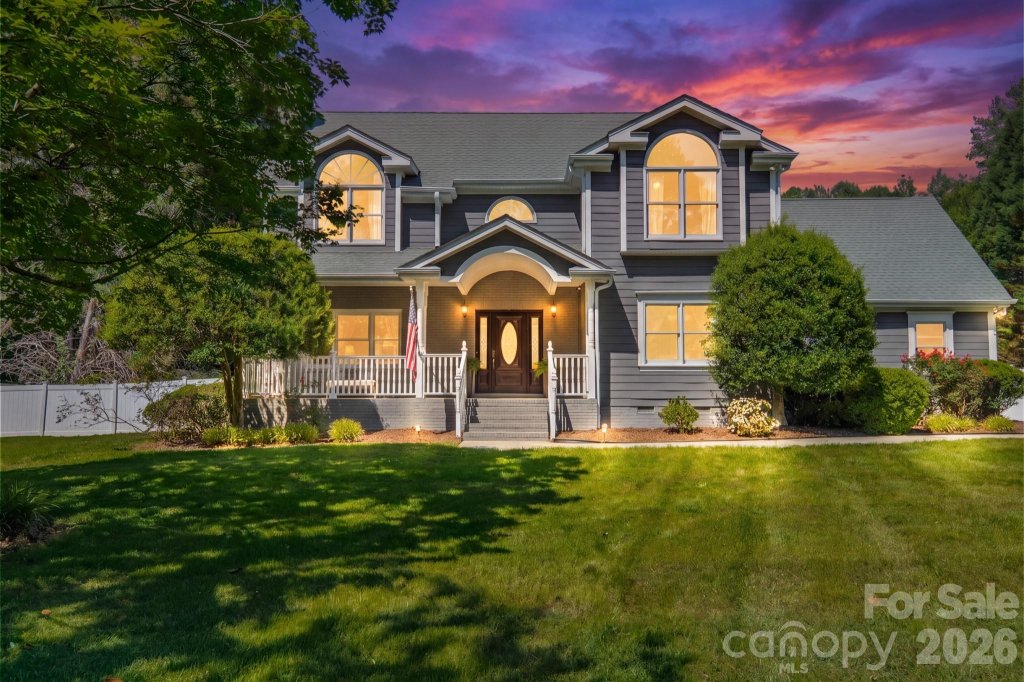


Community Highlights
- Large wooded lots
- Custom home designs
- Strong school district access
- Outdoor living spaces
* Based on what we noticed in listing details.


Screened porches · Decks · Patios +3
* Based on what we noticed in listing details.


Architecture & Style
- Two-Story Foyers
- Formal Dining Rooms
- Fireplaces
- Kitchen Islands
- Bonus Rooms
- Main-Level Bedrooms Or Suites
- Walk-In Closets
* Based on what we noticed in listing details.

Location & Proximity
Charlotte metro, Union County / southern Mecklenburg area, North Carolina
- Waverly
- Wesley Chapel shopping area
- Target
- Harris Teeter
- Publix grocery store coming soon
* Based on what we noticed in listing details.


First Impressions
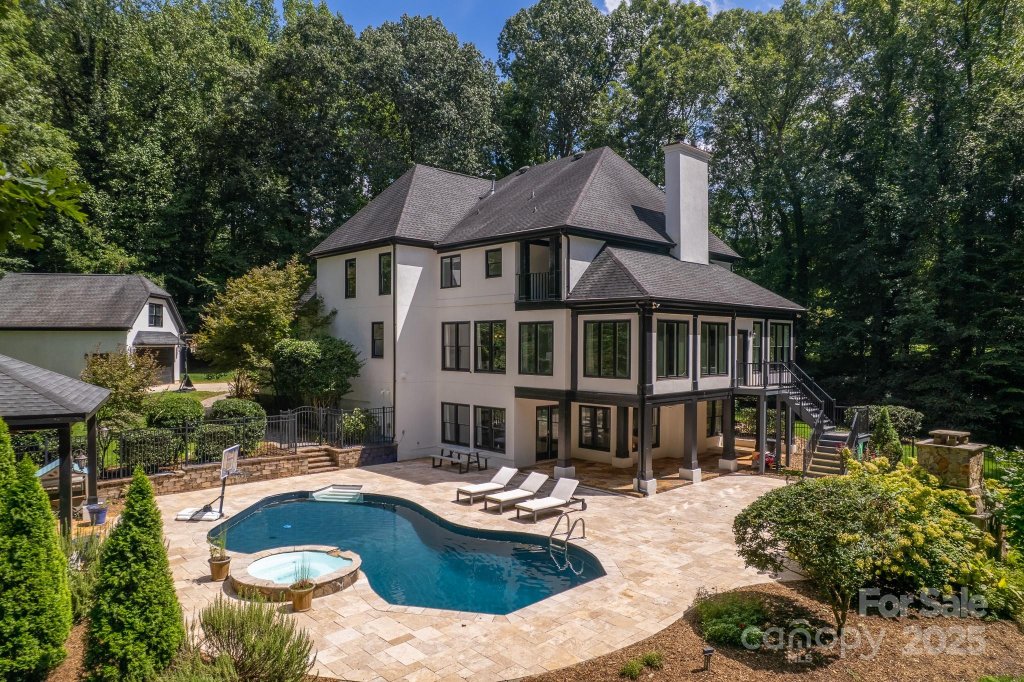
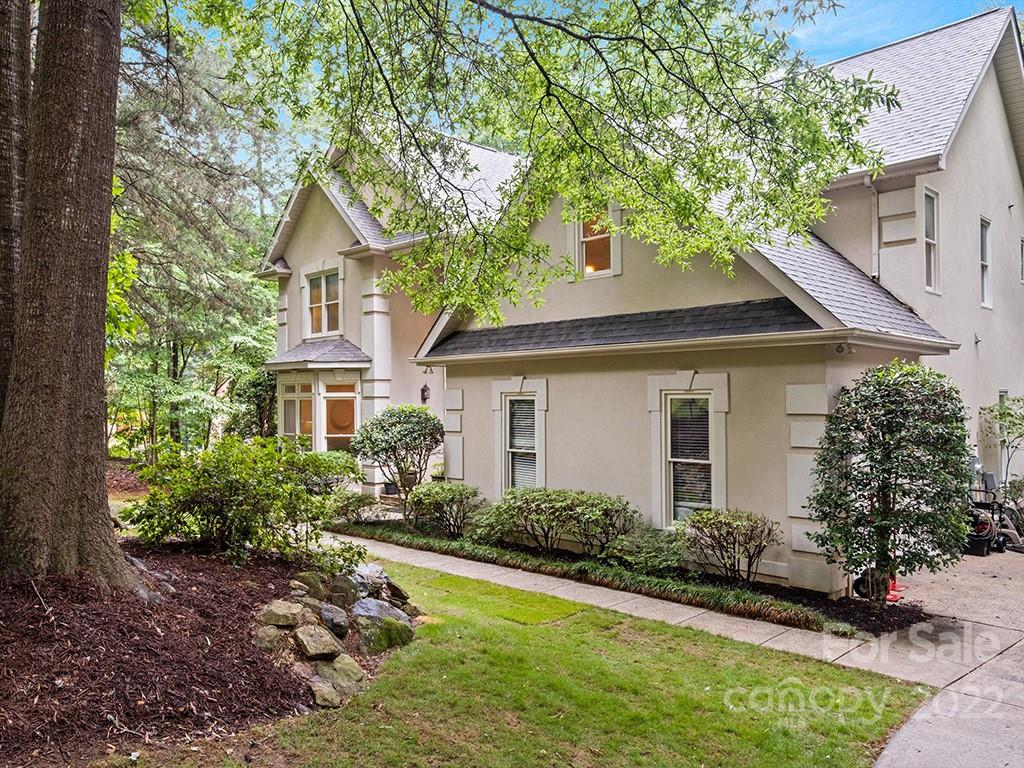
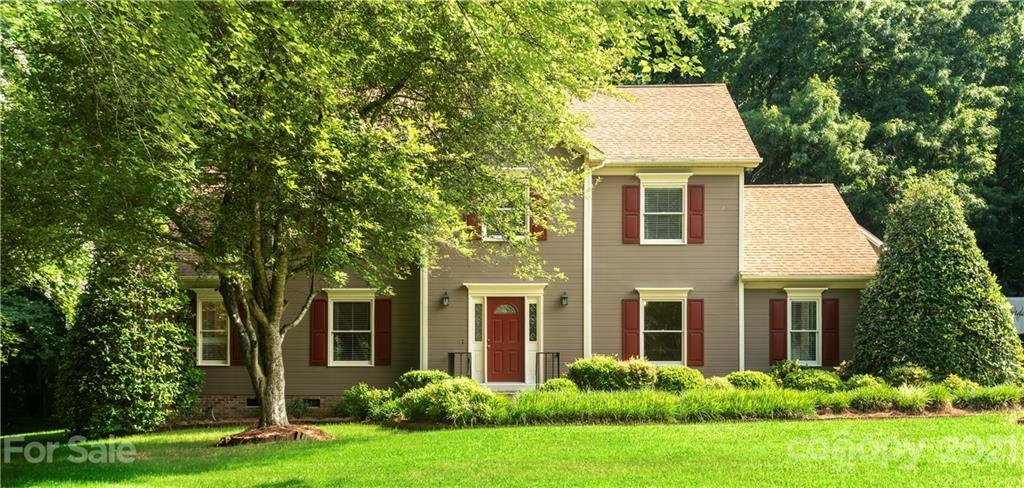
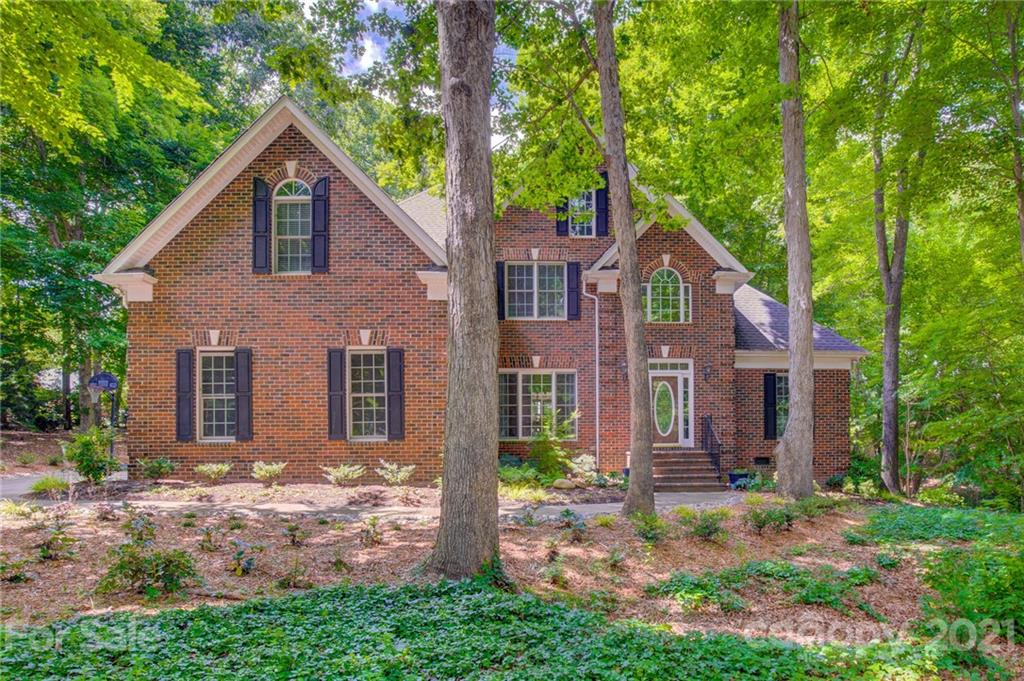
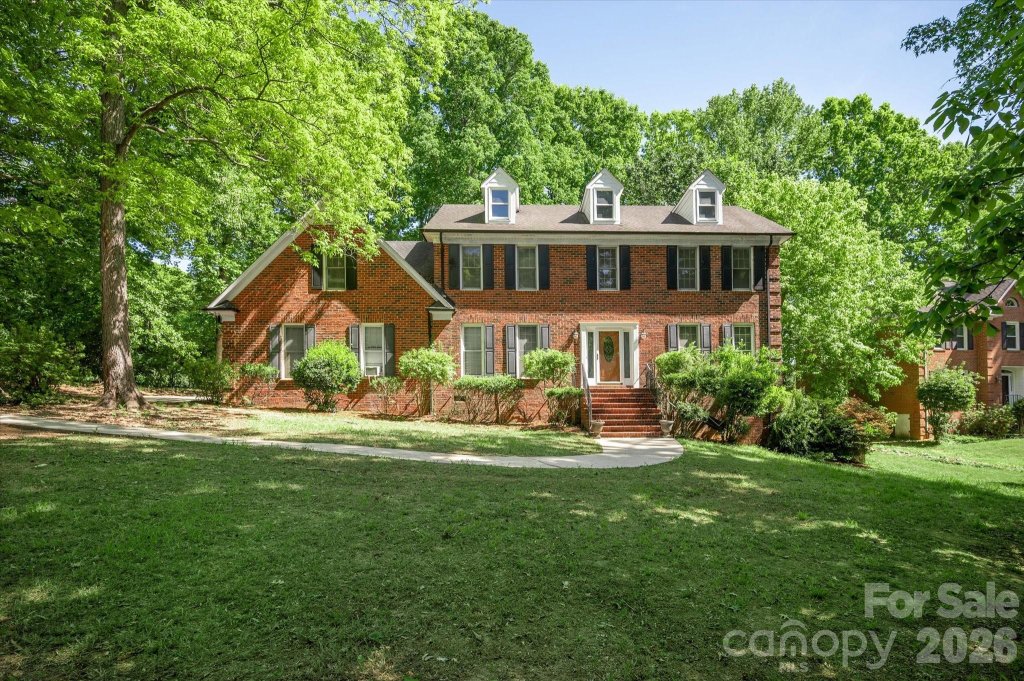
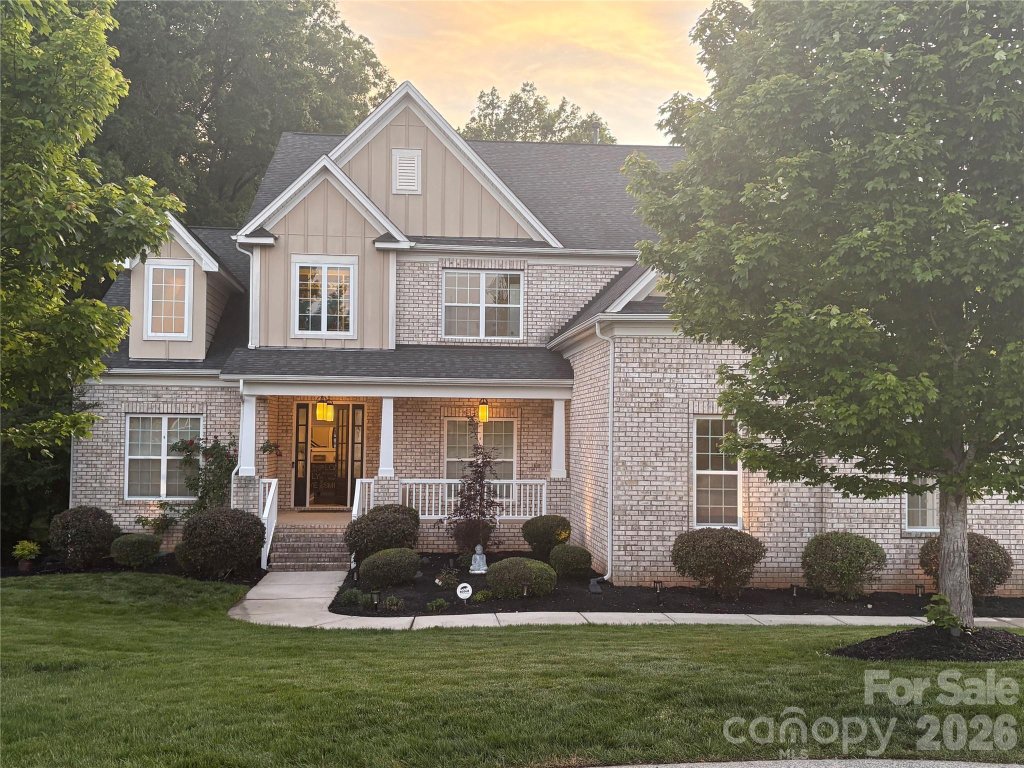
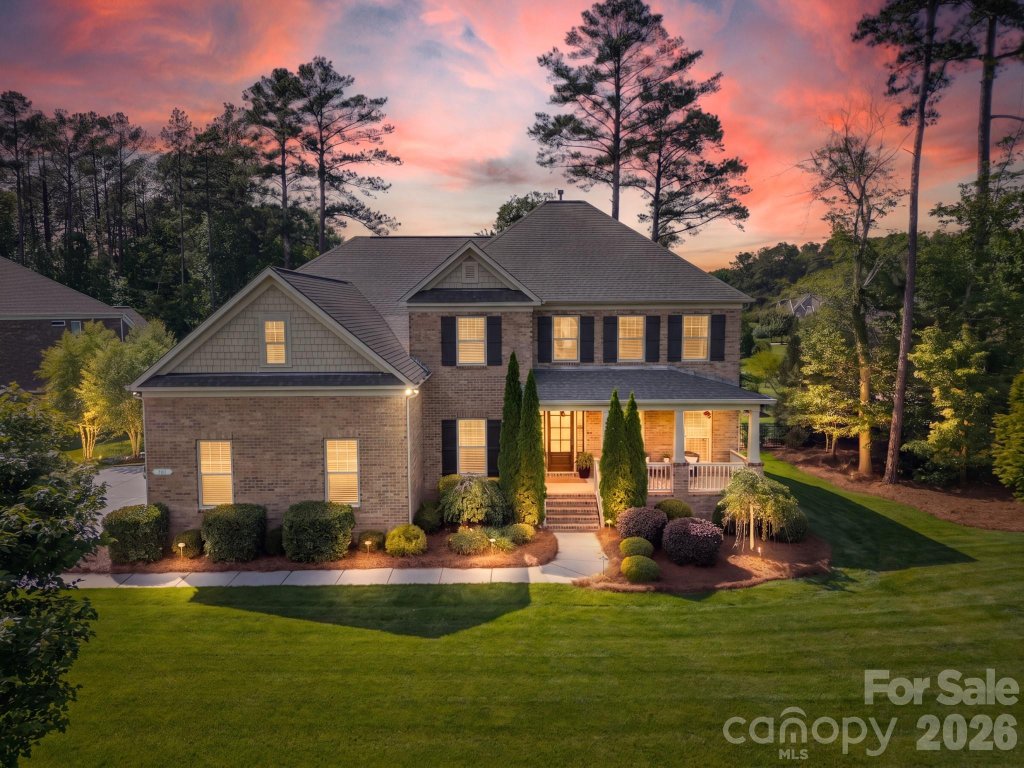
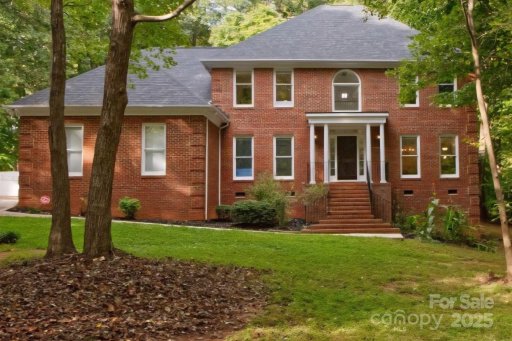
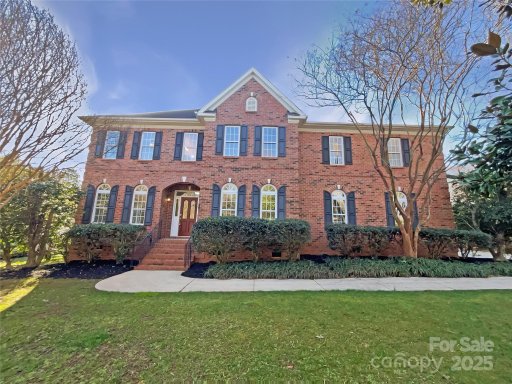
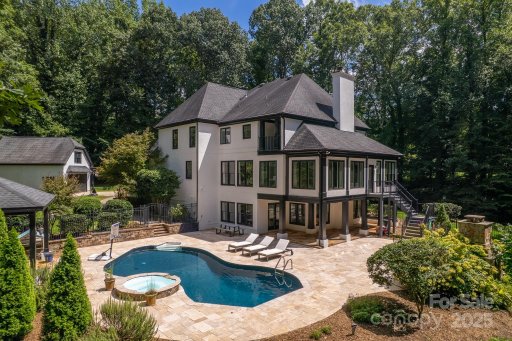
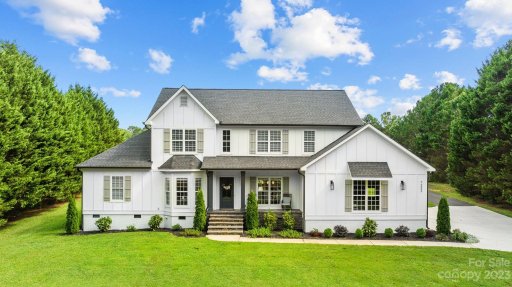
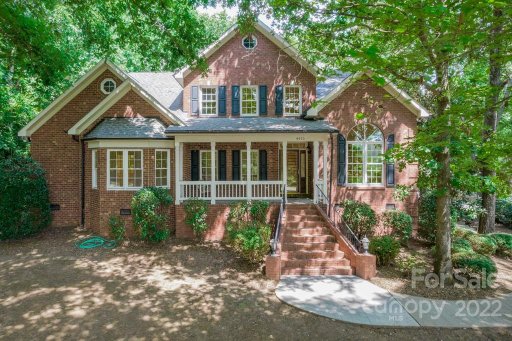
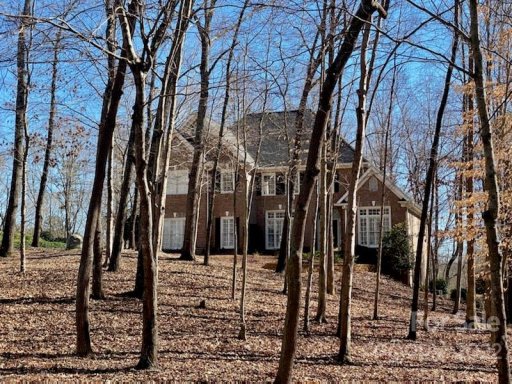
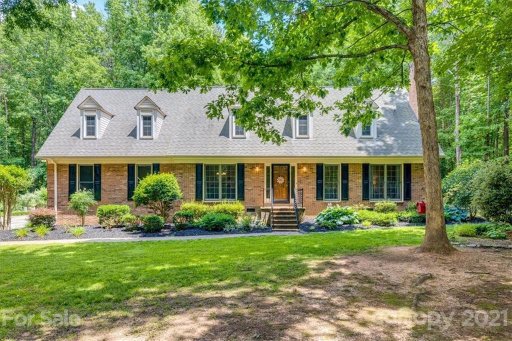
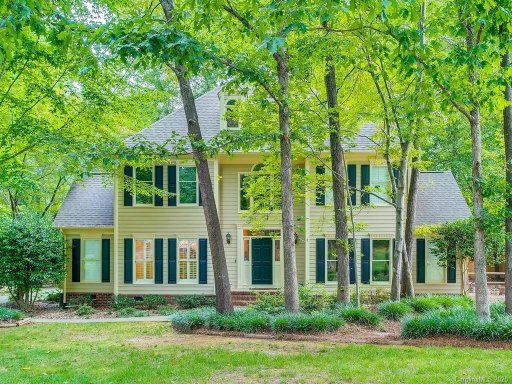
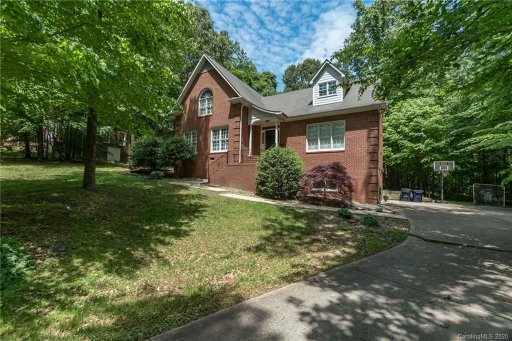
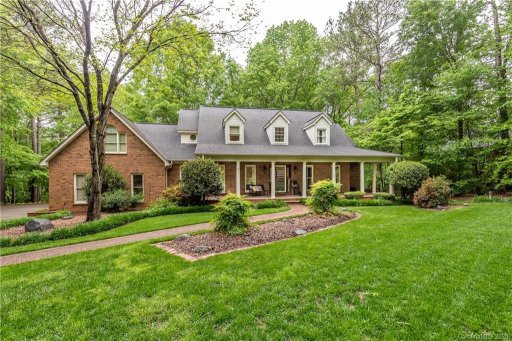
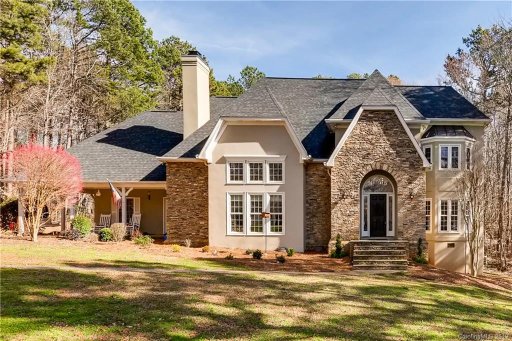
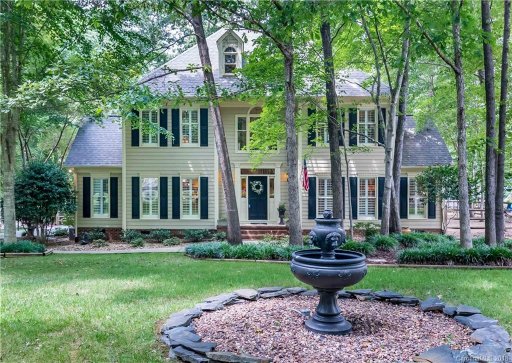
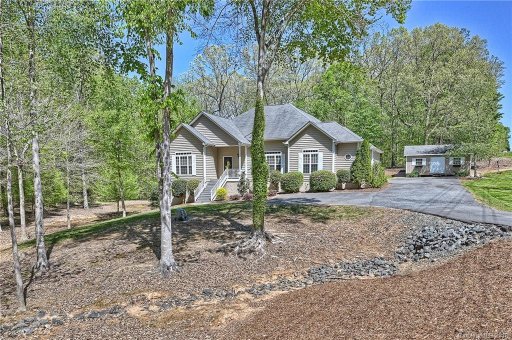
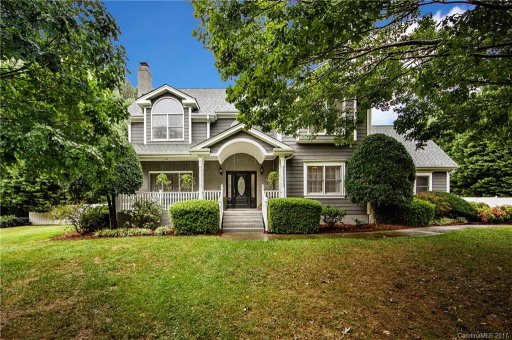
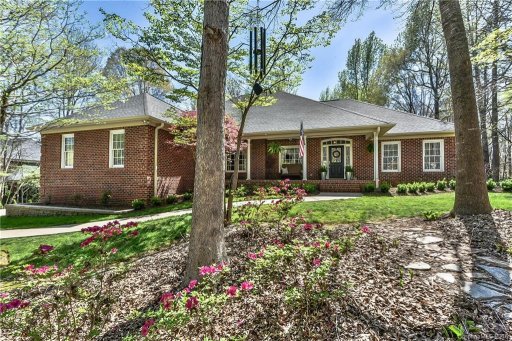
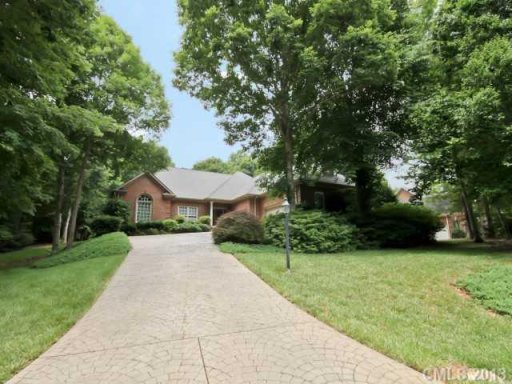
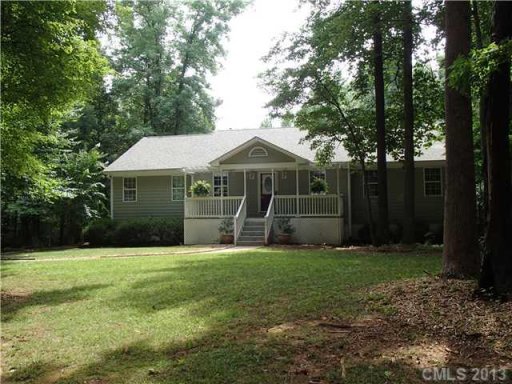
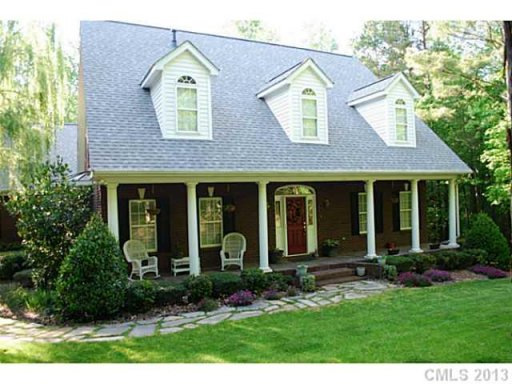
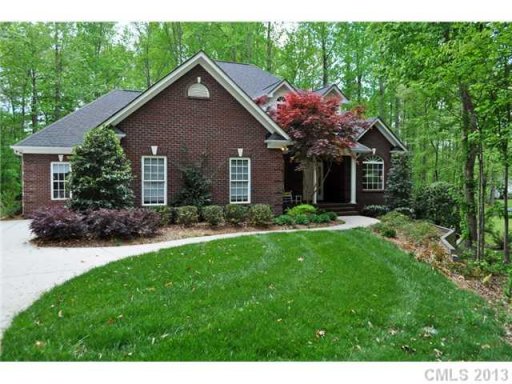
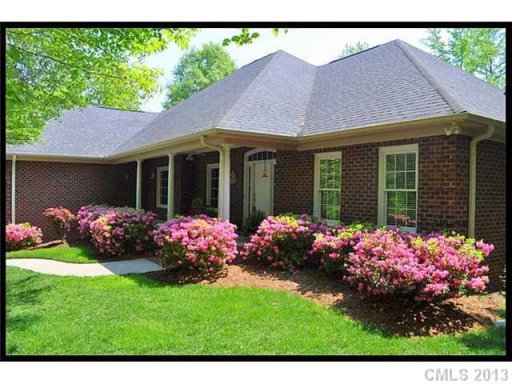
Cobblestone in Matthews feels like a tucked-away pocket of larger-lot homes, where mature trees, long driveways, and generous setbacks create an unmistakably established setting. The streets lean custom rather than cookie-cutter, and many homes make a point of their outdoor living spaces, from screened porches and decks to patios that look out over wooded backyards. It is the kind of neighborhood where the homes themselves do a lot of the talking.
"Custom homes, deep lots, and a wooded backdrop give Cobblestone its understated appeal."
Home Styles & Community Feel
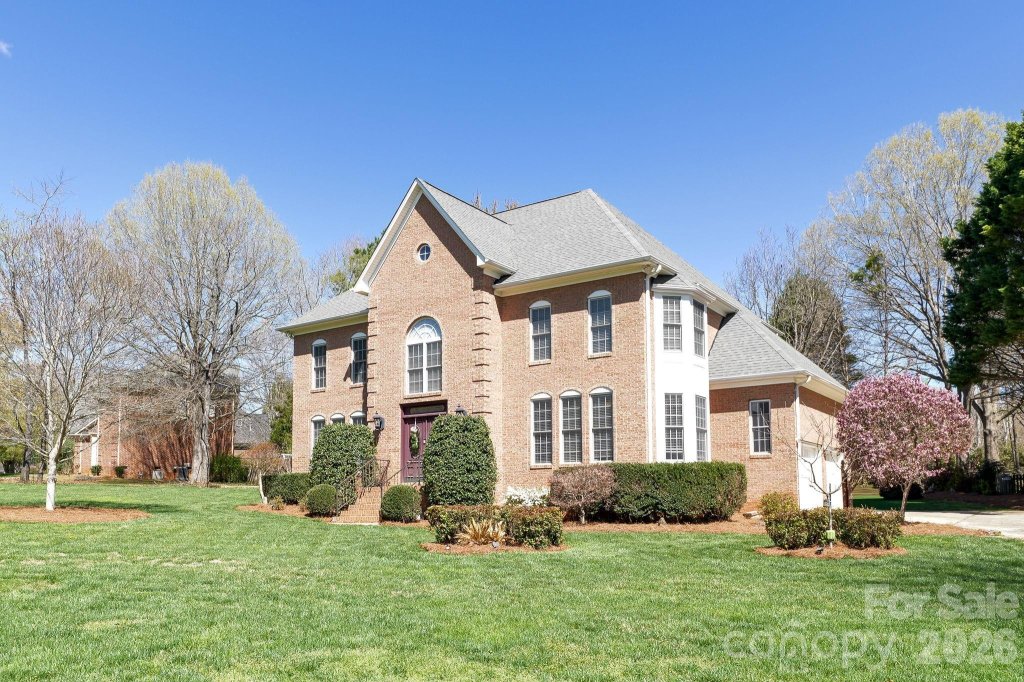
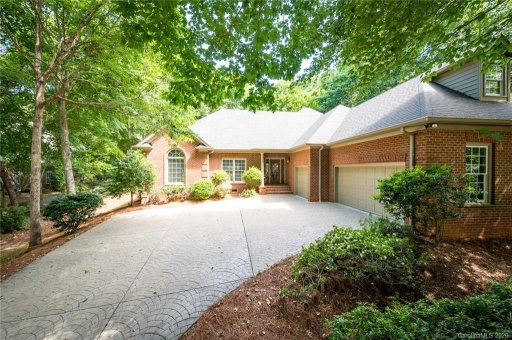
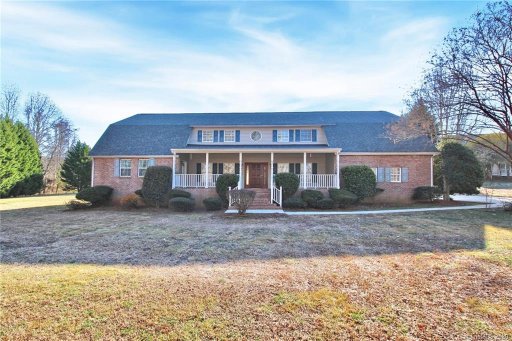
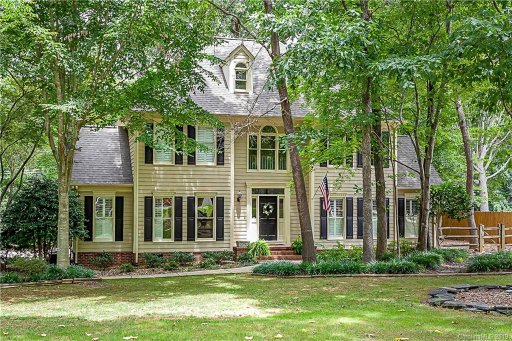
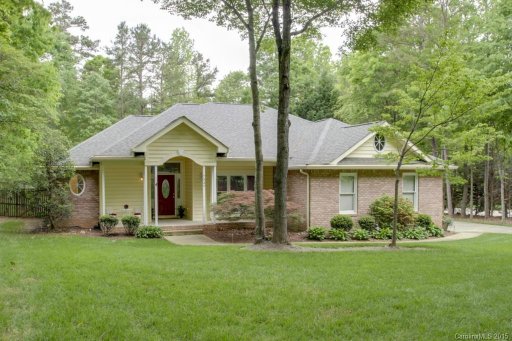
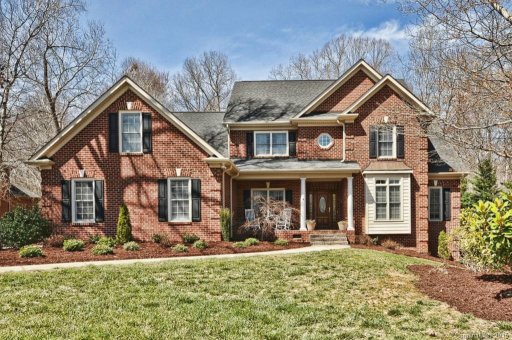
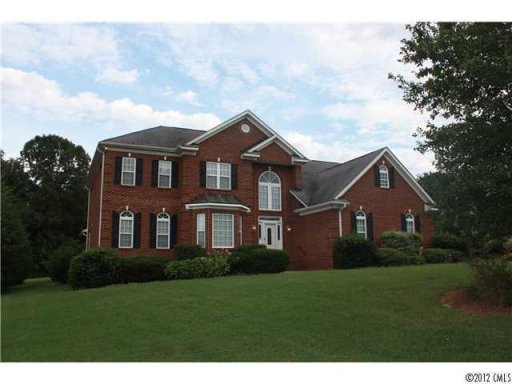
The housing here is almost entirely single-family, with a strong custom-home character that shows up in the details: hardwood floors, formal dining rooms, fireplaces, large kitchens with islands, and flexible bonus spaces. Brick is a recurring theme, though not every home is brick; many properties feature brick exteriors or brick accents alongside stucco, full brick, or mixed finishes. Lot sizes are notably substantial, often around an acre or more, which gives the neighborhood a spacious, private feel without losing the sense of a cohesive community.
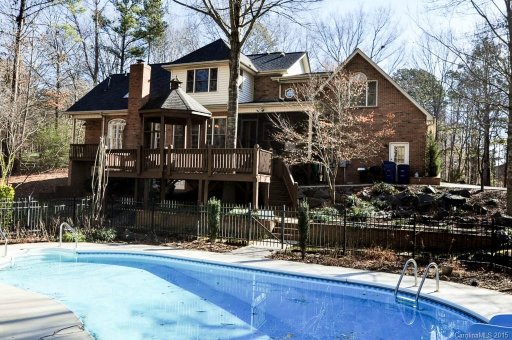
Basements appear on a meaningful share of homes, and garages are a near-universal feature, including side-load and detached options. Inside, the layouts tend to be practical and gracious at the same time, with main-level suites, guest rooms, offices, lofts, and bonus rooms showing up often. The overall impression is of homes built for comfort, storage, and everyday flexibility rather than trend-driven design.
These insights are based on listing details and are informational only; verify details for any specific property.
Market Trends
Buyers have more negotiating power. Properties may take longer to sell. Prices have declined 31%.
Year-over-Year Comparison
Last 12 months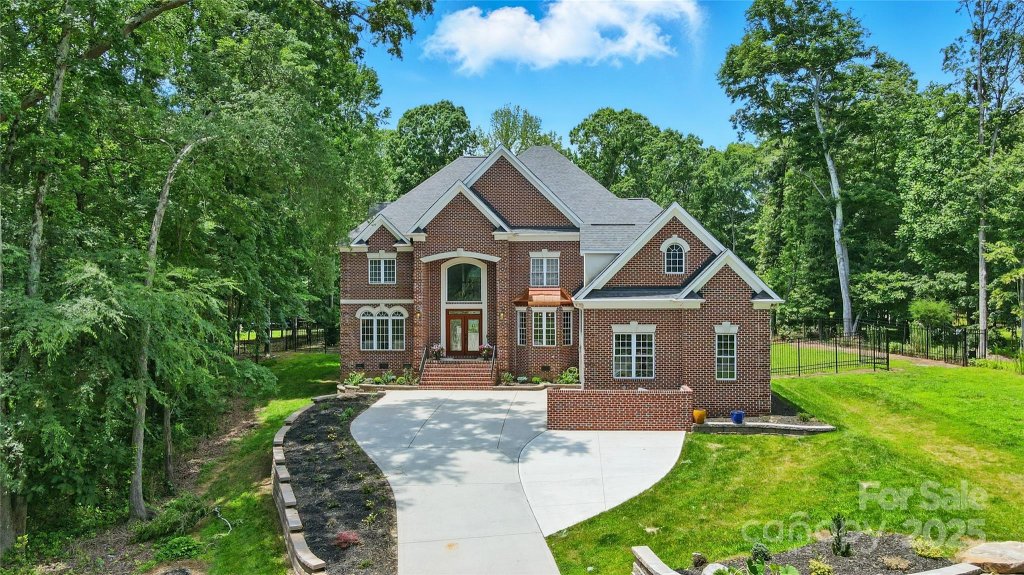

Recently Sold Properties
| Property | Sold Date▼ | Sale Price↕ | DOM↕ | LP/SP↕ | Size↕ | $/SF↕ |
|---|---|---|---|---|---|---|
 SOLD 7324 Cobblecreek Drive 4 bed3 bath | Apr 2 2026 | $865,000 | 178 | 97% | 3051 sq ft | $284 |
 SOLD 2683 Beulah Church Road 4 bed2 bath | Feb 27 2026 | $719,000 | 350 | 99% | 3297 sq ft | $218 |
5 month gap in market activity | ||||||
 SOLD 7306 Cobblecreek Drive 4 bed3 bath | Sep 12 2025 | $1.25M | 28 | 🎯100% | 4656 sq ft | $268 |
1+ year gap in market activity | ||||||
 SOLD 7222 Cobblecreek Drive 3 bed2 bath | Mar 14 2024 | $1.20M | 48 | 92% | 2908 sq ft | $413 |
1+ year gap in market activity | ||||||
 SOLD 7133 Cobblecreek Drive 4 bed3 bath | Dec 15 2022 | $600,000 | 181 | 98% | 3403 sq ft | $176 |
 SOLD 4470 Antioch Church Road 5 bed3 bath | Nov 3 2022 | $755,000 | 75 | 97% | 3935 sq ft | $192 |
7 month gap in market activity | ||||||
 SOLD 216 Pebble Stone Lane 3 bed3 bath | Apr 6 2022 | $700,000 | 48 | 🎯104% | 3536 sq ft | $198 |
8 month gap in market activity | ||||||
 SOLD 7138 Cobblecreek Drive 3 bed2 bath | Aug 9 2021 | $498,000 | 39 | 🎯100% | 2588 sq ft | $192 |
 SOLD 7248 Cobblecreek Drive 4 bed3 bath | Aug 6 2021 | $540,000 | 50 | 🎯103% | 2654 sq ft | $203 |
 SOLD 201 Pebble Stone Lane 4 bed3 bath | Aug 3 2021 | $585,000 | 42 | 🎯105% | 2820 sq ft | $207 |
6 month gap in market activity | ||||||
 SOLD 7209 Cobblecreek Drive 5 bed3 bath | Jan 8 2021 | $490,000 | 183 | 🎯102% | 3170 sq ft | $155 |
4 month gap in market activity | ||||||
 SOLD 215 Pebble Stone Lane 4 bed3 bath | Aug 19 2020 | $492,755 | 68 | 99% | 3914 sq ft | $126 |
 SOLD 7316 Cobblecreek Drive 3 bed2 bath | Aug 12 2020 | $386,225 | 111 | 97% | 2965 sq ft | $130 |
 SOLD 7226 Cobblecreek Drive 4 bed4 bath | Aug 6 2020 | $430,000 | 105 | 99% | 4293 sq ft | $100 |
 SOLD 7109 Cobblecreek Drive 4 bed3 bath | Jun 29 2020 | $560,000 | 39 | 🎯101% | 3721 sq ft | $150 |
10 month gap in market activity | ||||||
 SOLD 7209 Cobblecreek Drive 5 bed3 bath | Aug 23 2019 | $425,000 | 24 | 🎯100% | 3170 sq ft | $134 |
4 month gap in market activity | ||||||
 SOLD 7128 Cobblecreek Drive 3 bed3 bath | Apr 8 2019 | $495,000 | 40 | 🎯104% | 4491 sq ft | $110 |
4 month gap in market activity | ||||||
 SOLD 7209 Cobblecreek Drive 4 bed3 bath | Nov 16 2018 | $410,000 | 160 | 94% | 3157 sq ft | $130 |
5 month gap in market activity | ||||||
 SOLD 7230 Cobblecreek Drive 3 bed2 bath | Jun 4 2018 | $365,000 | 40 | 🎯100% | 2637 sq ft | $138 |
8 month gap in market activity | ||||||
 SOLD 7240 Cobblecreek Drive 4 bed3 bath | Sep 29 2017 | $390,000 | 50 | 🎯100% | 2863 sq ft | $136 |
1+ year gap in market activity | ||||||
 SOLD 240 Pebble Stone Lane 4 bed3 bath | May 13 2016 | $445,000 | 43 | 🎯100% | 3612 sq ft | $123 |
9 month gap in market activity | ||||||
 SOLD 7337 Cobblecreek Drive 3 bed2 bath | Aug 5 2015 | $280,000 | 92 | 98% | 2100 sq ft | $133 |
 SOLD 223 Pebble Stone Lane 16 4 bed4 bath | Jul 7 2015 | $518,500 | 145 | 97% | 5041 sq ft | $103 |
 SOLD 7109 Cobblecreek Drive 4 bed3 bath | May 20 2015 | $450,000 | 98 | 95% | 3721 sq ft | $121 |
1+ year gap in market activity | ||||||
 SOLD 215 Pebble Stone Lane 4 bed3 bath | Nov 8 2013 | $440,000 | 156 | 95% | 3935 sq ft | $112 |
 SOLD 7331 Cobble Creek Drive 4 bed3 bath | Oct 29 2013 | $299,600 | 292 | 91% | 2931 sq ft | $102 |
3 month gap in market activity | ||||||
 SOLD 7141 Cobblecreek Drive 6 bed3 bath | Jul 22 2013 | $409,000 | 83 | 96% | 3150 sq ft | $130 |
 SOLD 208 Pebble Stone Lane 4 bed3 bath | Jul 19 2013 | $425,000 | 92 | 95% | 4074 sq ft | $104 |
 SOLD 240 Pebble Stone Lane 4 bed3 bath | Jul 11 2013 | $405,000 | 85 | 95% | 3612 sq ft | $112 |
1+ year gap in market activity | ||||||
 SOLD 2675 Beulah Church Road 5 bed3 bath | Apr 19 2012 | $310,000 | 70 | 90% | 3500 sq ft | $89 |
7324 Cobblecreek Drive
$865,000
2683 Beulah Church Road
$719,000
7306 Cobblecreek Drive
$1,249,000
7222 Cobblecreek Drive
$1,200,000
7133 Cobblecreek Drive
$600,000
4470 Antioch Church Road
$755,000
216 Pebble Stone Lane
$700,000
7138 Cobblecreek Drive
$498,000
7248 Cobblecreek Drive
$540,000
201 Pebble Stone Lane
$585,000
7209 Cobblecreek Drive
$490,000
215 Pebble Stone Lane
$492,755
7316 Cobblecreek Drive
$386,225
7226 Cobblecreek Drive
$430,000
7109 Cobblecreek Drive
$560,000
7209 Cobblecreek Drive
$425,000
7128 Cobblecreek Drive
$495,000
7209 Cobblecreek Drive
$410,000
7230 Cobblecreek Drive
$365,000
7240 Cobblecreek Drive
$390,000
240 Pebble Stone Lane
$445,000
7337 Cobblecreek Drive
$280,000
223 Pebble Stone Lane 16
$518,500
7109 Cobblecreek Drive
$450,000
215 Pebble Stone Lane
$440,000
7331 Cobble Creek Drive
$299,600
7141 Cobblecreek Drive
$409,000
208 Pebble Stone Lane
$425,000
240 Pebble Stone Lane
$405,000
2675 Beulah Church Road
$310,000
Market Statistics
The Cobblestone real estate market shows buyer's market conditions. Homes typically sell within 83 days. With 2 active listings and 3 homes sold in the past year, Buyers have more negotiating power and time to decide.
Pricing
Median Price:$855,000
Average Price:$855,000
Property Details
Avg Bedrooms:4.0
Avg Bathrooms:2.9
Avg Lot Size:1.39 acres
Market Activity
Active Listings:2
Sold Last Year:3
Median Days to Sell:83 days
Community Info
Median Year Built:1996
New Construction:0%
Recently Off Market Properties
1 propertyLooking for similar properties?
These properties are no longer available, but we can help you find similar homes in Cobblestone. Our agents have access to upcoming listings and can notify you when new properties become available.