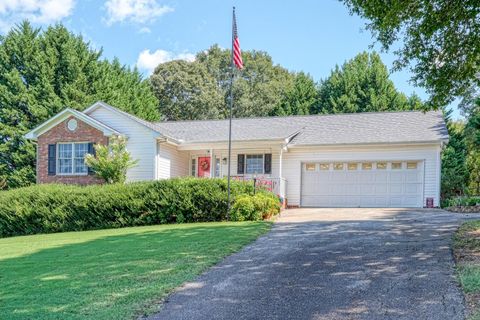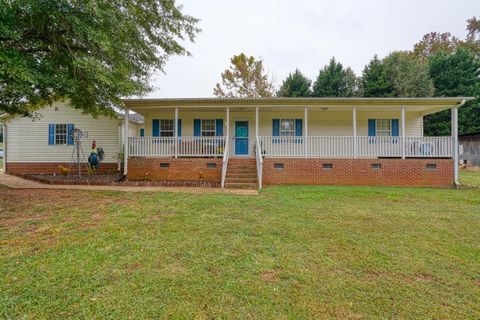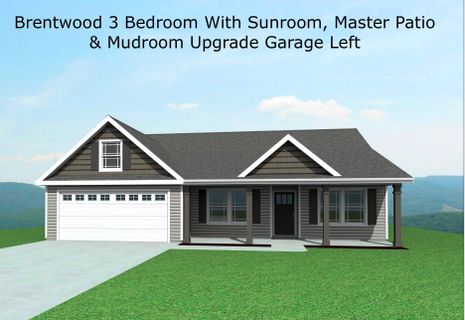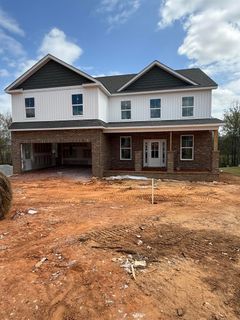
Active
$305,000 $177/sqft
210 Amy Street
Lyman, SC 29365-9566
3 bd · 2 ba · 1,727 sqft · 1999 · 5 mo ago
Fireplace Garage
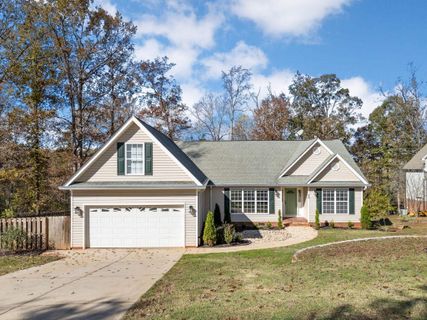
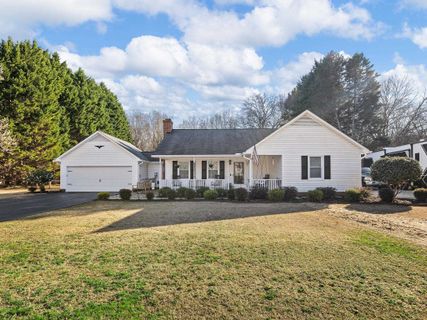
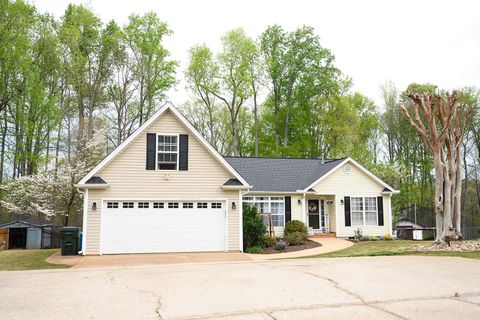
Ez Heights in Lyman has the feel of an established residential pocket with room to breathe.
Community overview based on MLS listing data for Ez Heights, Lyman
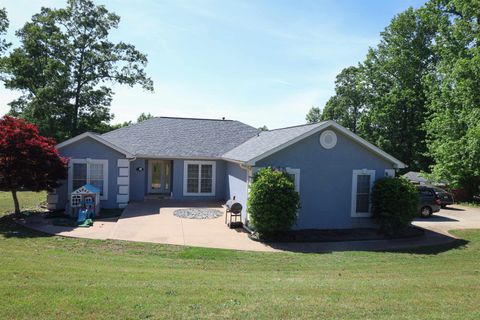
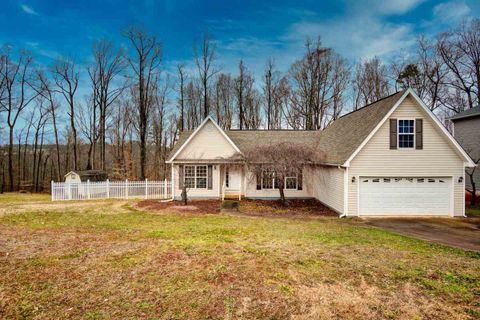
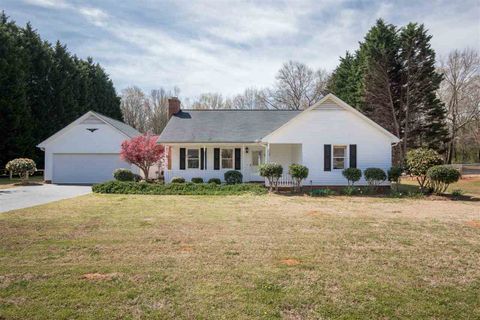
Ez Heights in Lyman has the feel of an established residential pocket with room to breathe. The streets are lined with single-family homes on generous lots, and the setting leans into everyday livability: front porches, mature trees, fenced yards, and practical extras like workshops, outbuildings, and oversized garages. Creek views and wooded backdrops show up often enough to shape the neighborhood’s personality, giving many homes a more relaxed edge than you’d expect so close to major commuter routes.
"Spacious lots and useful outbuildings give Ez Heights a distinctly lived-in, practical charm."
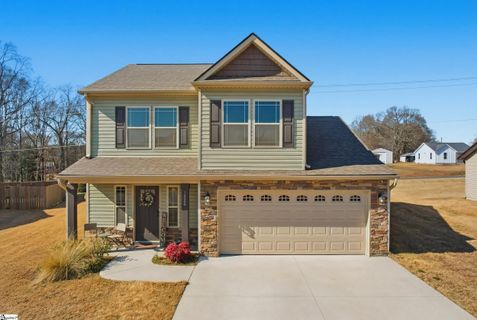
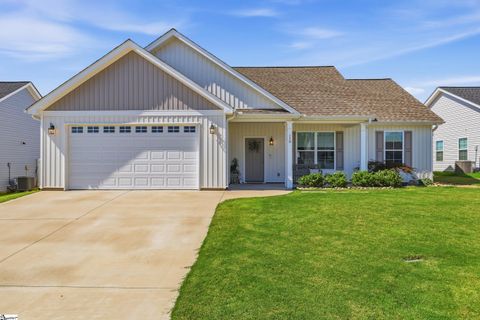
The housing stock is mostly ranch-style and one-level homes, with a few properties offering finished or partially finished basements and bonus spaces over the garage. Construction dates run from the late 1970s through the mid-2000s, so you’ll see a mix of older character and more updated interiors. Inside, open floor plans, gas fireplaces, laminate or luxury vinyl plank flooring, and split-bedroom layouts are common themes. Many homes feature brick exteriors, while others lean toward traditional siding or mixed materials. Oversized detached buildings, fenced backyards, and side-entry or attached garages add a practical, utility-first feel that stands out in daily use.
Ez Heights is not an amenity-heavy subdivision, but it offers the kind of features people use every day: large lots, workshop space, storage, porches, decks, and backyards that invite gardening or simple outdoor time. A creek and occasional wooded edges bring a natural backdrop to the community, and Lyman Lake access is close enough to be part of the local rhythm. The neighborhood’s appeal comes from flexibility rather than flash—space for vehicles, hobbies, and outdoor living, with enough privacy to make the setting feel personal.
"This is a neighborhood where usable space matters as much as the house itself."
Ez Heights sits in Lyman, in the Spartanburg County area along the Lee Street corridor, with quick access to I-85 and straightforward connections toward Greer, Spartanburg, and Greenville. Listings also note easy access to local shopping and dining, plus nearby recreation at Lyman Lake and Lake Cooley public access. School assignments are consistently Lyman Elem, Dr Hill Middle, and Byrnes High, within Spartanburg School District 5. That school district reference, along with the community’s commuter-friendly location, helps explain why this pocket remains steady in appeal for buyers who want a practical Upstate base with a small-town setting.
Palmetto Park Realty Team · Lyman
Ask about Ez Heights — we answer fast
See what it's worth — your home's own sale history plus recent Ez Heights sales, free.
What's my home worth?Communities similar to Ez Heights
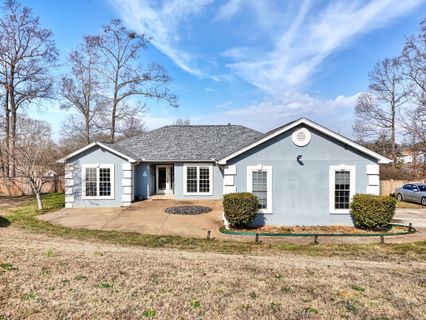
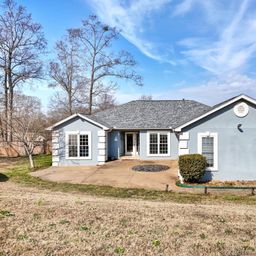
16 recently sold in Ez Heights, Lyman
| Property | Sold | Sold Price | Days on Market | Size | Sold to Ask | Sold $/SF |
|---|---|---|---|---|---|---|
| | Apr 23 2026 | $337,500 | 220 | 1,512 sq ft | 100.4% | $223 |
| | Feb 3 2025 | $325,000 | 77 | 2,018 sq ft | 95.9% | $161 |
| | May 17 2024 | $288,000 | 16 | 1,384 sq ft | 104.7% | $208 |
| | May 26 2023 | $335,000 | 53 | 2,337 sq ft | 97.1% | $143 |
| | Apr 28 2023 | $259,500 | 43 | 1,452 sq ft | 104.2% | $179 |
| | Aug 16 2022 | $260,000 | 88 | 1,782 sq ft | 91.2% | $146 |
| | Mar 3 2021 | $242,000 | 36 | 2,059 sq ft | 105.3% | $118 |
| | Apr 18 2019 | $156,000 | 20 | 1,368 sq ft | 104.1% | $114 |
| | Mar 28 2013 | $135,000 | 182 | 1,285 sq ft | 96.5% | $105 |
| | Jul 31 2012 | $119,500 | 128 | 1,416 sq ft | 99.7% | $84 |
| | Jan 31 2012 | $87,000 | 193 | 1,323 sq ft | 99.4% | $66 |
| | Jun 29 2011 | $124,500 | 68 | 1,464 sq ft | 97.6% | $85 |
| | May 20 2011 | $150,000 | 123 | 1,956 sq ft | 93.8% | $77 |
| | Jul 30 2010 | $130,000 | 65 | 1,360 sq ft | 97.4% | $96 |
| | Jul 31 2009 | $120,000 | 193 | 1,493 sq ft | 96.1% | $80 |
| | May 21 2007 | $125,500 | 107 | 1,464 sq ft | 96.9% | $86 |
Closed sales from MLS history for Ez Heights, Lyman
Below trend-line threshold — city median shown for context
The Ez Heights real estate market shows buyer's market conditions. Homes typically sell within 148 days. With 1 active listing and 2 homes sold in the past year, buyers have more negotiating power and time to decide.
Free account needed — create one to continue viewing homes.
Members see everything — free👋 Still browsing Ez Heights?
Full photos, price history, and every active & pending home in Ez Heights with a free account.
Palmetto Park Realty Team
 $305K
$305KCheck your messages
We sent a code to .
Verify your number and we'll text you price drops and new Ez Heights listings. 1–2 texts a month, stop anytime.
Enjoy full access to this home and every home on Palmetto Park.