Active
$165,000 $124/sqft
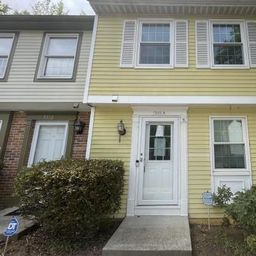
7352 Pebblestone Drive
Charlotte, NC 28212
2 bd · 1 ba · 1,336 sqft · 1982 · 3 mo ago
Fireplace
Waterford sits in one of Charlotte’s most established SouthPark pockets, where townhome-style living meets a polished, low-maintenance setting.
Community overview based on MLS listing data for Waterford, Charlotte
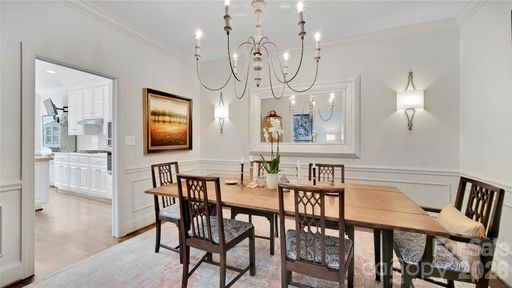
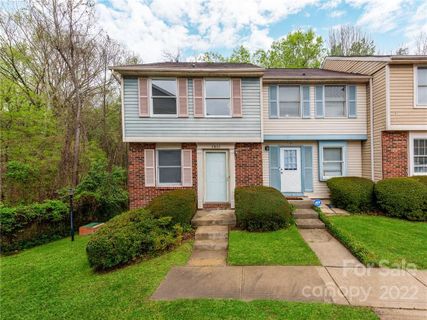
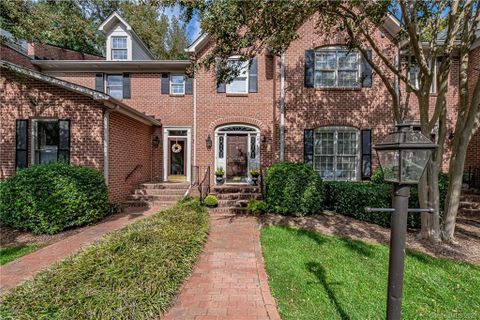
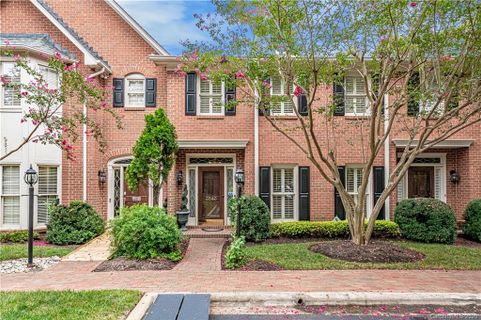
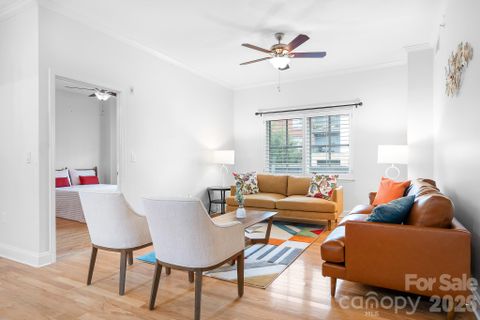
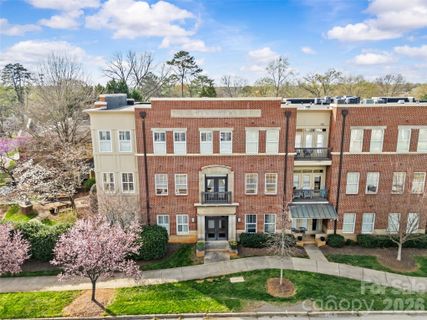
Waterford sits in one of Charlotte’s most established SouthPark pockets, where townhome-style living meets a polished, low-maintenance setting. The neighborhood has a composed, residential feel with mature wooded backdrops, tucked-away courtyards, and a streetscape that feels more private than dense. Homes here often lean toward thoughtful updates, and many have been refreshed with hardwoods, granite, built-ins, and sunrooms that extend the living space.
"SouthPark convenience and wooded privacy come together in a compact, well-kept setting."
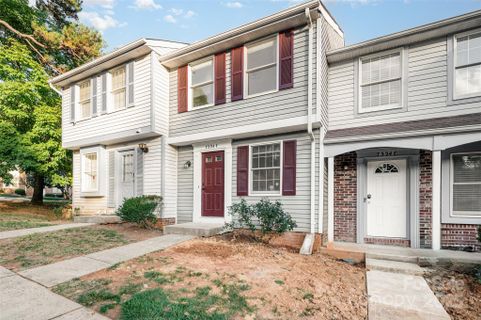
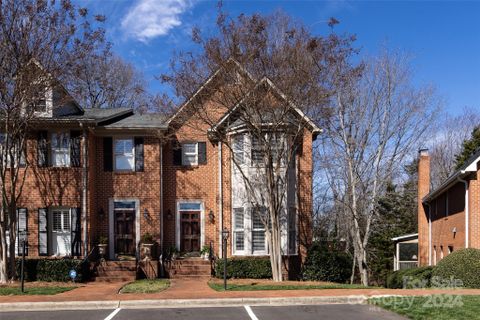
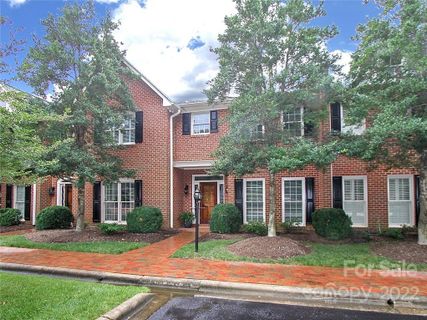
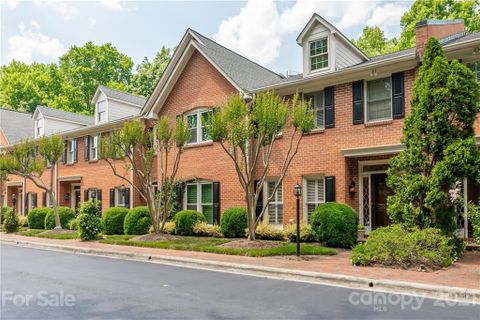
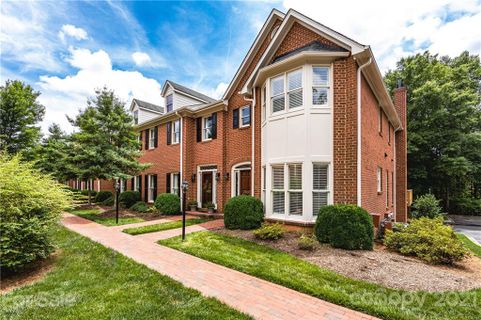
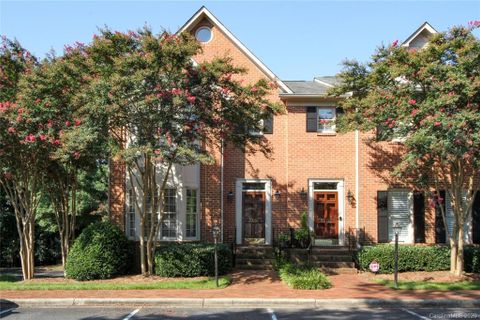
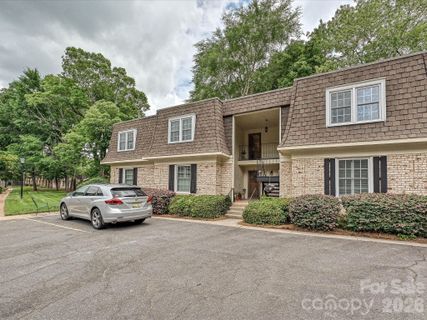
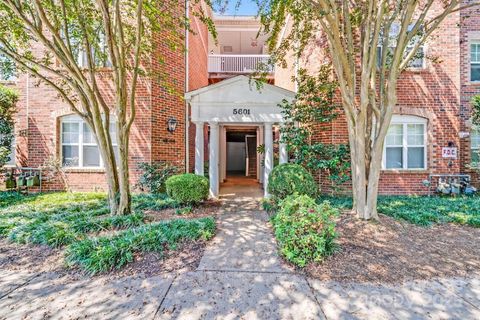
The community is made up primarily of condominiums and townhomes built from the early 1980s through the early 1990s. Many homes feature brick exteriors, and the architecture tends to favor two-story layouts with finished or partially finished basements, attached garages in many units, and flexible rooms that work well as offices, dens, or bonus spaces. Interiors commonly highlight open dining and living areas, fireplaces, plantation shutters, and private decks or screened porches overlooking trees rather than busy streets.
Waterford’s appeal is in its balance: it offers a more polished, maintenance-conscious lifestyle without feeling overly uniform. End-unit placements, wooded views, and rear-load garages show up often enough to shape the neighborhood’s character, while the smaller lot sizes keep the focus on the homes themselves and the surrounding greenery.
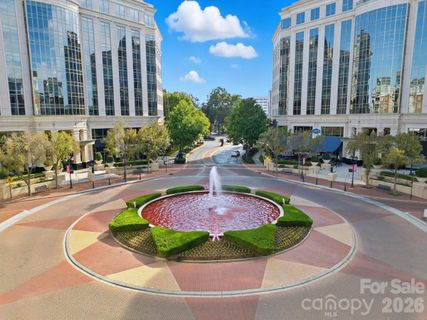
Daily life here is closely tied to convenience. Residents can walk to Phillips Place from some homes, and nearby SouthPark shopping, restaurants, Whole Foods, and the broader retail-and-dining mix along the corridor keep errands straightforward. Several listings also point to walking trails and nearby greenways, giving the neighborhood a pleasant outdoor rhythm between shopping trips and commutes. The setting feels especially connected to the essentials, with quick access to everyday services and a strong sense of being near the center of SouthPark activity.
"It is the kind of place where errands, dining, and a wooded view can all fit into the same afternoon."
Waterford is positioned in SouthPark, with direct access to the Charlotte core via Independence Blvd (US-74). Listings note easy routes to Uptown Charlotte, I-485, Monroe Road, and major roadways, with one older remark placing the community just minutes from Downtown and I-485. The location also ties into Central Avenue dining and the SouthPark shopping and restaurant scene, while Phillips Place remains a recurring nearby destination.
School assignments commonly point to Sharon Elementary, Alexander Graham Middle, and Myers Park High, and the neighborhood is served by Charlotte-Mecklenburg Schools. For buyers who want a SouthPark address with strong access to retail, commuter corridors, and established school assignments, Waterford lands squarely in the center of the map.
Palmetto Park Realty Team · Charlotte
Ask about Waterford — we answer fast
See what it's worth — your home's own sale history plus recent Waterford sales, free.
What's my home worth?Communities similar to Waterford
 0.2 mi
 Colony Crossing, Charlotte
4 active · $312,000
 0.9 mi
 The Lofts At Morrison, Charlotte
4 active · $321,200
 1.0 mi
 Trianon, Charlotte
4 active · $300,000
 1.4 mi
 Wren Crest, Charlotte
2 active · $427,450
 1.1 mi
 Piedmont Row, Charlotte
16 active · $394,999
 2.2 mi
 Selwyn Terrace, Charlotte
2 active · $445,000
32 recently sold in Waterford, Charlotte
| Property | Sold | Sold Price | Days on Market | Size | Sold to Ask | Sold $/SF |
|---|---|---|---|---|---|---|
| | Mar 31 2026 | $230,000 | 172 | 1,245 sq ft | 100.0% | $185 |
| | Mar 20 2024 | $630,000 | 28 | 2,000 sq ft | 100.8% | $315 |
| | Jun 28 2023 | $620,000 | 34 | 2,887 sq ft | 103.6% | $215 |
| | Sep 1 2022 | $525,000 | 21 | 1,858 sq ft | 100.0% | $283 |
| | May 4 2022 | $160,000 | 26 | 1,110 sq ft | 106.7% | $144 |
| | Aug 20 2021 | $458,000 | 84 | 2,131 sq ft | 97.5% | $215 |
| | Aug 5 2021 | $487,500 | 52 | 2,194 sq ft | 97.7% | $222 |
| | Feb 5 2021 | $481,000 | 108 | 2,624 sq ft | 98.4% | $183 |
| | Nov 30 2020 | $470,000 | 80 | 2,343 sq ft | 98.9% | $201 |
| | Oct 2 2020 | $421,000 | 52 | 2,080 sq ft | 96.8% | $202 |
| | Feb 27 2020 | $430,000 | 107 | 2,149 sq ft | 95.6% | $200 |
| | Sep 4 2019 | $435,000 | 74 | 2,138 sq ft | 97.8% | $203 |
| | Apr 4 2019 | $423,500 | 42 | 2,359 sq ft | 92.1% | $180 |
| | Dec 17 2018 | $430,000 | 69 | 2,017 sq ft | 97.7% | $213 |
| | Dec 15 2017 | $360,000 | 112 | 2,251 sq ft | 98.6% | $160 |
| | Nov 16 2017 | $420,000 | 67 | 2,275 sq ft | 98.8% | $185 |
| | Oct 25 2017 | $370,000 | 56 | 2,060 sq ft | 98.7% | $180 |
| | Mar 1 2017 | $57,000 | 125 | 1,110 sq ft | 96.6% | $51 |
| | Nov 30 2016 | $342,000 | 42 | 2,165 sq ft | 97.7% | $158 |
| | Aug 25 2016 | $367,800 | 444 | 2,070 sq ft | 98.1% | $178 |
| | Jun 24 2016 | $411,000 | 42 | 2,814 sq ft | 99.1% | $146 |
| | Jun 16 2016 | $360,000 | 63 | 2,149 sq ft | 97.4% | $168 |
| | May 5 2016 | $52,000 | 70 | 1,120 sq ft | 104.2% | $46 |
| | Sep 18 2015 | $47,500 | 84 | 1,110 sq ft | 91.5% | $43 |
| | Sep 19 2014 | $330,000 | 49 | 1,922 sq ft | 100.0% | $172 |
| | May 7 2014 | $255,000 | 214 | 2,266 sq ft | 91.1% | $113 |
| | Nov 4 2013 | $335,000 | 144 | 2,814 sq ft | 95.7% | $119 |
| | Jan 30 2013 | $320,000 | 111 | 2,701 sq ft | 100.0% | $118 |
| | Jan 25 2013 | $256,000 | 59 | 2,286 sq ft | 96.6% | $112 |
| | Sep 11 2012 | $32,000 | 64 | 1,290 sq ft | 107.0% | $25 |
| | Mar 12 2012 | $210,000 | 251 | 1,953 sq ft | 93.3% | $108 |
| | Jan 31 2012 | $257,500 | 356 | 1,984 sq ft | 90.4% | $130 |
Closed sales from MLS history for Waterford, Charlotte
Waterford median sale price is $470,000.
Below trend-line threshold — too few sales for a 12-month median
+1 outside price range.
The Waterford real estate market shows buyer's market conditions. Homes typically sell within 69 days. With 2 active listings and 1 home sold in the past year, buyers have more negotiating power and time to decide.
Free account needed — create one to continue viewing homes.
Members see everything — free👋 Still browsing Waterford?
Full photos, price history, and every active & pending home in Waterford with a free account.
Palmetto Park Realty Team
 $165K
$165K $800K
$800KCheck your messages
We sent a code to .
Verify your number and we'll text you price drops and new Waterford listings. 1–2 texts a month, stop anytime.
Enjoy full access to this home and every home on Palmetto Park.