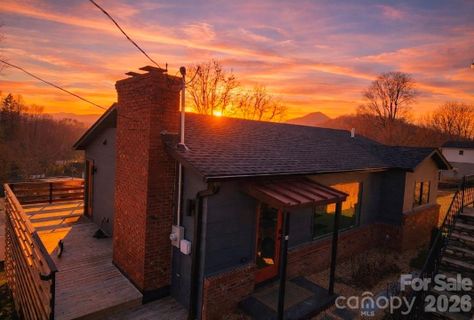
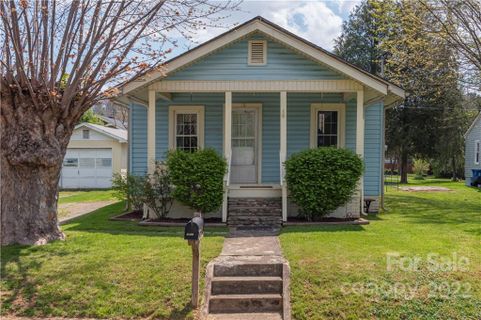
Active
$298,000 $267/sqft
212 Holtzclaw Street
Canton, NC 28716
2 bd · 2 ba · 1,118 sqft · 1947 · 4 mo ago
Garage
Highland Park in Canton has the feel of an established mountain neighborhood that still sits close to the town’s center of gravity.
Community overview based on MLS listing data for Highland Park, Canton
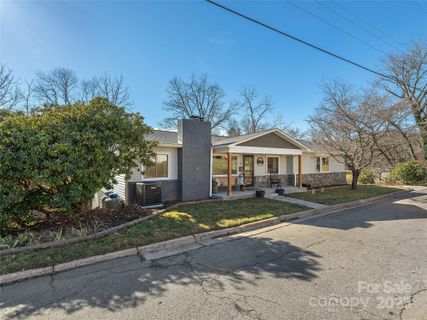
Highland Park in Canton has the feel of an established mountain neighborhood that still sits close to the town’s center of gravity. Many homes rise on generous lots, and the setting leans into what people come here for: long-range mountain views, mature landscaping, and a streetscape that feels rooted rather than newly built. The neighborhood’s character comes through in its older cottages, bungalows, and renovated ranch homes, with a mix of original charm and thoughtful updates.
"Mountain views, classic homes, and a location close to downtown give Highland Park its enduring appeal."
Architecture here is primarily single-family, with homes dating from the early 1910s through the early 1970s. That range gives Highland Park a layered look: some houses keep their vintage bones, while others have been refreshed with modern kitchens, updated baths, new windows, and reworked systems. Brick appears often enough to shape the neighborhood’s look, though it is not the only story; there are also ranches, bungalows, cottages, and farmhouse-style renovations. Basements are especially common, and many homes include garages, carports, or extra storage space. Lot sizes tend to feel roomy for an in-town setting, and several properties highlight decks, porches, patios, and usable yards.
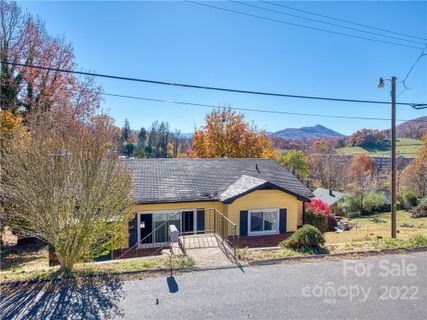
Highland Park’s daily rhythm is tied to downtown Canton. Residents are close to local restaurants, breweries, shops, parks, and recreation spots, and several listings place the neighborhood within walking distance of the town center. The streets themselves are part of the appeal: corner lots, wide roads, and homes set back from the main flow create a relaxed residential backdrop without feeling disconnected from town. Outdoor living shows up again and again, whether it is a front porch, a private deck, a two-tiered outdoor space, or a yard overlooking Pharr Branch or a small creek. Mountain views are a signature feature, and some homes also offer direct access to water-adjacent scenery. The result is a neighborhood that feels practical day to day, but still distinctly tied to the landscape around it.
"It is the kind of place where a short walk or quick drive can take you from a front porch to downtown Canton."
Highland Park sits in Canton’s established in-town area, with convenient access to downtown Canton and easy reach toward Asheville and Waynesville. Public remarks place downtown Canton about 0.4 miles to 5 minutes away in several listings, while Asheville is commonly described as about 20 to 30 minutes away and Waynesville around 11 to 20 minutes away, depending on the route and property. Some remarks also reference Maggie Valley and Cherokee for broader mountain-region access. Nearby destinations include downtown Canton’s shops, restaurants, breweries, parks, playgrounds, and the recreation park, along with the Pigeon River and local green space. School assignments are Meadowbrook Elementary, Canton Middle, and Pisgah High, placing the community within the local Canton school pattern.
Palmetto Park Realty Team · Canton
Ask about Highland Park — we answer fast
See what it's worth — your home's own sale history plus recent Highland Park sales, free.
What's my home worth?Communities similar to Highland Park
32 recently sold in Highland Park, Canton
| Property | Sold | Sold Price | Days on Market | Size | Sold to Ask | Sold $/SF |
|---|---|---|---|---|---|---|
| | Mar 13 2026 | $405,000 | 58 | 1,889 sq ft | 95.3% | $214 |
| | Feb 17 2026 | $365,000 | 67 | 1,768 sq ft | 100.0% | $206 |
| | Jan 7 2026 | $245,000 | 229 | 1,404 sq ft | 98.2% | $175 |
| | Feb 20 2025 | $260,000 | 121 | 782 sq ft | 96.7% | $332 |
| | Oct 29 2024 | $399,000 | 62 | 1,739 sq ft | 100.1% | $229 |
| | Jul 27 2023 | $255,000 | 94 | 1,162 sq ft | 88.2% | $219 |
| | Jul 12 2023 | $369,000 | 34 | 1,615 sq ft | 108.8% | $228 |
| | Apr 28 2023 | $135,000 | 174 | 952 sq ft | 90.0% | $142 |
| | Apr 11 2023 | $190,000 | 41 | 800 sq ft | 95.0% | $238 |
| | Jul 7 2022 | $210,000 | 51 | 968 sq ft | 105.5% | $217 |
| | Jun 27 2022 | $202,500 | 59 | 1,153 sq ft | 101.3% | $176 |
| | Mar 10 2022 | $305,000 | 60 | 1,827 sq ft | 101.7% | $167 |
| | Mar 16 2021 | $304,000 | 57 | 1,946 sq ft | 101.3% | $156 |
| | Aug 14 2020 | $202,000 | 346 | 1,348 sq ft | 96.7% | $150 |
| | Jan 24 2020 | $132,000 | 98 | 734 sq ft | 102.7% | $180 |
| | Oct 10 2019 | $250,000 | 245 | 2,458 sq ft | 89.9% | $102 |
| | Aug 14 2019 | $148,500 | 33 | 1,008 sq ft | 90.0% | $147 |
| | May 16 2019 | $205,000 | 31 | 1,371 sq ft | 100.0% | $150 |
| | Nov 6 2017 | $250,000 | 36 | 2,127 sq ft | 104.2% | $118 |
| | Oct 30 2017 | $130,000 | 68 | 1,173 sq ft | 113.0% | $111 |
| | Dec 27 2016 | $175,000 | 99 | 1,514 sq ft | 94.6% | $116 |
| | Sep 9 2016 | $179,900 | 51 | 1,282 sq ft | 100.0% | $140 |
| | Aug 29 2016 | $178,000 | 88 | 2,454 sq ft | 100.0% | $73 |
| | Jun 8 2016 | $161,000 | 85 | 1,880 sq ft | 97.6% | $86 |
| | Jun 30 2015 | $146,500 | 69 | 1,404 sq ft | 97.7% | $104 |
| | Apr 15 2015 | $148,500 | 350 | 1,852 sq ft | 92.9% | $80 |
| | Dec 12 2014 | $191,500 | 213 | 1,790 sq ft | 97.4% | $107 |
| | Mar 21 2014 | $122,000 | 213 | 1,350 sq ft | 102.1% | $90 |
| | Nov 22 2013 | $129,900 | 162 | 1,294 sq ft | 100.0% | $100 |
| | May 1 2012 | $165,000 | 137 | 2,080 sq ft | 94.9% | $79 |
| | Feb 27 2012 | $135,000 | 152 | 1,887 sq ft | 90.6% | $72 |
| | Jan 26 2012 | $64,000 | 315 | 1,040 sq ft | 111.3% | $62 |
Closed sales from MLS history for Highland Park, Canton
Below trend-line threshold — city median shown for context
The Highland Park real estate market shows buyer's market conditions. Homes typically sell within 86 days. With 2 active listings and 3 homes sold in the past year, buyers have more negotiating power and time to decide.
Free account needed — create one to continue viewing homes.
Members see everything — free👋 Still browsing Highland Park?
Full photos, price history, and every active & pending home in Highland Park with a free account.
Palmetto Park Realty Team
 $298K
$298K $465K
$465KCheck your messages
We sent a code to .
Verify your number and we'll text you price drops and new Highland Park listings. 1–2 texts a month, stop anytime.
Enjoy full access to this home and every home on Palmetto Park.