Active
$429,000 $268/sqft
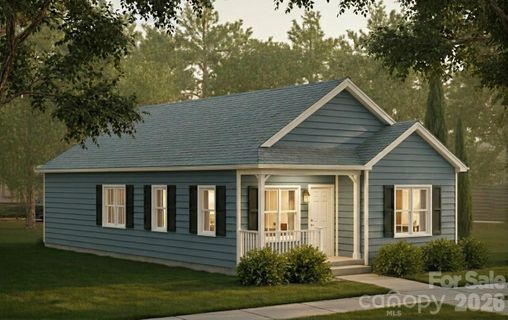
315 Mingus Street
Canton, NC 28716
3 bd · 2 ba · 1,602 sqft · 2026 · 28 d ago
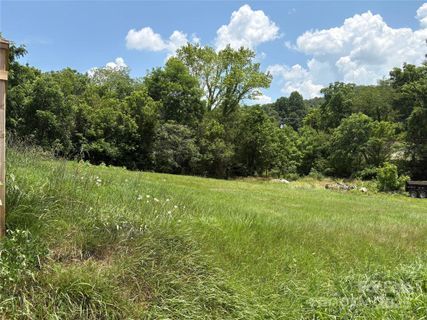
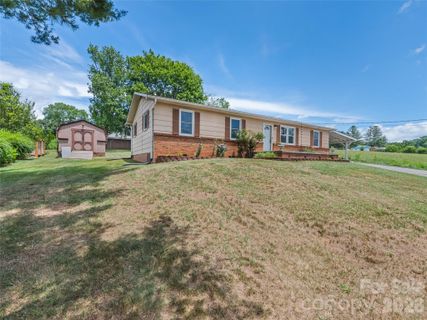
Greene Hills in Canton has the feel of a settled mountain neighborhood where older cottages, updated ranches, and newer construction sit along tree-lined streets with room to breathe.
Community overview based on MLS listing data for Greene Hills, Canton
Greene Hills in Canton has the feel of a settled mountain neighborhood where older cottages, updated ranches, and newer construction sit along tree-lined streets with room to breathe. Many homes here have been refreshed over time, but the community still keeps its character through porches, mature trees, and lots that feel comfortably sized rather than tightly packed.
"A mountain-leaning neighborhood with classic homes, practical updates, and easy access to town."
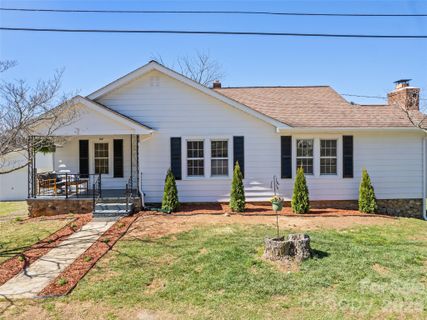
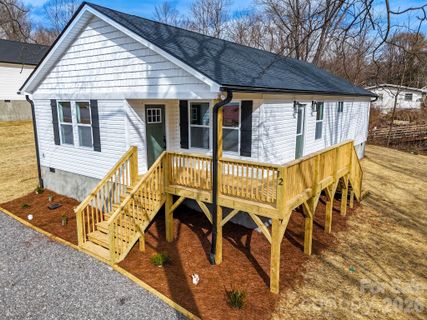
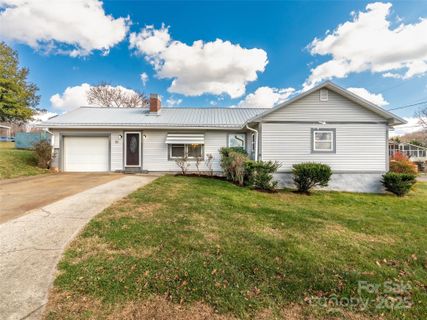
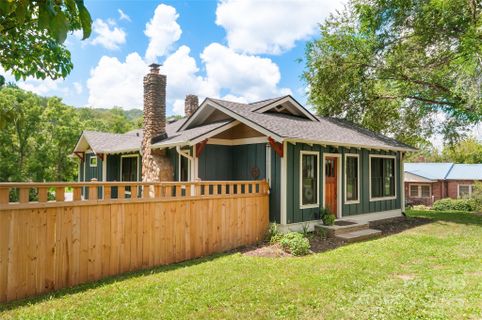
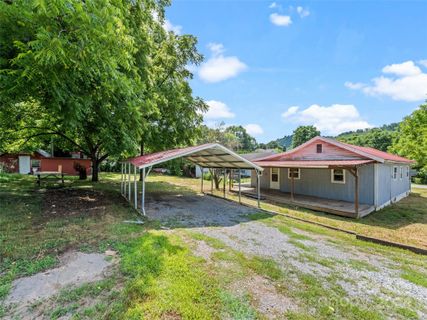
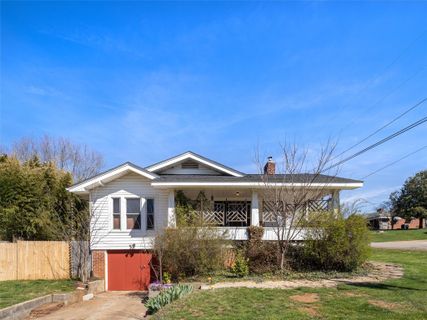
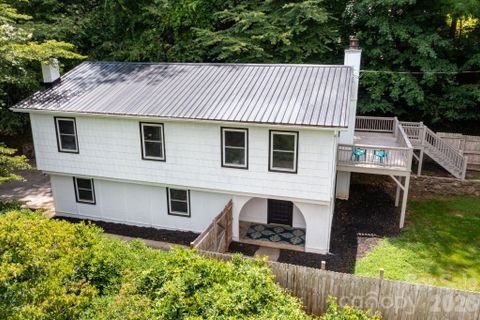
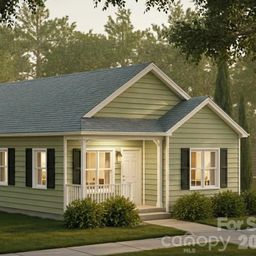
Single-family homes define Greene Hills, and the architectural range is part of the appeal. You’ll see homes dating from the 1930s through brand-new builds, with a mix of brick accents, hardwood floors, metal roofs, fireplaces, covered porches, and finished or unfinished basements. Garages are common, and several homes pair them with fenced yards, decks, or workshop space. The lot sizes tend to be generous for an in-town setting, giving the streets a more open, established feel. Recent listings also show a strong emphasis on renovations, with updated kitchens, new roofs, refreshed systems, and outdoor living spaces that make everyday use easy.
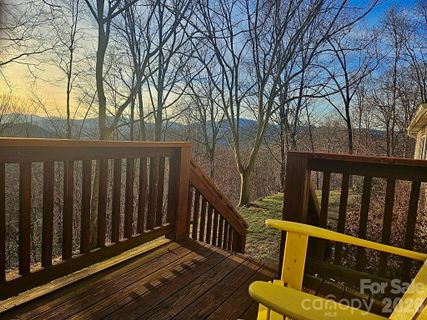
Daily life in Greene Hills is shaped by convenience and access. City water and sewer appear in multiple homes, and the neighborhood sits close to downtown Canton, where errands, coffee, and casual dining are within easy reach. Several remarks also point to quick access toward Asheville and Waynesville, which makes the area feel connected without losing its local pace. Outdoor space matters here: decks, patios, fenced backyards, garden areas, and mountain views show up often, so the neighborhood works well for anyone who values a little breathing room at home. The streets feel lived-in and practical, with a blend of move-in-ready homes and properties that still leave room for personalization.
"Close to downtown Canton, yet still grounded by mountain views and usable yard space."
Greene Hills sits in West Canton, near the downtown Canton area and along the Morgan Street, Painter Street, Harkins Avenue, Haywood Avenue, Mingus Street, and Circle Drive corridors. Public remarks place the community minutes from downtown Canton, with some homes noting a 20-minute drive to Asheville and Waynesville, and one listing calling out quick access to Interstate 40 for commuting toward Asheville. Nearby destinations mentioned in listings include Papertown Coffee, BearWaters Brewing, Lake Logan, the Rough Creek Watershed Trail System, Graveyard Fields, and Sunburst Falls, giving the area a strong mix of local and regional recreation. School assignments commonly point to North Canton Elementary, Canton Middle, and Pisgah High, with the schools forming a familiar western Haywood County pattern for the neighborhood.
Palmetto Park Realty Team · Canton
Ask about Greene Hills — we answer fast
See what it's worth — your home's own sale history plus recent Greene Hills sales, free.
What's my home worth?Communities similar to Greene Hills
20 recently sold in Greene Hills, Canton
| Property | Sold | Sold Price | Days on Market | Size | Sold to Ask | Sold $/SF |
|---|---|---|---|---|---|---|
| | Jul 16 2026 | $362,000 | 127 | 1,112 sq ft | 100.0% | $326 |
| | Apr 17 2026 | $300,000 | 99 | 1,413 sq ft | 93.0% | $212 |
| | Mar 26 2026 | $313,900 | 42 | 1,413 sq ft | 93.7% | $222 |
| | Feb 23 2026 | $292,000 | 84 | 1,397 sq ft | 97.3% | $209 |
| | Aug 27 2025 | $65,000 | 61 | — | 108.5% | — |
| | Aug 26 2025 | $390,000 | 23 | 1,341 sq ft | 100.0% | $291 |
| | Jul 7 2025 | $439,000 | 45 | 1,633 sq ft | 94.9% | $269 |
| | Apr 23 2025 | $300,000 | 291 | 1,367 sq ft | 98.4% | $219 |
| | Aug 27 2024 | $164,850 | 50 | 1,232 sq ft | 106.4% | $134 |
| | Apr 25 2023 | $275,000 | 39 | 1,072 sq ft | 110.0% | $257 |
| | Aug 1 2022 | $260,000 | 45 | 1,367 sq ft | 102.0% | $190 |
| | May 6 2022 | $397,500 | 32 | 2,241 sq ft | 104.6% | $177 |
| | Nov 18 2021 | $109,500 | 105 | 977 sq ft | 88.3% | $112 |
| | Jul 10 2020 | $150,000 | 152 | 1,280 sq ft | 96.8% | $117 |
| | Apr 30 2019 | $30,412 | 71 | 905 sq ft | 98.7% | $34 |
| | Jun 27 2016 | $128,000 | 63 | 1,027 sq ft | 108.9% | $125 |
| | Jun 13 2016 | $102,000 | 52 | 938 sq ft | 93.2% | $109 |
| | Oct 2 2015 | $217,000 | 827 | 2,754 sq ft | 81.9% | $79 |
| | Aug 2 2014 | $116,200 | 102 | 1,050 sq ft | 98.1% | $111 |
| | Apr 16 2014 | $88,000 | 169 | 1,072 sq ft | 98.9% | $82 |
Closed sales from MLS history for Greene Hills, Canton
Greene Hills median sale price is $306,950; Canton is up 3.1%.
Below trend-line threshold — city median shown for context
+1 outside price range.
The Greene Hills real estate market shows buyer's market conditions. Homes typically sell within 71 days. With 2 active listings and 7 homes sold in the past year, buyers have more negotiating power and time to decide.
Free account needed — create one to continue viewing homes.
Members see everything — free👋 Still browsing Greene Hills?
Full photos, price history, and every active & pending home in Greene Hills with a free account.
Palmetto Park Realty Team
 $429K
$429K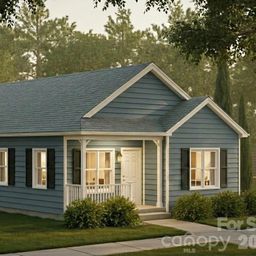 $429K
$429KCheck your messages
We sent a code to .
Verify your number and we'll text you price drops and new Greene Hills listings. 1–2 texts a month, stop anytime.
Enjoy full access to this home and every home on Palmetto Park.