Active
$749,900 $312/sqft
25 Houston Street
Asheville, NC 28801
4 bd · 3 ba · 2,400 sqft · 2005 · 2 mo ago
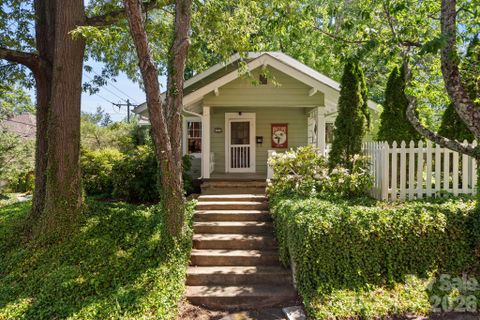
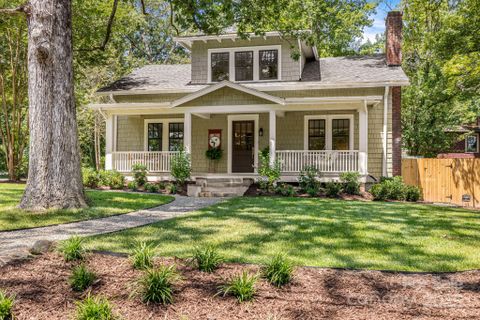
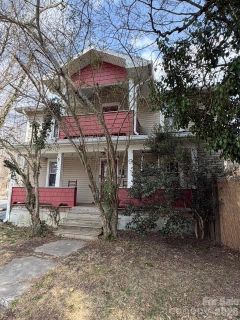
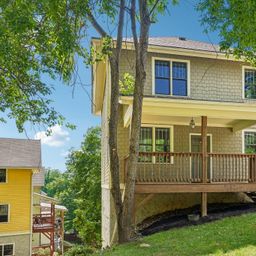
Historic Montford feels like Asheville at its most recognizable: tree-lined streets, classic porches, and a setting that sits close to the city’s cultural core without losing its residential charm.
Community overview based on MLS listing data for Historic Montford, Asheville
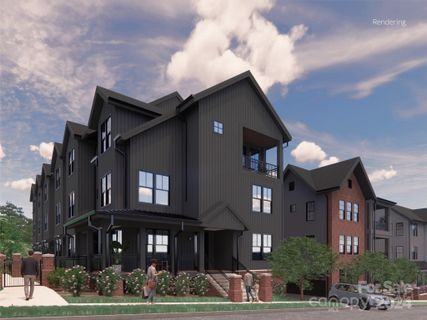
Historic Montford feels like Asheville at its most recognizable: tree-lined streets, classic porches, and a setting that sits close to the city’s cultural core without losing its residential charm. The neighborhood’s character is anchored by early 20th-century homes, but newer construction and thoughtful renovations sit comfortably beside the older fabric, giving the area a layered, lived-in appeal.
"A neighborhood where historic architecture and downtown convenience meet on the same walkable streets."
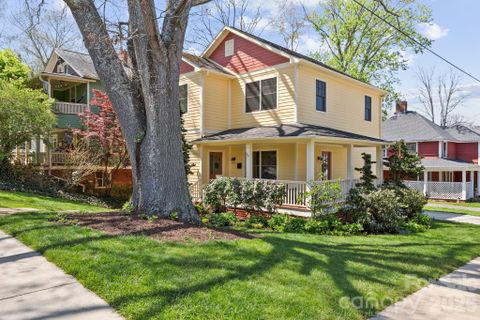
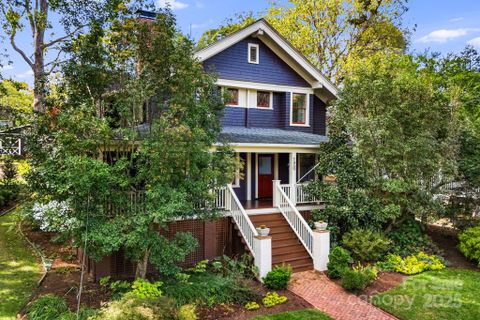
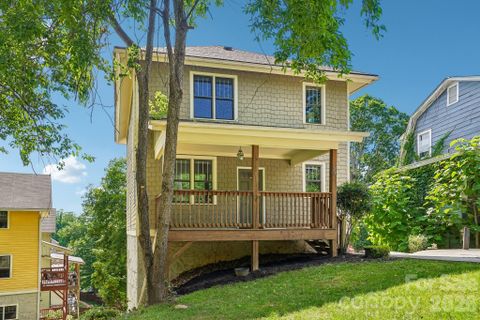
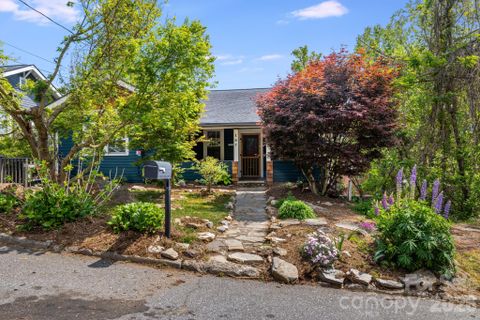
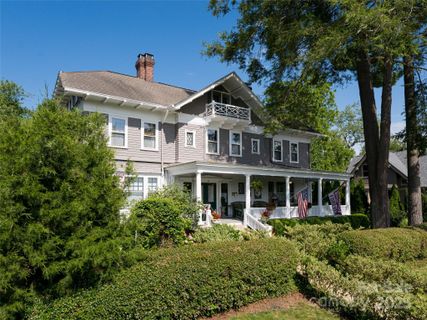
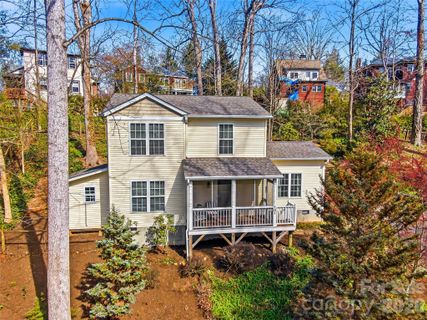
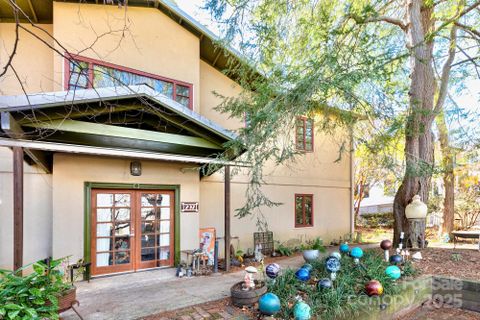
Single-family homes define the area, and the housing stock ranges from late-1890s originals to modern builds completed as recently as 2013. You’ll find Arts & Crafts, Craftsman, Victorian, American Traditional, and bungalow influences, often with wide front porches, original hardwoods, built-ins, fireplaces, and detailed trim. Many homes feature basement space, while garages are less common, which adds to the neighborhood’s older in-town feel. Lot sizes tend to be modest, with mature landscaping, private yards, and the kind of street presence that makes front porches and sidewalks part of daily life.
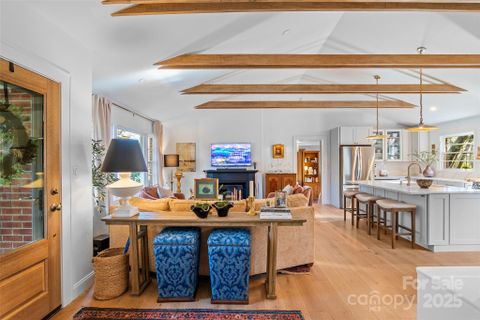
The overall mood is polished but unpretentious. Some homes have been fully renovated with chef’s kitchens, updated systems, and carriage houses or studio apartments, while others preserve historic details and invite a more hands-on approach. That mix gives Montford a distinctive rhythm: architectural character first, convenience close behind.
Montford’s daily appeal is all about easy movement. Reed Creek Greenway is a recurring touchpoint, offering a nearby path for walking and biking, and Montford Park adds green space, tennis courts, and a setting for community events. Local favorites such as High Five Coffee, All Day Darling, Nine Mile, and Little Jumbo help define the neighborhood’s routine, while nearby grocery options and downtown services keep errands simple. The streets themselves encourage strolling, and several homes note quick access to restaurants, parks, and the city center.
"Porches, greenway access, and neighborhood dining give Montford an unmistakably walkable Asheville feel."
Historic Montford sits just north of downtown Asheville, with remarks repeatedly pointing to a short walk or a few minutes’ drive into the city center. The neighborhood is also tied to the Reed Creek Greenway corridor, which links downtown Asheville with UNCA and the Botanical Gardens. Nearby destinations mentioned in listings include Trader Joe’s, Whole Foods, grocery stores, Montford Park, Riverside Cemetery, the Montford Community Center, and the Grove Park Inn area. School assignments are Asheville City for elementary, Asheville for middle, and Asheville for high school, placing the community within the city’s public school footprint while keeping everyday errands, recreation, and downtown access close at hand.
Palmetto Park Realty Team · Asheville
Ask about Historic Montford — we answer fast
See what it's worth — your home's own sale history plus recent Historic Montford sales, free.
What's my home worth?Communities similar to Historic Montford
 0.3 mi
 Arborvale Park, Asheville
3 active · $749,000
 0.1 mi
 Montford, Asheville
18 active · $611,750
 0.5 mi
 Five Points, Asheville
3 active · $699,000
 0.6 mi
 Montford Hills, Asheville
4 active · $559,750
 1.0 mi
 Chestnut Hill, Asheville
5 active · $995,000
 0.9 mi
 Hillside Park, Asheville
2 active · $644,950
27 recently sold in Historic Montford, Asheville
| Property | Sold | Sold Price | Days on Market | Size | Sold to Ask | Sold $/SF |
|---|---|---|---|---|---|---|
| | Jul 7 2026 | $740,000 | 40 | 1,848 sq ft | 92.5% | $400 |
| | Jun 16 2026 | $500,000 | 32 | 1,023 sq ft | 104.4% | $489 |
| | Jun 5 2026 | $1,750,000 | 56 | 3,213 sq ft | 97.5% | $545 |
| | May 6 2026 | $645,000 | 26 | 1,508 sq ft | 99.2% | $428 |
| | Mar 27 2026 | $719,000 | 126 | 1,582 sq ft | 98.6% | $454 |
| | Mar 23 2026 | $625,000 | 194 | 1,560 sq ft | 97.8% | $401 |
| | Mar 17 2026 | $1,830,000 | 152 | 3,319 sq ft | 96.3% | $551 |
| | Aug 22 2025 | $1,300,000 | 36 | 2,041 sq ft | 100.1% | $637 |
| | Dec 10 2024 | $735,000 | 40 | 2,701 sq ft | 101.5% | $272 |
| | May 6 2024 | $2,550,000 | 31 | 3,253 sq ft | 109.7% | $784 |
| | Feb 6 2024 | $605,000 | 103 | 1,592 sq ft | 93.1% | $380 |
| | Jun 1 2023 | $380,000 | 40 | 1,160 sq ft | 95.4% | $328 |
| | Dec 6 2021 | $425,000 | 25 | 1,344 sq ft | 106.3% | $316 |
| | Nov 23 2021 | $550,000 | 32 | 1,400 sq ft | 100.2% | $393 |
| | Oct 14 2021 | $850,000 | 105 | 2,413 sq ft | 102.5% | $352 |
| | Oct 13 2021 | $590,000 | 20 | 902 sq ft | 100.0% | $654 |
| | Apr 5 2021 | $249,000 | 74 | 1,541 sq ft | 100.0% | $162 |
| | Jan 21 2021 | $480,000 | 55 | 1,596 sq ft | 99.0% | $301 |
| | Dec 22 2020 | $200,000 | 62 | 1,541 sq ft | 88.9% | $130 |
| | Sep 17 2020 | $1,025,000 | 151 | 2,588 sq ft | 102.7% | $396 |
| | Aug 4 2020 | $382,500 | 25 | 1,132 sq ft | 98.3% | $338 |
| | Jul 23 2020 | $743,750 | 112 | 2,312 sq ft | 96.0% | $322 |
| | Jul 20 2020 | $480,000 | 33 | 1,360 sq ft | 101.1% | $353 |
| | Jun 15 2020 | $299,900 | 105 | 1,407 sq ft | 92.3% | $213 |
| | Jun 5 2020 | $523,909 | 35 | 1,565 sq ft | 95.4% | $335 |
| | Jun 3 2020 | $311,800 | 110 | 1,535 sq ft | 96.3% | $203 |
| | Feb 7 2020 | $625,000 | 52 | 3,032 sq ft | 100.0% | $206 |
Closed sales from MLS history for Historic Montford, Asheville
Historic Montford median sale price is $719,000; Asheville is down 4.8%.
+1 outside price range.
The Historic Montford real estate market shows balanced market conditions. Homes typically sell within 52 days. With 1 active listing and 8 homes sold in the past year, a healthy balance exists between buyers and sellers.
Listings taken off the market in the past year in Historic Montford, Asheville
These homes are no longer available, but they show recent pricing and listing activity in Historic Montford. Our agents can help you watch for new listings in this area.
Contact an agentFree account needed — create one to continue viewing homes.
Members see everything — free👋 Still browsing Historic Montford?
Full photos, price history, and every active & pending home in Historic Montford with a free account.
Palmetto Park Realty Team
 $750K
$750KCheck your messages
We sent a code to .
Verify your number and we'll text you price drops and new Historic Montford listings. 1–2 texts a month, stop anytime.
Enjoy full access to this home and every home on Palmetto Park.