Active
$275,900 $138/sqft
415 Poole Street
Woodruff, SC 29388-1532
3 bd · 2 ba · 2,006 sqft · 2022 · 2 mo ago
Abney Mills has the feel of a small, established Woodruff pocket where older homes, modest lots, and thoughtful renovations sit close to the center of town.
Community overview based on MLS listing data for Abney Mills, Woodruff
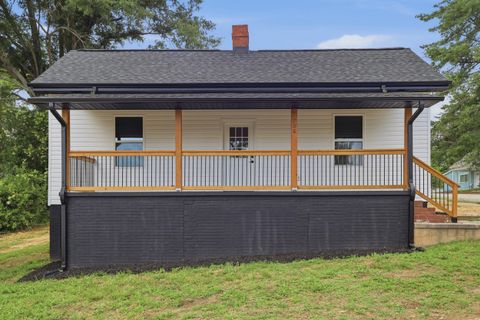
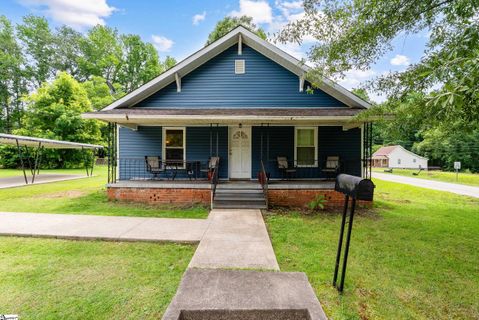
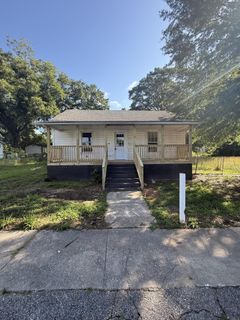
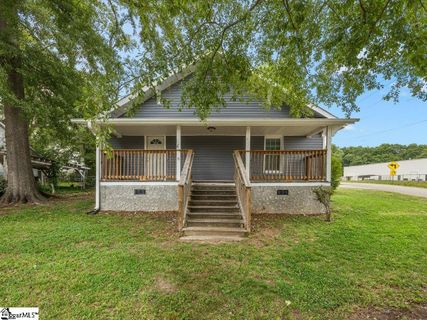
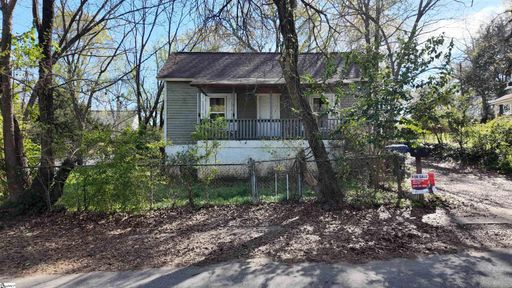
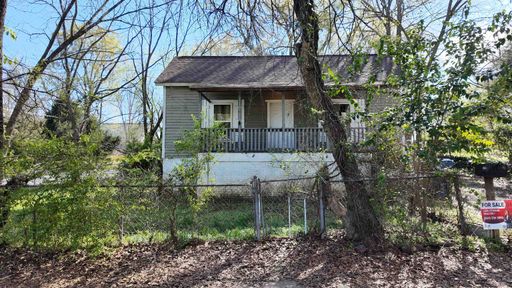
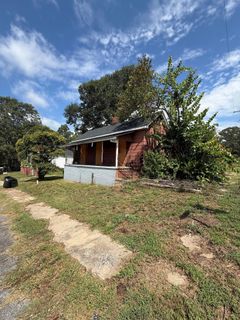
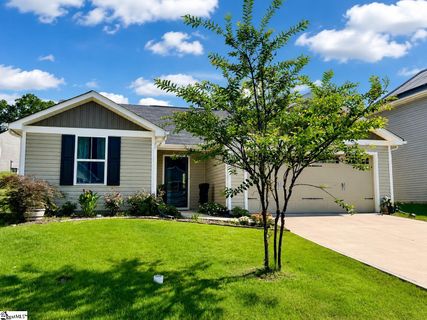
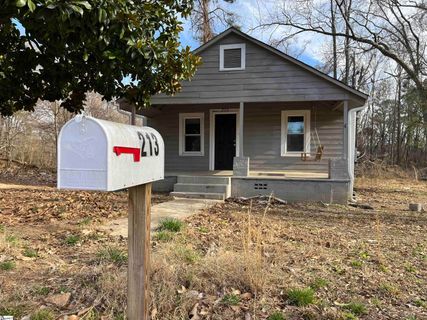
Abney Mills has the feel of a small, established Woodruff pocket where older homes, modest lots, and thoughtful renovations sit close to the center of town. The neighborhood’s identity is rooted in its mill-era housing stock, and that shows up in the mix of compact bungalows, classic single-family homes, and rebuilt properties that keep the original street pattern intact. Many homes sit on level lots with mature trees, front porches, and fenced backyards, giving the area a grounded, lived-in character. A creek appears behind some homes, adding a natural edge that softens the setting and gives a few properties extra visual appeal.
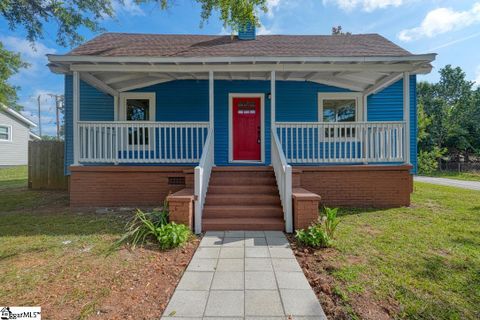
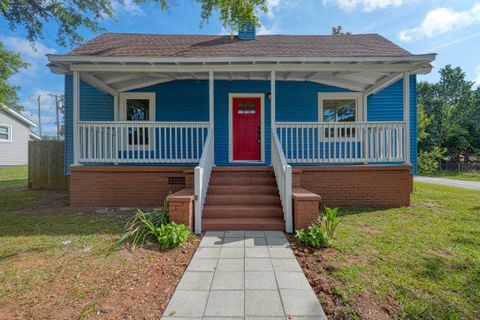
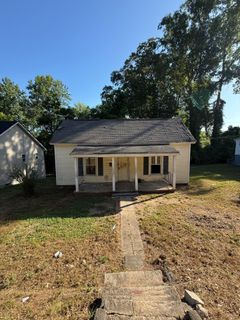
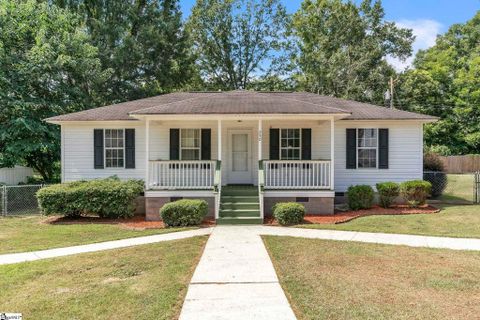
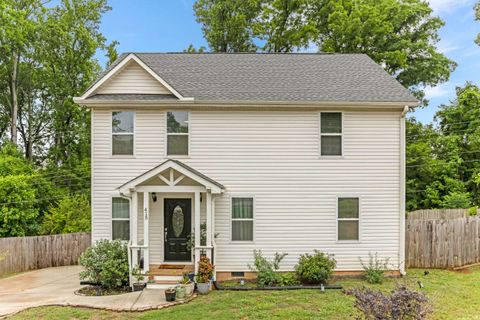
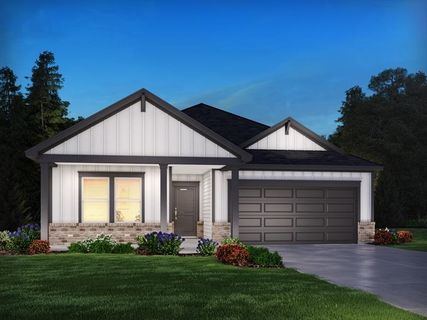
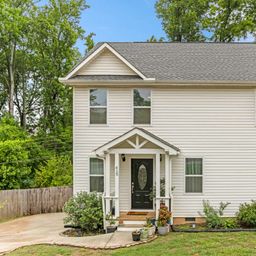
The housing here is overwhelmingly single-family, with the oldest homes dating back to the early 1900s and the newest improvements reaching into 2022. That blend creates a streetscape where original charm and modern updates meet in a very practical way. Renovated mill houses and bungalows are common, often featuring large front porches, updated flooring, new windows, fresh paint, and kitchens finished with granite or butcher-block countertops. Some homes preserve historic details like hardwood floors, high ceilings, and built-in shelving, while others lean fully into a clean, move-in-ready style with new HVAC, roofing, plumbing, and electrical systems.
Lot sizes are generally manageable, and the neighborhood’s small-scale footprint keeps the setting approachable. Brick appears on some homes, but it is not the defining exterior style; instead, the visual story is one of varied older construction refreshed over time. Detached garages and carports show up occasionally, though most properties are simpler in form and function.
Daily life in Abney Mills is tied closely to downtown Woodruff. Several listings describe being steps from or within walking distance of the heart of town, which means quick access to local shops, dining, and everyday errands. One listing notes grocery stores, pharmacies, fast food, and shops all under a five-minute trip, while others point to the area’s growing selection of restaurants and entertainment. The neighborhood also sits near Woodruff’s industrial and manufacturing expansion, including nearby plants and the Michelin warehouse on Hwy 101, which has helped shape the area’s recent momentum.
Outdoor space is a recurring strength. Front porches are a signature feature, and fenced yards, back decks, and larger lots create room for gardening, grilling, or simply enjoying the setting. A few homes offer enough land for future additions or even additional structures.
Abney Mills is in the Woodruff city limits, close to downtown Woodruff and positioned for straightforward regional travel. Listings specifically mention easy access to I-385, I-26, and I-85, plus proximity to the Michelin warehouse on Hwy 101 and the new BMW battery plant, about 3 miles away. AIRSYS Cooling Technologies is also noted at 11 miles away. The community is served by Woodruff Elementary, Woodruff Middle, and Woodruff High, with the new Woodruff High School under construction and a 40-acre sports and recreation complex planned with baseball and soccer fields. That combination of small-town downtown access, regional highway reach, and local school investment gives Abney Mills a clear sense of place within the Upstate.
Palmetto Park Realty Team · Woodruff
Ask about Abney Mills — we answer fast
Communities similar to Abney Mills
 0.8 mi
 Pearson Park, Woodruff
2 active · $245,250
 0.7 mi
 Ellington, Woodruff
4 active · $234,699
 1.0 mi
 Cavins Farm, Woodruff
5 active · $238,000
 1.2 mi
 Waverly Springs, Woodruff
6 active · $264,945
 1.3 mi
 Pine Ridge, Woodruff
2 active · $106,000
 1.7 mi
 Vickery Station, Woodruff
15 active · $264,900
Showing 1-48+ recently sold in Abney Mills, Woodruff
| Property | Sold | List Price | DOM | Size | List $/SF |
|---|---|---|---|---|---|
| | Apr 28 2026 | $85,000 | 38 | 816 sq ft | $104 |
| | Apr 28 2026 | $85,000 | 40 | 816 sq ft | $104 |
| | Apr 1 2026 | $170,000 | 253 | 1,178 sq ft | $144 |
| | Apr 1 2026 | $170,000 | 254 | 1,063 sq ft | $160 |
| | Jan 7 2026 | $38,500 | 43 | 875 sq ft | $44 |
| | Dec 23 2025 | $54,900 | 39 | 816 sq ft | $67 |
| | Oct 6 2025 | $240,000 | 62 | 1,250 sq ft | $192 |
| | Sep 5 2025 | $204,000 | 151 | 1,229 sq ft | $166 |
| | Aug 15 2025 | $175,000 | 118 | 1,144 sq ft | $153 |
| | Jul 28 2025 | $169,000 | 65 | 910 sq ft | $186 |
| | Jul 7 2025 | $45,000 | 40 | 1,210 sq ft | $37 |
| | Jun 13 2025 | $39,900 | 24 | — | — |
| | May 21 2025 | $110,000 | 52 | 1,063 sq ft | $103 |
| | Apr 1 2025 | $229,500 | 382 | 2,157 sq ft | $106 |
| | Mar 20 2025 | $140,000 | 56 | 921 sq ft | $152 |
| | Mar 20 2025 | $140,000 | 58 | 951 sq ft | $147 |
| | Feb 21 2025 | $165,000 | 65 | 1,670 sq ft | $99 |
| | Feb 21 2025 | $165,000 | 67 | 1,637 sq ft | $101 |
| | Feb 14 2025 | $129,500 | 517 | 1,117 sq ft | $116 |
| | Dec 18 2024 | $185,000 | 138 | 1,270 sq ft | $146 |
| | Dec 6 2024 | $99,000 | 89 | 956 sq ft | $104 |
| | Nov 1 2024 | $192,900 | 65 | 1,168 sq ft | $165 |
| | Sep 20 2024 | $309,000 | 83 | 2,913 sq ft | $106 |
| | Aug 21 2024 | $48,000 | 11 | — | — |
| | May 24 2024 | $139,900 | 143 | 1,116 sq ft | $125 |
| | Apr 30 2024 | $159,900 | 332 | 1,042 sq ft | $153 |
| | Feb 23 2024 | $159,000 | 211 | 1,420 sq ft | $112 |
| | Feb 23 2024 | $25,000 | 21 | — | — |
| | Jan 9 2024 | $213,495 | 63 | 1,100 sq ft | $194 |
| | Sep 8 2023 | $184,900 | 29 | 1,172 sq ft | $158 |
| | Sep 8 2023 | $184,900 | 30 | 1,177 sq ft | $157 |
| | Aug 7 2023 | $185,000 | 60 | 1,070 sq ft | $173 |
| | Jul 31 2023 | $169,000 | 261 | 1,107 sq ft | $153 |
| | Jul 17 2023 | $92,500 | 26 | 850 sq ft | $109 |
| | Apr 20 2023 | $55,000 | 15 | 959 sq ft | $57 |
| | Jan 31 2023 | $55,000 | 17 | 1,280 sq ft | $43 |
| | Jan 31 2023 | $55,000 | 16 | 1,280 sq ft | $43 |
| | Dec 8 2022 | $180,000 | 33 | 1,024 sq ft | $176 |
| | Oct 11 2022 | $285,000 | 69 | 2,461 sq ft | $116 |
| | Sep 22 2022 | $117,500 | 43 | 1,115 sq ft | $105 |
| | Sep 16 2022 | $169,000 | 77 | 1,127 sq ft | $150 |
| | Jun 3 2022 | $110,000 | 21 | 1,202 sq ft | $92 |
| | Jun 3 2022 | $110,000 | 21 | 1,202 sq ft | $92 |
| | Apr 27 2022 | $18,000 | 15 | — | — |
| | Apr 18 2022 | $159,900 | 56 | 1,439 sq ft | $111 |
| | Mar 22 2022 | $150,000 | 43 | 1,042 sq ft | $144 |
| | Dec 21 2021 | $125,000 | 34 | 1,300 sq ft | $96 |
| | Dec 10 2021 | $110,000 | 83 | 959 sq ft | $115 |
Aggregated from MLS listing history for Abney Mills, Woodruff
The Abney Mills real estate market shows buyer's market conditions. Homes typically sell within 67 days. With 5 active listings and 10 homes sold in the past year, buyers have more negotiating power and time to decide.
Listings taken off the market in the past year in Abney Mills, Woodruff
Woodruff, SC 29388
2 bd · 1 ba · 1,116 sqft
Woodruff, SC 29388
2 bd · 1 ba · 938 sqft
Woodruff, SC 29388
2 bd · 2 ba · 1,029 sqft
Woodruff, SC 29388
3 bd · 2 ba · 1,230 sqft
These homes are no longer available, but they show recent pricing and listing activity in Abney Mills. Our agents can help you watch for new listings in this area.
Contact an agentFree account needed — create one to continue viewing homes.
Members see everything — free👋 Still browsing Abney Mills?
Full photos, price history, and every active & pending home in Abney Mills with a free account.
Palmetto Park Realty Team
 $276K
$276K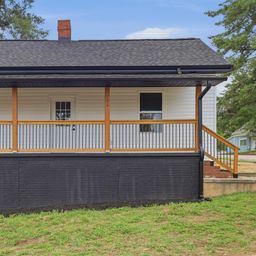 $220K
$220K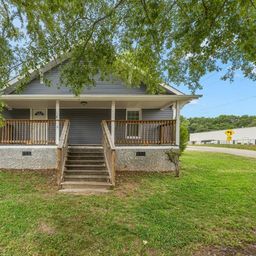 $190K
$190K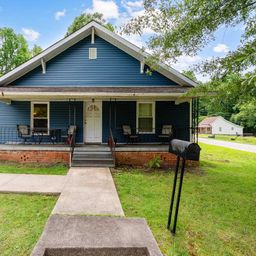 $149K
$149K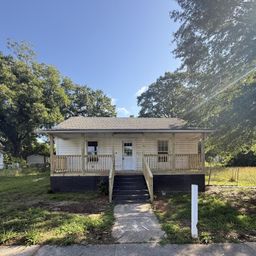 $70K
$70KCheck your messages
We sent a code to .
Verify your number and we'll text you price drops and new Abney Mills listings. 1–2 texts a month, stop anytime.
3 homes in Abney Mills went pending recently — alerts keep you first in line.
Enjoy full access to this home and every home on Palmetto Park.