Active
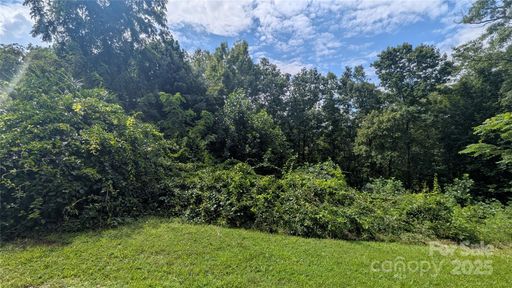
Homesite
$70,000
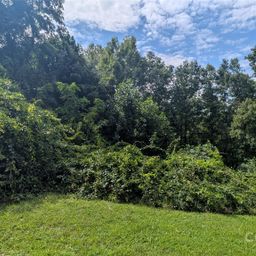
00 Pinewood Drive
Waynesville, NC 28786
2.2 ac · 11 mo ago
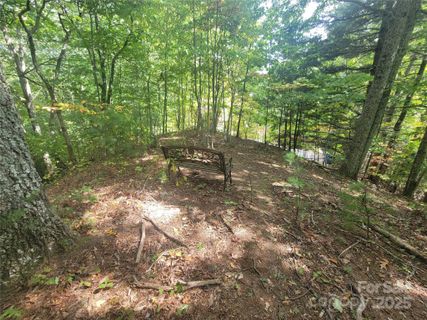
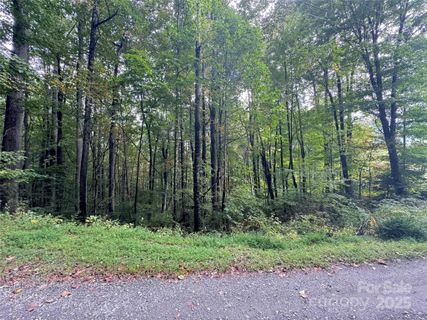
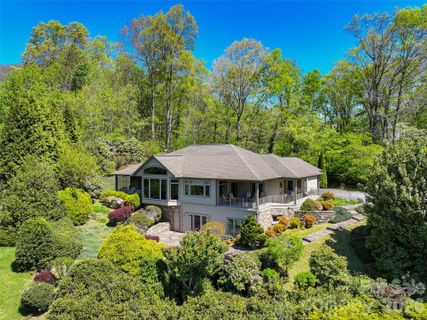
Pine Wood Heights has the feel of an in-town Waynesville hillside enclave where wooded lots, mountain views, and practical access come together.
Community overview based on MLS listing data for Pine Wood Heights, Waynesville
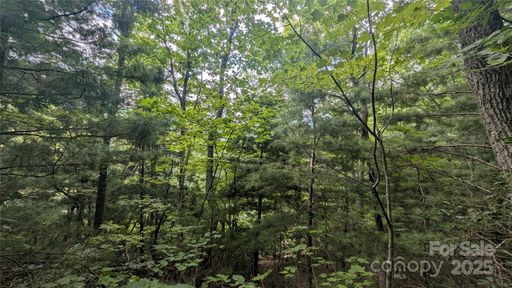
Pine Wood Heights has the feel of an in-town Waynesville hillside enclave where wooded lots, mountain views, and practical access come together. The neighborhood’s setting leans residential and relaxed, with a mix of established homes and newer builds tucked along Pinewood Drive and nearby streets. Several properties sit on generous lots, and the landscape gives many homes a sense of breathing room that is increasingly hard to find close to town.
"A hillside Waynesville address with mountain views and everyday convenience close at hand."
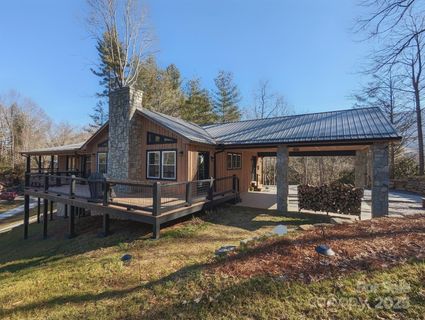
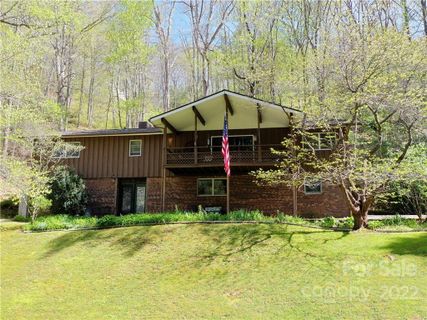
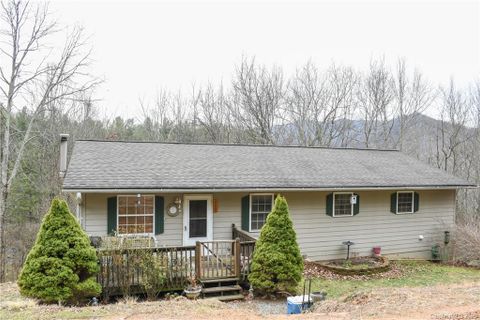
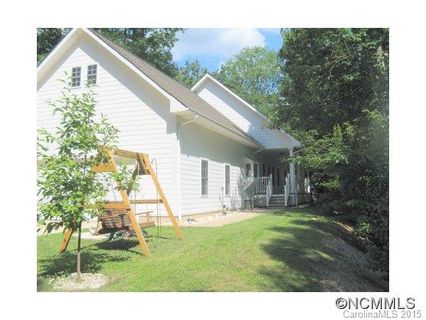
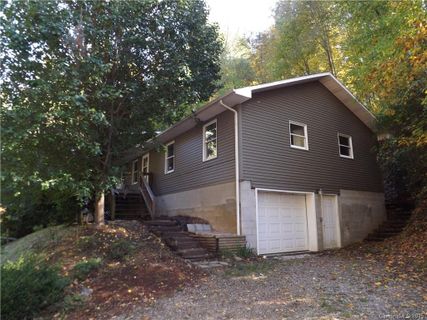
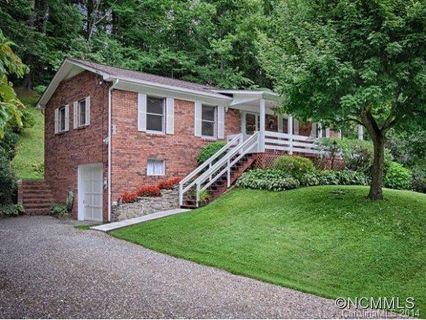
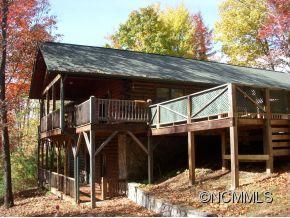
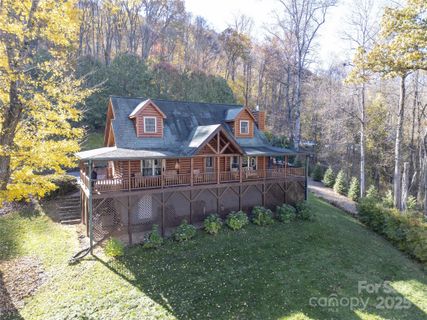
The housing here is primarily single-family, with a range that stretches from older ranch-style homes to newer custom construction. Homes built from the 1970s through 2022 show that Pine Wood Heights has evolved over time rather than arriving all at once. That gives the area a lived-in character, where updated kitchens, wraparound decks, fireplaces, and finished or unfinished basement spaces appear alongside simpler one-level layouts.
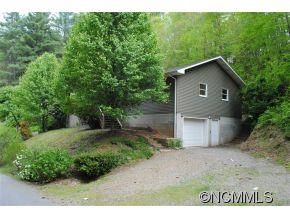
Many homes feature brick exteriors, while others lean into log, ranch, or custom mountain-home styling. Covered porches, decks, and large windows are common touches, and the lot sizes tend to support a more spacious feel than the average in-town subdivision. You’ll also see practical details like carports, garages, and main-level parking, which fit the terrain and the way people use homes in the mountains.
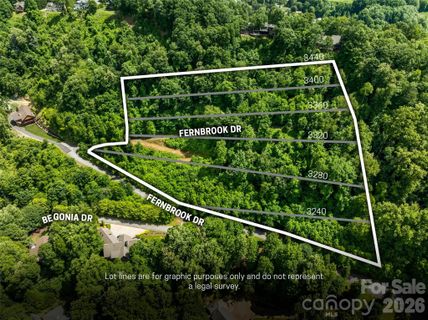
Daily life in Pine Wood Heights is shaped less by formal amenities and more by access, views, and usable property. City water is available on some lots, and the neighborhood’s proximity to downtown Waynesville makes it easy to move between home and town without much fuss. The setting works well for buyers who want room to build, room to spread out, or a home with outdoor spaces that make the most of the mountain backdrop.
"Close to town, but with enough elevation and open land to keep the setting distinctly mountain-oriented."
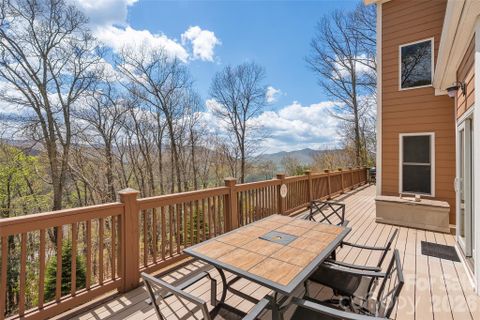
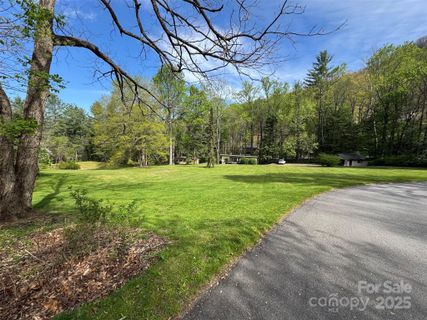
Outdoor living shows up again and again here: front porches, rear decks, wraparound decks, firepit areas, and long-range views all help define the rhythm of the community. The area does not read as amenity-heavy in the clubhouse sense; instead, it offers a more residential, property-centered lifestyle with access to the conveniences of Waynesville just beyond the neighborhood.
Pine Wood Heights sits in Waynesville, in the Haywood County area of western North Carolina, with a location that places downtown Waynesville within easy reach. One listing places the neighborhood approximately 3.6 miles from Downtown Waynesville, while others describe it as just minutes away. Remarks also point to quick access to shopping, dining, schools, and Haywood County amenities. Nearby destinations mentioned in the listings include I-40, Walmart, and the Blue Ridge Parkway, along with the broader downtown Waynesville shopping and dining area.
School assignments commonly associated with the neighborhood are Hazelwood Elementary, Waynesville Middle, and Tuscola High School. That makes the community easy to understand for local buyers: a mountain setting with town convenience, familiar school zoning, and straightforward access to the main routes and services that shape daily life in Waynesville.
Palmetto Park Realty Team · Waynesville
Ask about Pine Wood Heights — we answer fast
Communities similar to Pine Wood Heights
 1.5 mi
 Crestview Pointe, Waynesville
6 active · $50,000
 4.7 mi
 Balsam Forest, Waynesville
3 active · $47,000
 0.8 mi
 Sanctuary Cove, Waynesville
3 active · $145,000
 1.1 mi
 Pinnacle Ridge, Waynesville
3 active · $585,000
 0.9 mi
 Chestnut Walk, Waynesville
5 active · $149,000
 2.6 mi
 Laurel Ridge, Waynesville
2 active · $1,075,000
8 recently sold in Pine Wood Heights, Waynesville
| Property | Sold | List Price | DOM | Size | List $/SF |
|---|---|---|---|---|---|
| | Jun 26 2026 | $699,000 | 515 | 1,950 sq ft | $358 |
| | Jun 16 2022 | $349,000 | 45 | 2,358 sq ft | $148 |
| | Dec 22 2020 | $199,000 | 305 | 1,400 sq ft | $142 |
| | Dec 13 2017 | $249,000 | 1413 | 1,900 sq ft | $131 |
| | Mar 24 2016 | $145,000 | 162 | 1,232 sq ft | $118 |
| | Oct 22 2014 | $150,000 | 77 | 1,400 sq ft | $107 |
| | Mar 13 2014 | $239,000 | 120 | 2,240 sq ft | $107 |
| | Jun 25 2013 | $124,900 | 46 | 1,232 sq ft | $101 |
Aggregated from MLS listing history for Pine Wood Heights, Waynesville
The Pine Wood Heights real estate market shows buyer's market conditions. Homes typically sell within 120 days. With 3 active listings and 1 home sold in the past year, buyers have more negotiating power and time to decide.
Free account needed — create one to continue viewing homes.
Members see everything — free👋 Still browsing Pine Wood Heights?
Full photos, price history, and every active & pending home in Pine Wood Heights with a free account.
Palmetto Park Realty Team
 $70K
$70K $55K
$55K $25K
$25KCheck your messages
We sent a code to .
Verify your number and we'll text you price drops and new Pine Wood Heights listings. 1–2 texts a month, stop anytime.
Enjoy full access to this home and every home on Palmetto Park.