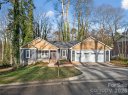
Rolling Hills Homes for Sale
No homes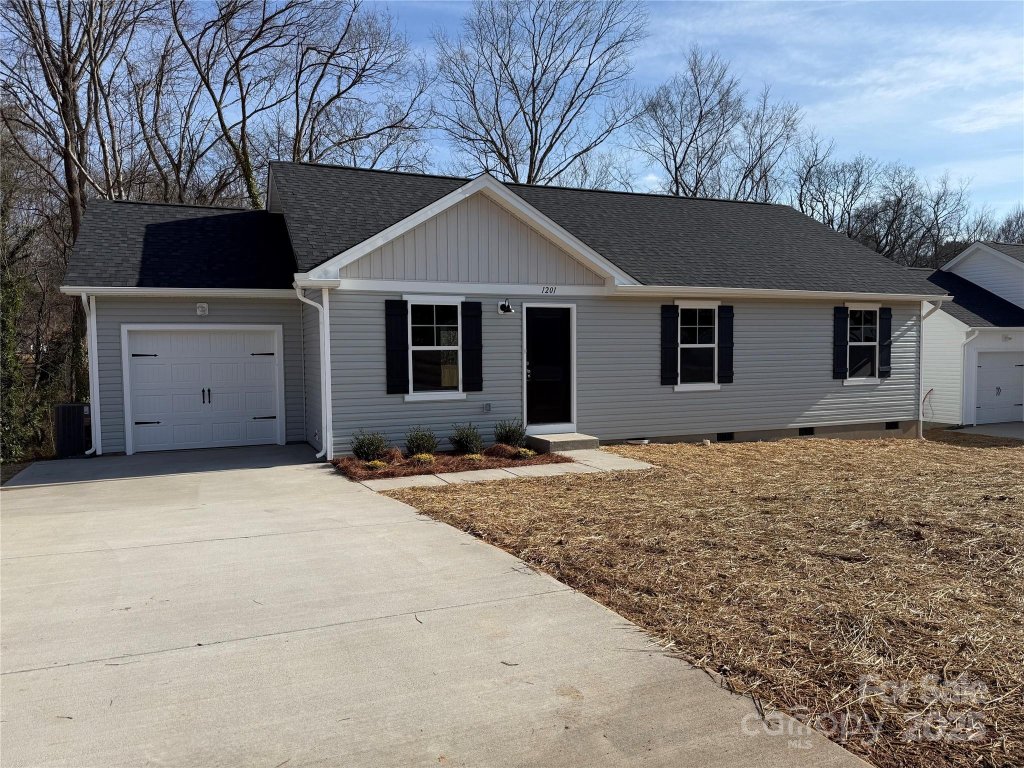


Market Trends
Buyers have more negotiating power. Properties may take longer to sell. Prices have increased 43%.
Year-over-Year Comparison
Last 12 months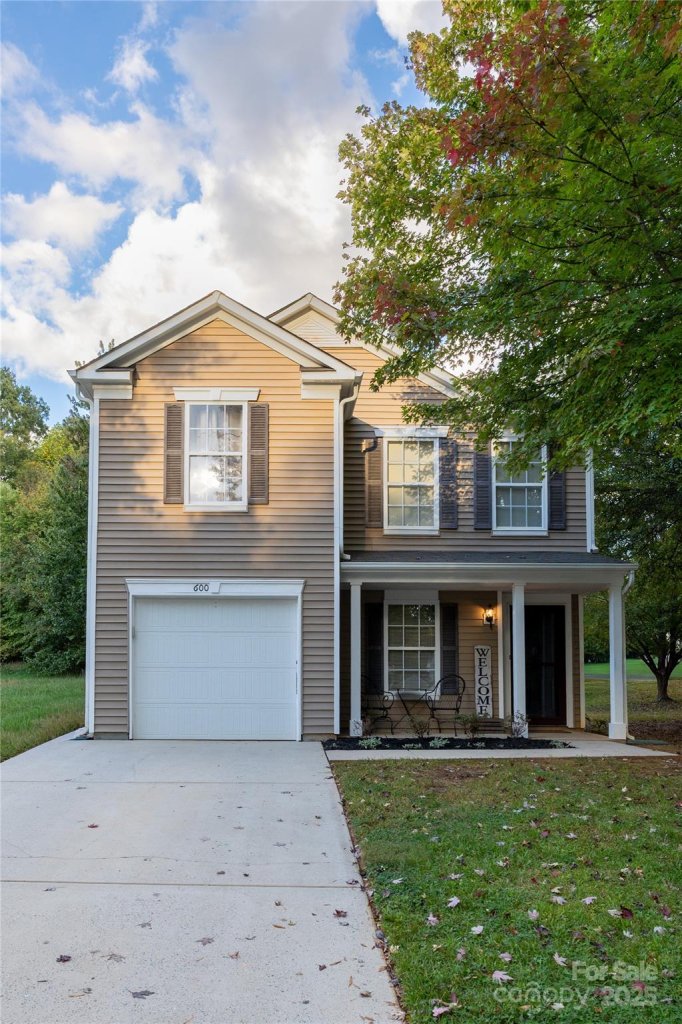
Recently Sold Properties
| Property | Sold Date▼ | Sale Price↕ | DOM↕ | LP/SP↕ | Size↕ | $/SF↕ |
|---|---|---|---|---|---|---|
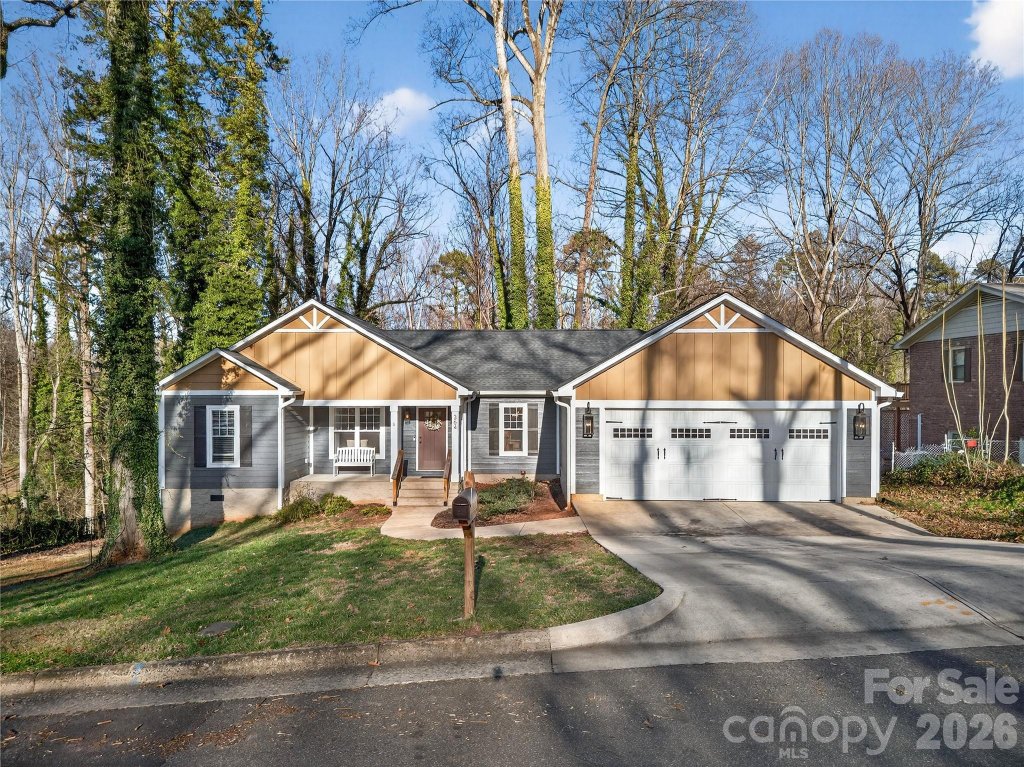
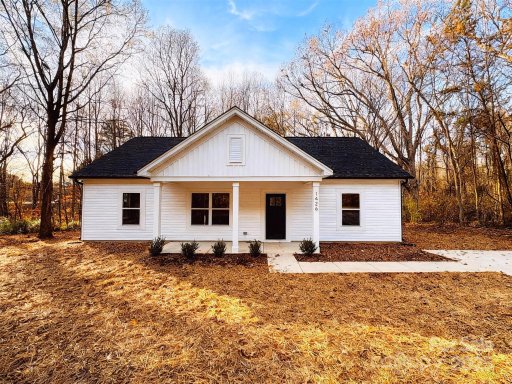
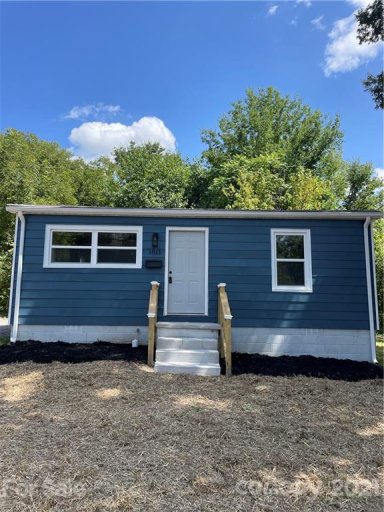
 SOLD 1201 Suncrest Avenue 3 bed2 bath | Apr 24 2026 | $250,000 | 105 | 95% | 1210 sq ft | $207 |
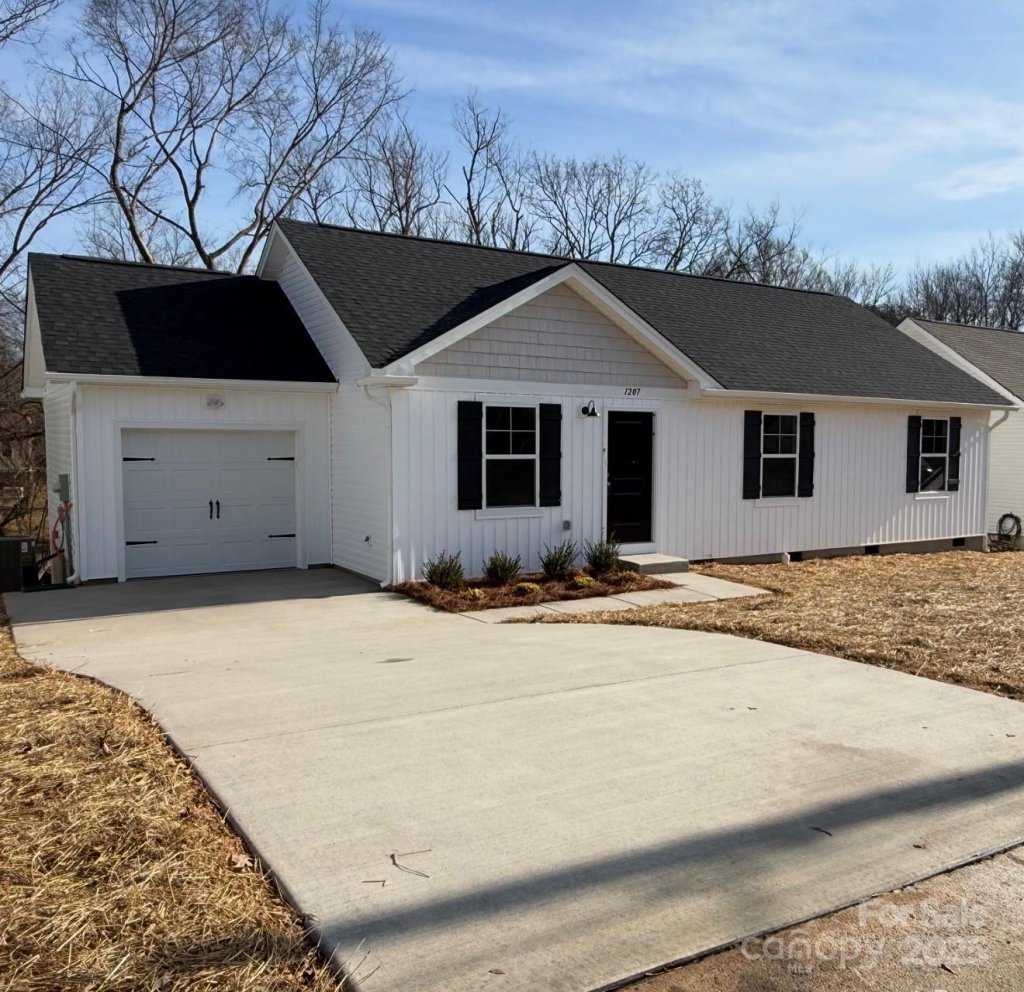
 SOLD 1207 Suncrest Avenue 3 bed2 bath | Apr 24 2026 | $250,000 | 105 | 95% | 1210 sq ft | $207 |
2 month gap in market activity | ||||||
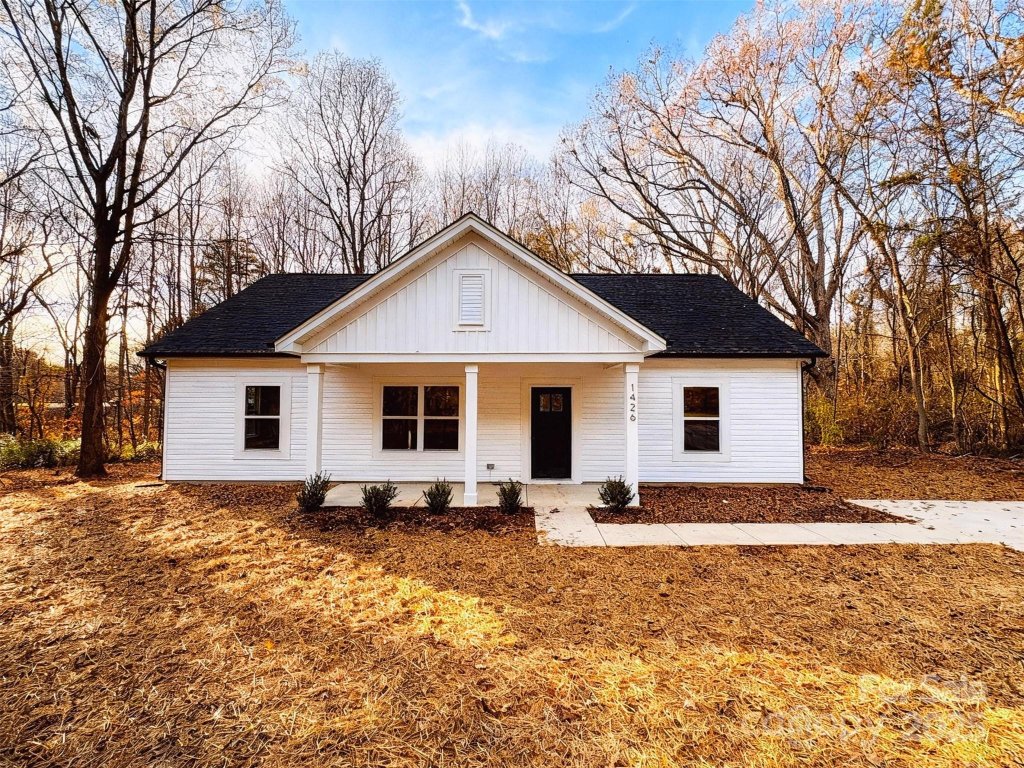
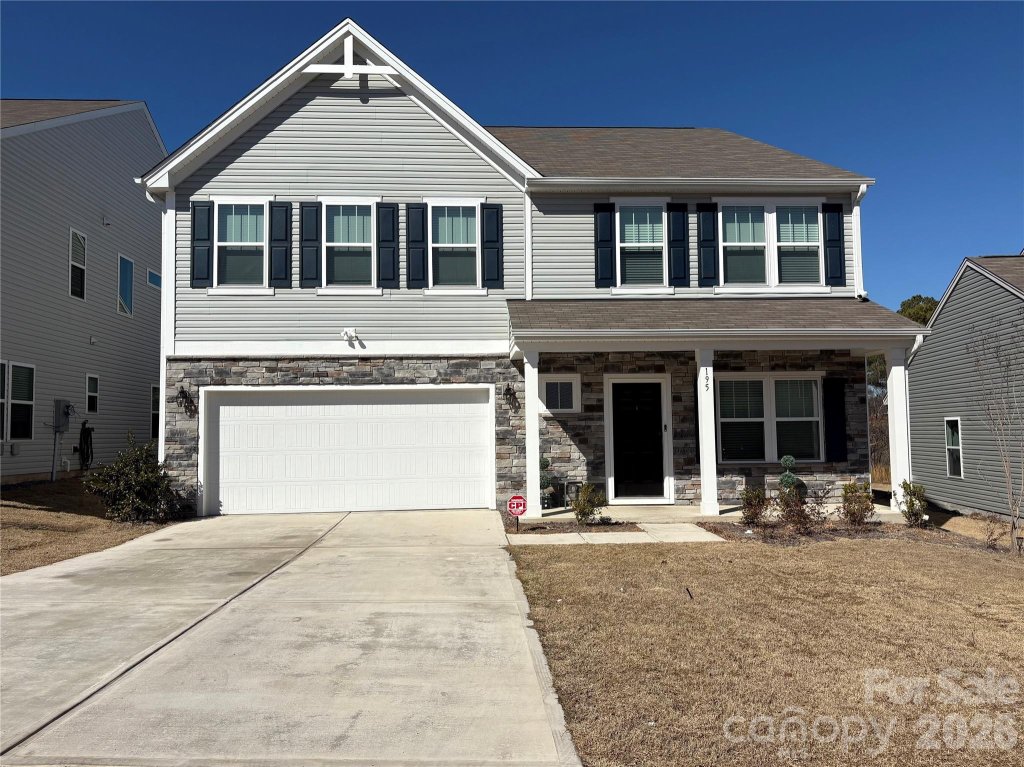
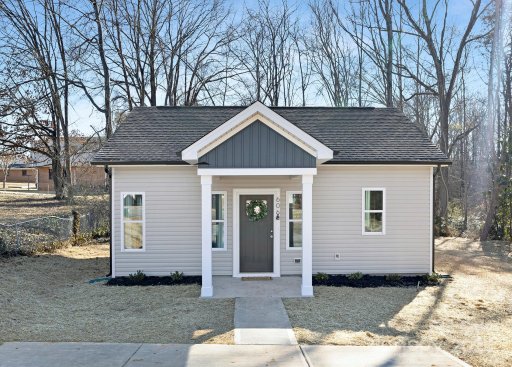
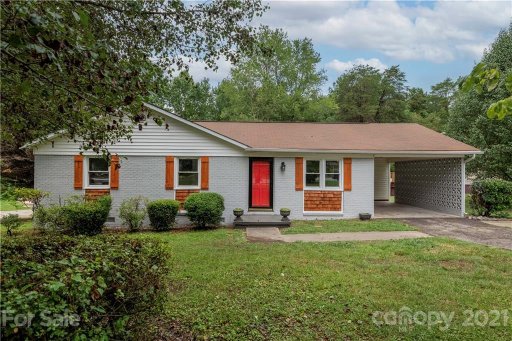
 SOLD 1426 Harris Street 3 bed2 bath | Feb 19 2026 | $265,000 | 69 | 🎯100% | 1311 sq ft | $202 |
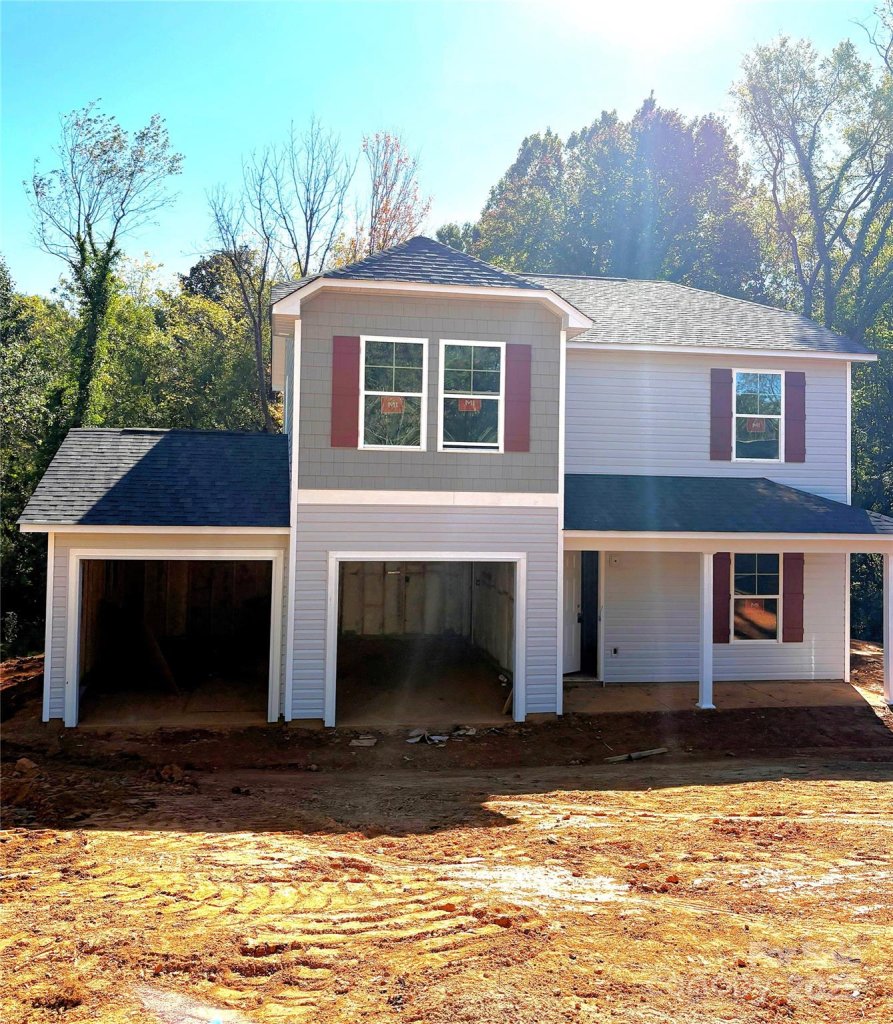
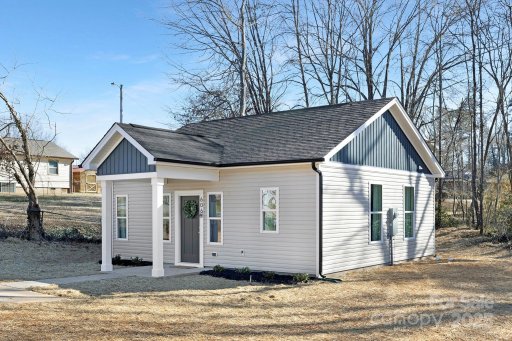
 SOLD 1005 Suncrest Avenue 4 bed2 bath | Jan 6 2026 | $260,650 | 56 | 98% | 1710 sq ft | $152 |
5 month gap in market activity | ||||||
 SOLD 1444 Harris Street 4 bed2 bath | Jul 31 2025 | $175,000 | 97 | 81% | 2234 sq ft | $78 |
4 month gap in market activity | ||||||
 SOLD 602 York Avenue 2 bed1 bath | Mar 10 2025 | $178,000 | 45 | 99% | 726 sq ft | $245 |
 SOLD 606 York Avenue 2 bed1 bath | Feb 25 2025 | $185,000 | 22 | 🎯103% | 726 sq ft | $255 |
6 month gap in market activity | ||||||
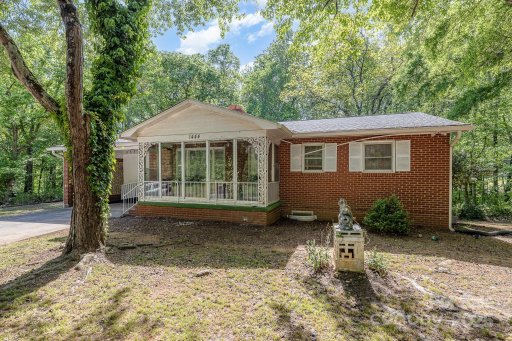
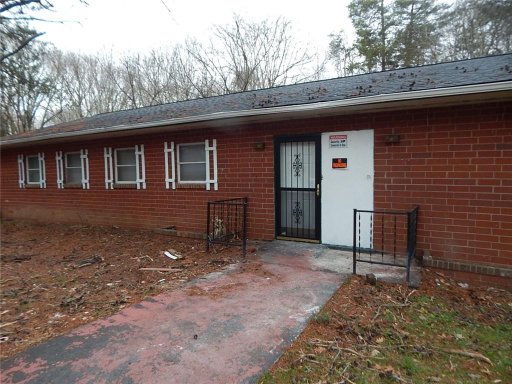
 SOLD 318 Charles Street 5 bed2 bath | Aug 6 2024 | $220,000 | 368 | 94% | 1824 sq ft | $121 |
3 month gap in market activity | ||||||
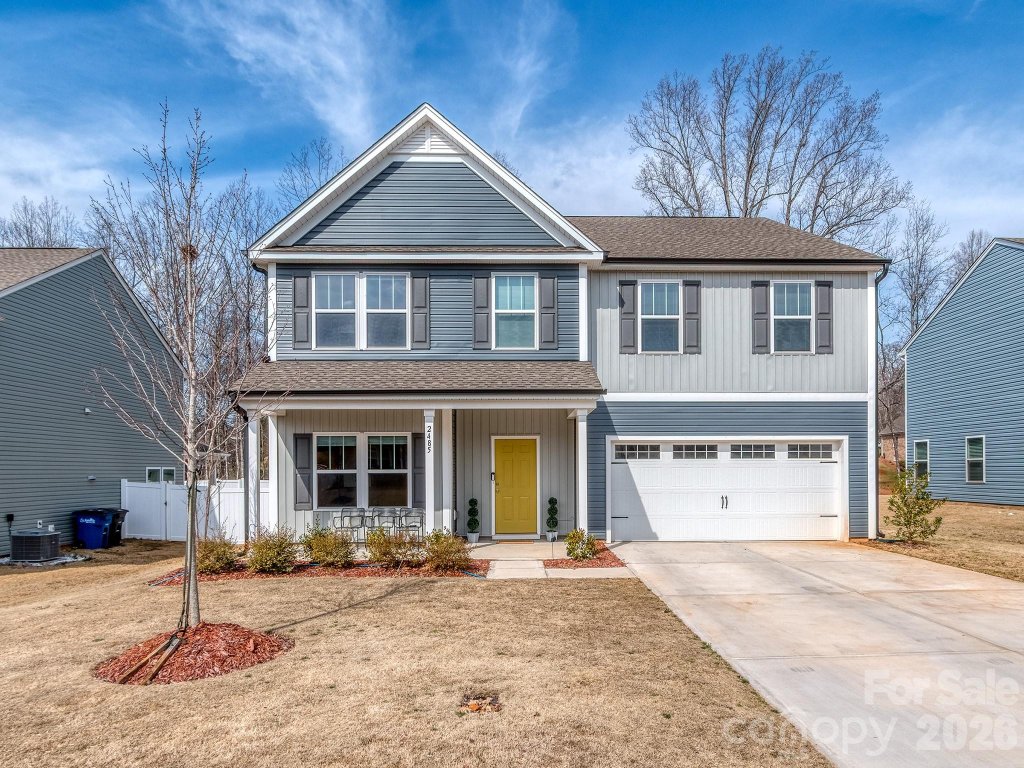
 SOLD 1215 Suncrest Avenue 3 bed2 bath | Apr 29 2024 | $235,000 | 34 | 98% | 1329 sq ft | $177 |
9 month gap in market activity | ||||||
 SOLD 1245 Suncrest Avenue 3 bed2 bath | Jul 19 2023 | $189,900 | 96 | 🎯100% | 1180 sq ft | $161 |
 SOLD 1322 Lerain Court 3 bed2 bath | Jun 5 2023 | $189,000 | 52 | 🎯100% | 1120 sq ft | $169 |
3 month gap in market activity | ||||||
 SOLD 448 Charles Street 3 bed1 bath | Feb 17 2023 | $163,000 | 232 | 96% | 1258 sq ft | $130 |
2 month gap in market activity | ||||||
 SOLD 446 Charles Street 2 bed1 bath | Dec 2 2022 | $80,000 | 155 | 73% | 729 sq ft | $110 |
 SOLD 1303 Rolling Lane 4 bed1 bath | Nov 28 2022 | $155,000 | 31 | 92% | 1374 sq ft | $113 |
 SOLD 318 Charles Street 5 bed2 bath | Oct 21 2022 | $110,000 | 39 | 🎯105% | 1824 sq ft | $60 |
5 month gap in market activity | ||||||
 SOLD 1215 Suncrest Avenue | May 4 2022 | $24,900 | 14 | 🎯100% | — | — |
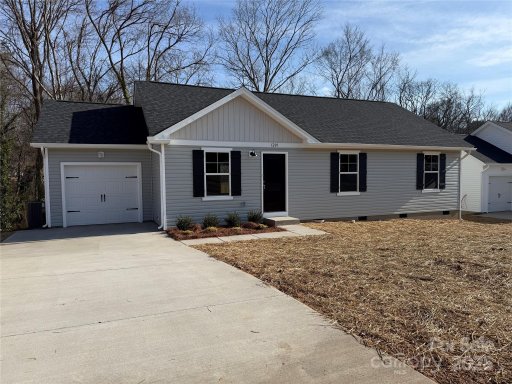
 SOLD 1246 Suncrest Avenue 3 bed2 bath | Apr 7 2022 | $144,000 | 44 | 🎯100% | 1224 sq ft | $118 |
6 month gap in market activity | ||||||
 SOLD 1011 Rickert Street 2 bed1 bath | Oct 5 2021 | $119,500 | 36 | 96% | 680 sq ft | $176 |
 SOLD 1246 Rolling Lane 3 bed2 bath | Aug 10 2021 | $181,500 | 34 | 🎯110% | 1050 sq ft | $173 |
8 month gap in market activity | ||||||
 SOLD 1342 Harris Street 3 bed1 bath | Dec 9 2020 | $100,000 | 305 | 🎯100% | 0 sq ft | $Infinity |
 SOLD 911 Sowers Street 2 bed1 bath | Nov 16 2020 | $112,000 | 80 | 98% | 1188 sq ft | $94 |
4 month gap in market activity | ||||||
 SOLD 623 Diamond Street 46,47,48 3 bed1 bath | Jul 9 2020 | $141,000 | 62 | 🎯101% | 1124 sq ft | $125 |
5 month gap in market activity | ||||||
 SOLD 623 Diamond Street 47, 46, 48 3 bed1 bath | Jan 22 2020 | $82,800 | 92 | 93% | 1124 sq ft | $74 |
1+ year gap in market activity | ||||||
 SOLD 1303 Rolling Lane 4 bed1 bath | Jul 2 2018 | $80,000 | 44 | 94% | 1374 sq ft | $58 |
1+ year gap in market activity | ||||||
 SOLD 1229 Suncrest Avenue 4 bed2 bath | Jun 8 2017 | $55,000 | 197 | 94% | 2066 sq ft | $27 |
 SOLD 1229 Suncrest Avenue 4 bed2 bath | Jun 8 2017 | $55,000 | 197 | 94% | 2066 sq ft | $27 |
2+ year gap in market activity | ||||||
 SOLD 730 Greater Living Place None 3 bed3 bath | Jun 11 2014 | $86,500 | 54 | 98% | 3120 sq ft | $28 |
3 month gap in market activity | ||||||
 SOLD 1001 Hull Street L7 Hull 3 bed1 bath | Feb 27 2014 | $29,500 | 1039 | 84% | 816 sq ft | $36 |
10 month gap in market activity | ||||||
 SOLD 1115 Rolling Lane 3 bed1 bath | Apr 25 2013 | $29,000 | 49 | 97% | 900 sq ft | $32 |
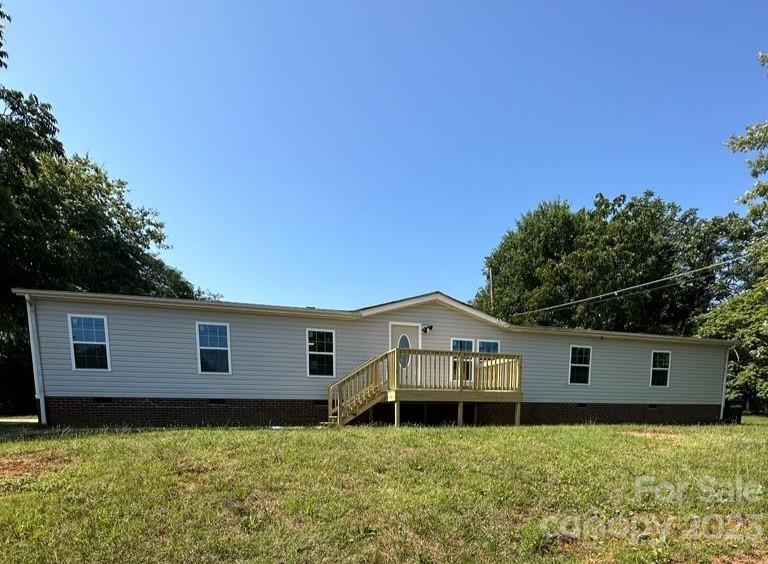
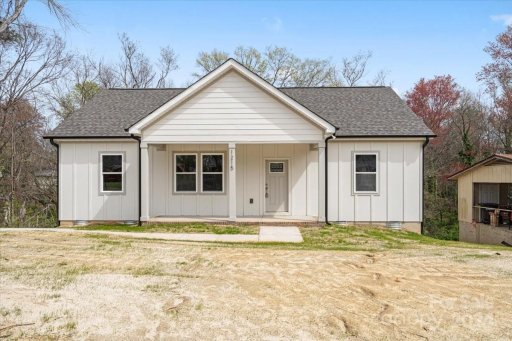
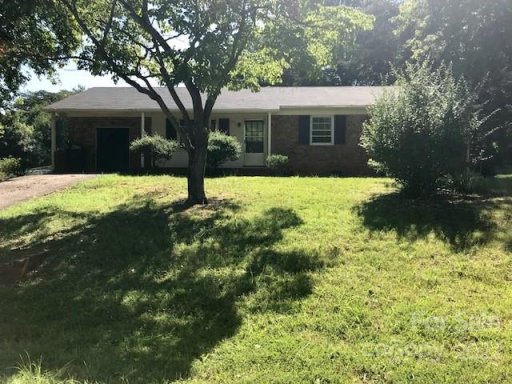
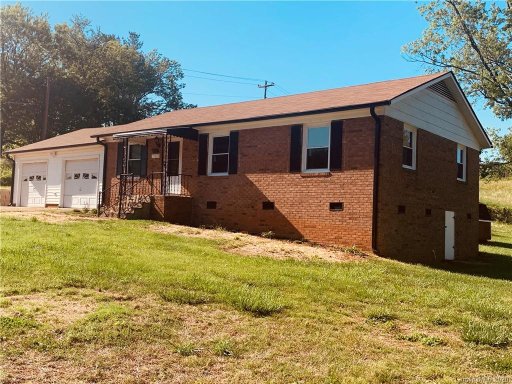
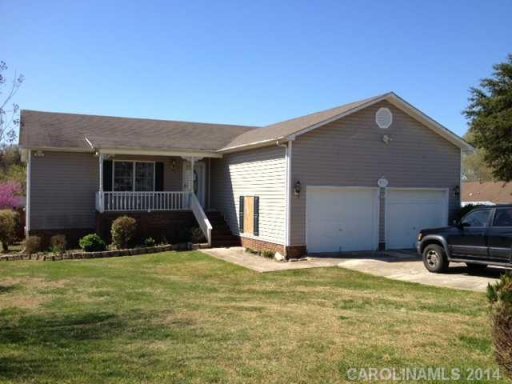
1201 Suncrest Avenue
$250,000
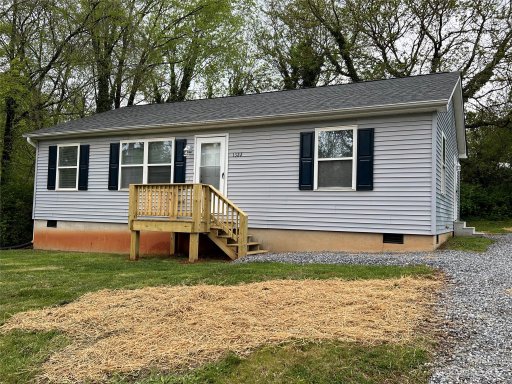
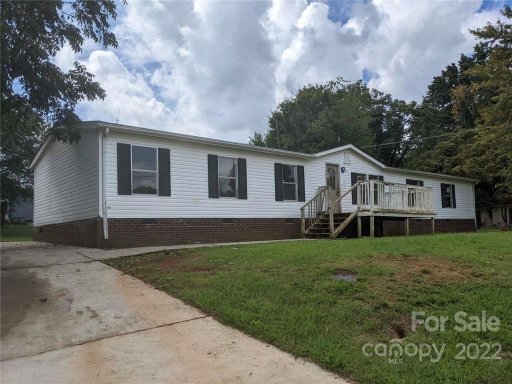
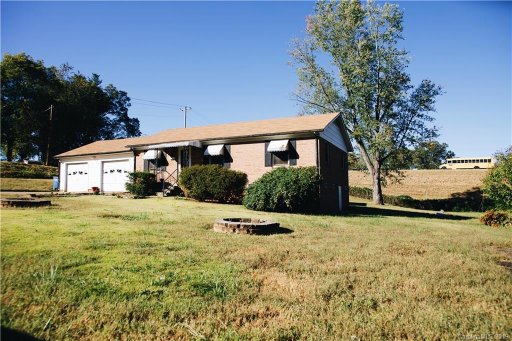
1207 Suncrest Avenue
$250,000
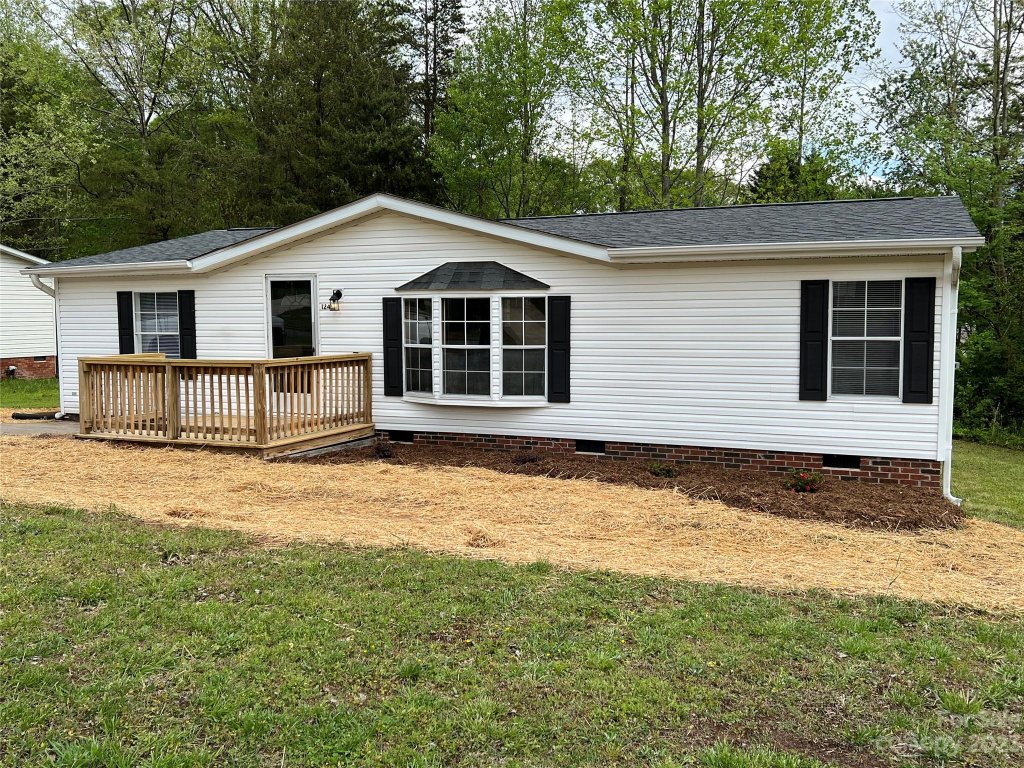
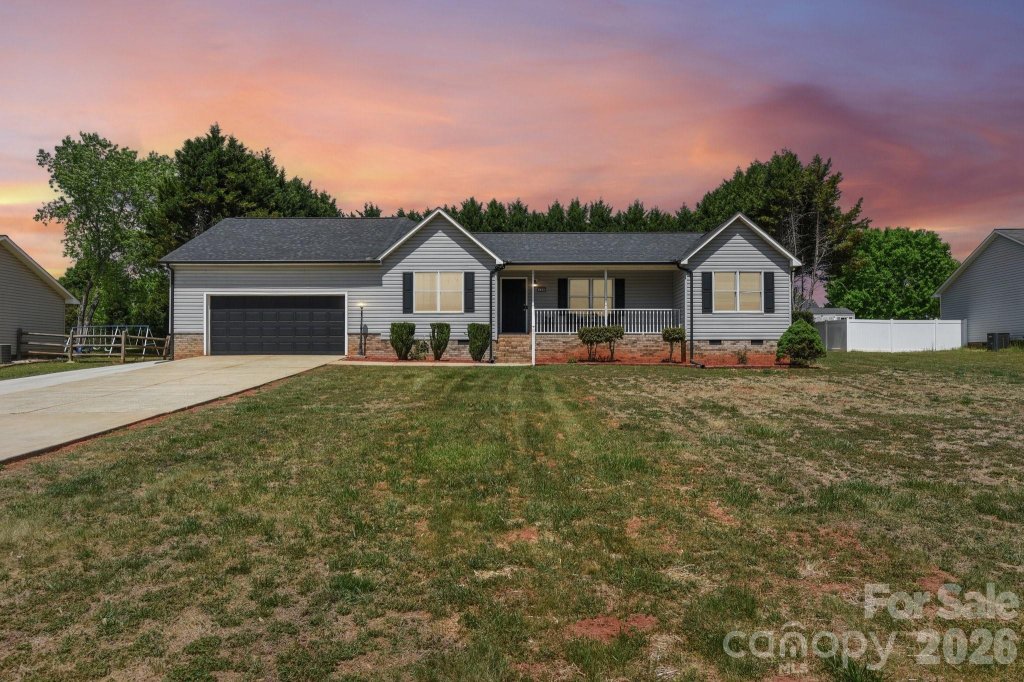
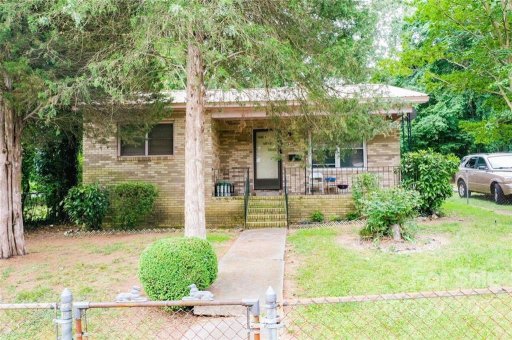
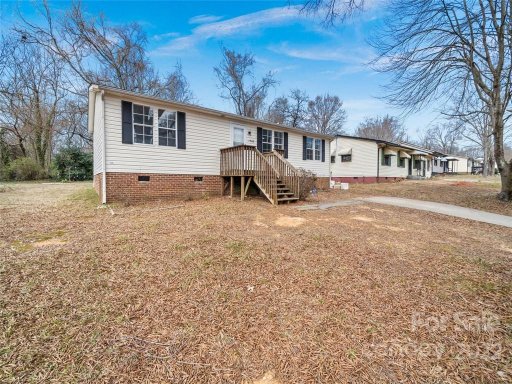
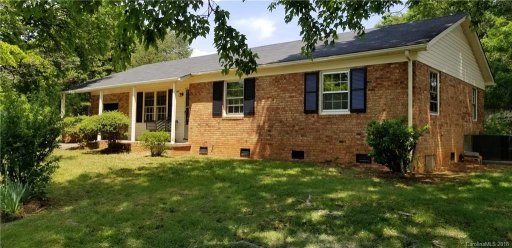
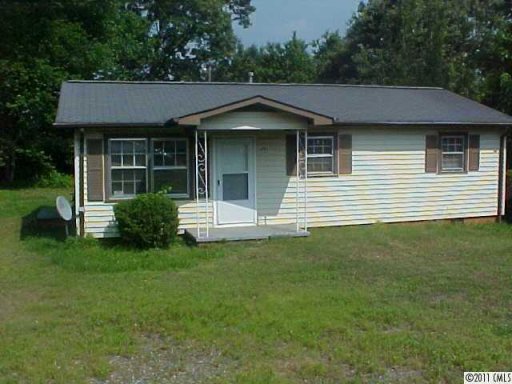
1426 Harris Street
$265,000
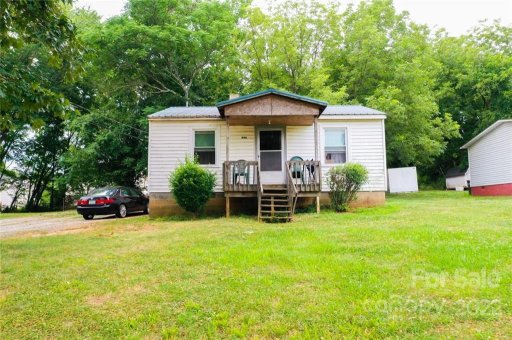
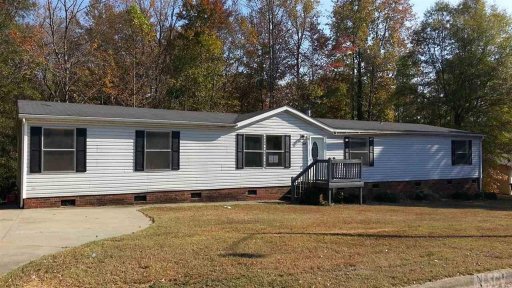
1005 Suncrest Avenue
$260,650
1444 Harris Street
$175,000
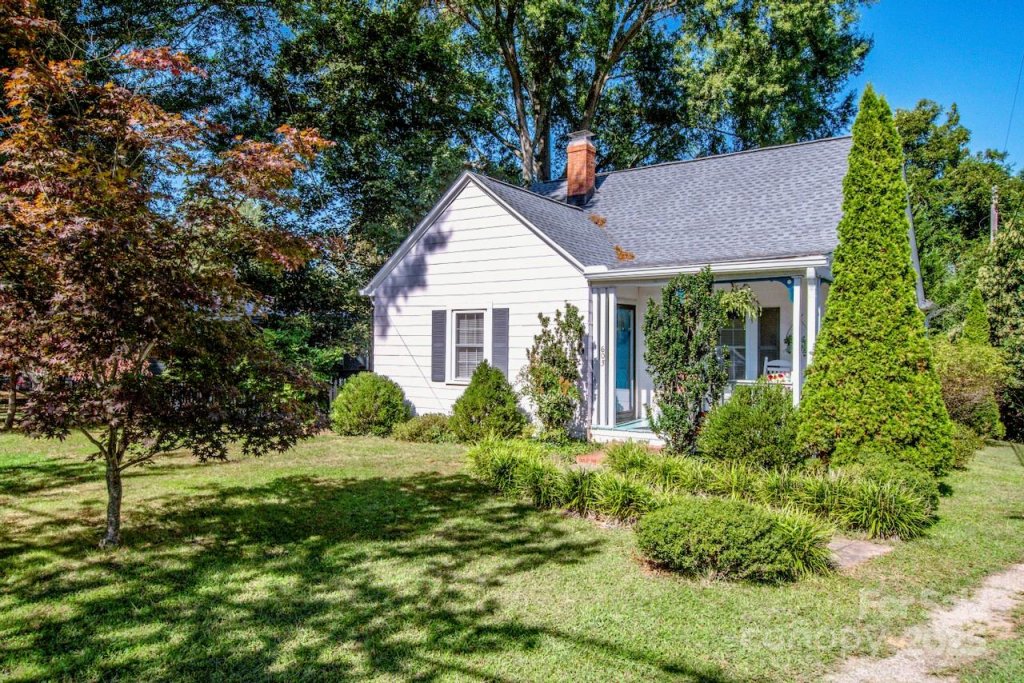
602 York Avenue
$178,000
606 York Avenue
$185,000
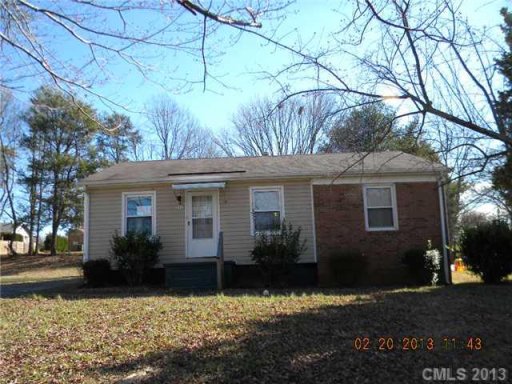
318 Charles Street
$220,000
1215 Suncrest Avenue
$235,000
1245 Suncrest Avenue
$189,900
1322 Lerain Court
$189,000
448 Charles Street
$163,000
446 Charles Street
$80,000
1303 Rolling Lane
$155,000
318 Charles Street
$110,000
1215 Suncrest Avenue
$24,900
1246 Suncrest Avenue
$144,000
1011 Rickert Street
$119,500
1246 Rolling Lane
$181,500
1342 Harris Street
$100,000
911 Sowers Street
$112,000
623 Diamond Street 46,47,48
$141,000
623 Diamond Street 47, 46, 48
$82,800
1303 Rolling Lane
$80,000
1229 Suncrest Avenue
$55,000
1229 Suncrest Avenue
$55,000
730 Greater Living Place None
$86,500
1001 Hull Street L7 Hull
$29,500
1115 Rolling Lane
$29,000
Market Statistics
The Rolling Hills real estate market shows buyer's market conditions. Homes typically sell within 62 days. With 0 active listings and 5 homes sold in the past year, Buyers have more negotiating power and time to decide.
Pricing
Median Price:$250,000
Average Price:$240,130
Property Details
Avg Bedrooms:3.2
Avg Bathrooms:1.6
Avg Lot Size:0.34 acres
Market Activity
Active Listings:0
Sold Last Year:5
Median Days to Sell:62 days
Community Info
Median Year Built:1998
New Construction:21%