Active
$285,000 $148/sqft
220 Holly Drive
Spartanburg, SC 29301
3 bd · 2 ba · 1,920 sqft · 1960 · 14 d ago
Fireplace Garage
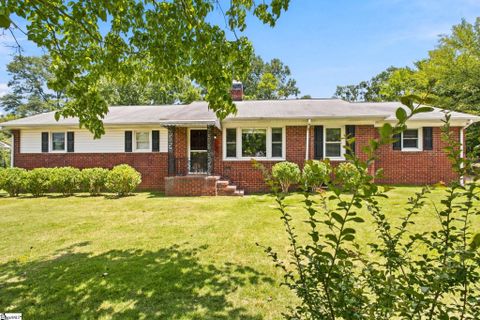
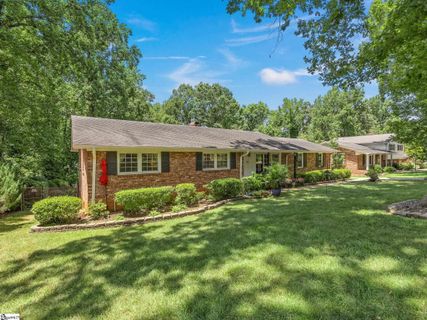
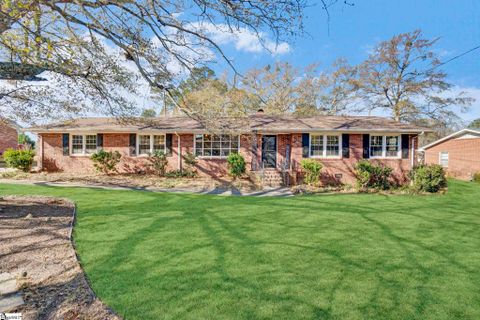
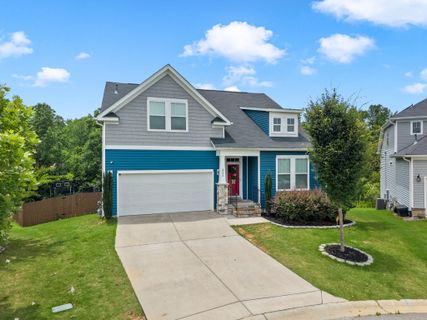
Woodland Heights has the feel of a long-established Spartanburg westside neighborhood, where mature trees, wider lots, and classic ranch homes set a grounded, familiar tone.
Community overview based on MLS listing data for Woodland Heights, Spartanburg
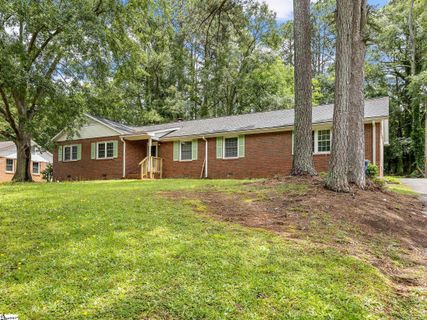
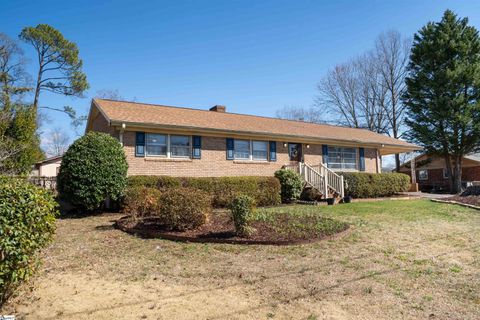
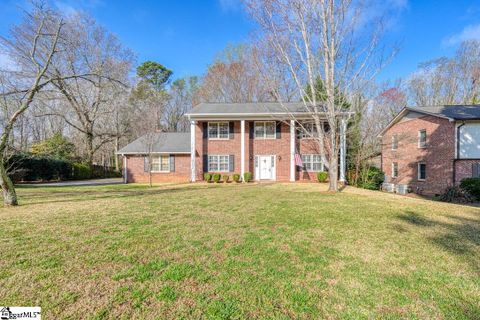
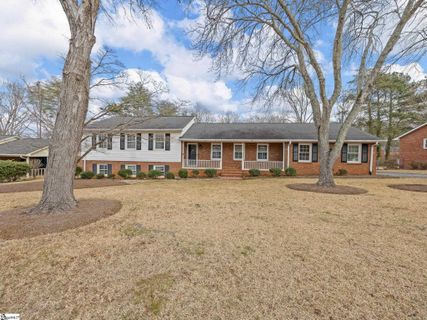
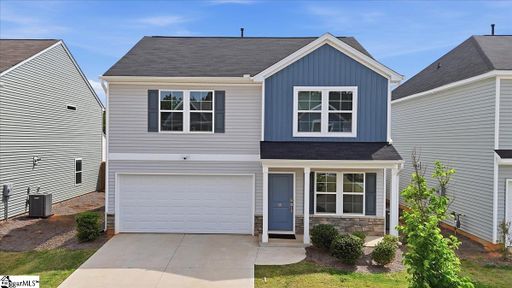
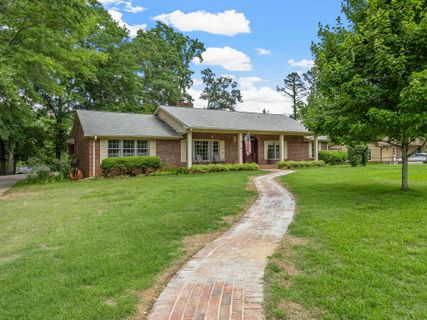
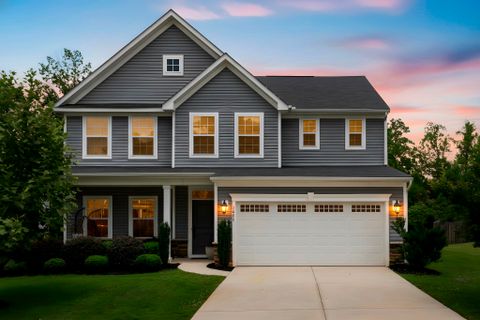
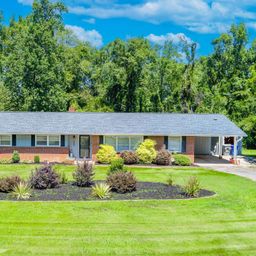
Woodland Heights has the feel of a long-established Spartanburg westside neighborhood, where mature trees, wider lots, and classic ranch homes set a grounded, familiar tone. The streets read as settled rather than newly built, with many properties sitting on generous parcels that give the area a little more breathing room than you might expect this close to town. Brick is a recurring part of the streetscape, and the overall impression is one of solid construction, practical layouts, and homes that have been cared for and updated over time.
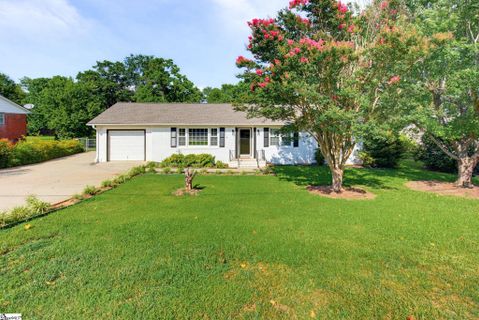
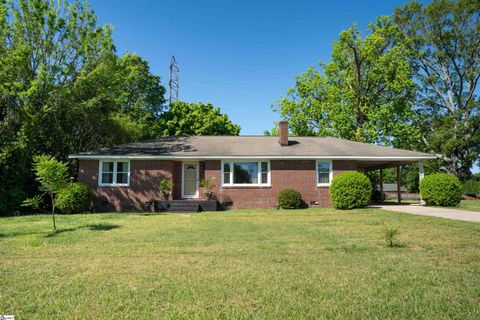
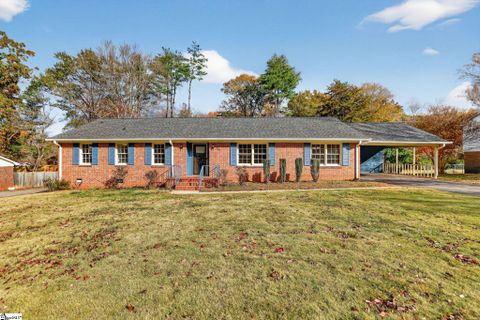
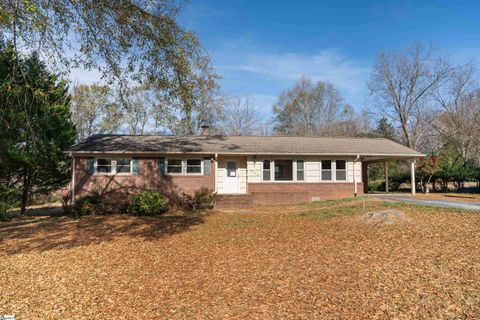
Single-family homes define Woodland Heights, and the architecture leans heavily toward mid-century and late-20th-century ranch styling. Many homes feature brick exteriors, hardwood floors, fireplaces, and flexible living areas that have been opened up or adapted for modern use. Several listings mention sunrooms, screened porches, decks, fenced backyards, and outbuildings, which gives the neighborhood a lived-in, functional character. Garage and carport parking are common, and the lot sizes are often substantial enough for gardens, workshops, or extra outdoor storage. Most homes were built between the early 1950s and the late 1970s, so buyers tend to find established floor plans with a mix of original charm and practical updates.
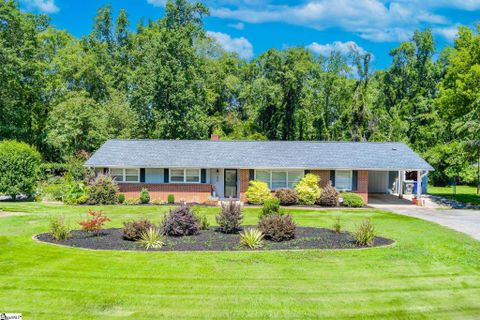
Woodland Heights does not present as a master-planned community with a long amenity list; instead, its appeal comes from the everyday usefulness of the setting. A neighborhood pool is mentioned in the listings as an optional resident amenity, and the area’s larger yards, patios, and porches support an easy indoor-outdoor rhythm. The homes themselves often include extra living spaces, bonus rooms, workshops, and storage buildings, which adds versatility without sacrificing the neighborhood’s traditional feel. With average days on market around 45, the pace here is measured, and the housing stock spans everything from more modest brick ranches to larger renovated homes with expanded footprints and upgraded finishes.
Woodland Heights sits on Spartanburg’s west side in District 6, with quick access to the city’s main travel routes. Listings specifically note easy reach to I-85 and I-26, plus downtown Spartanburg about 8 to 10 minutes away in some remarks. Westside shopping, restaurants, and the Westgate shopping area are also close by, and several remarks call out nearby destinations such as Costco, Target, Sam’s Club, Hatcher Garden and Woodland Preserve, and Fifth Third Park. The community is served by Woodland Heights Elementary, RP Dawkins Middle, and Dorman High, with District 6 repeatedly referenced in the listing remarks. That combination of established streets, practical commuting access, and nearby everyday destinations is a big part of what defines Woodland Heights.
Palmetto Park Realty Team · Spartanburg
Ask about Woodland Heights — we answer fast
See what it's worth — your home's own sale history plus recent Woodland Heights sales, free.
What's my home worth?Communities similar to Woodland Heights
 2.2 mi
 Braxton Place, Moore
7 active · $259,000
Woodland Hgts, Spartanburg
9 active · $279,900
 3.2 mi
 Ravencrest, Roebuck
17 active · $291,100
 4.5 mi
 Pleasant Falls, Moore
2 active · $297,950
 3.6 mi
 The Village At Anderson Mill, Moore
6 active · $323,950
 2.7 mi
 Westgrove Village, Moore
3 active · $399,777
Showing 1-48+ recently sold in Woodland Heights, Spartanburg
| Property | Sold | Sold Price | Days on Market | Size | Sold to Ask | Sold $/SF |
|---|---|---|---|---|---|---|
| | Jun 15 2026 | $240,000 | 109 | 1,795 sq ft | 102.2% | $134 |
| | Apr 28 2026 | $335,000 | 48 | 2,639 sq ft | 96.5% | $127 |
| | Apr 24 2026 | $283,750 | 62 | 2,615 sq ft | 101.3% | $109 |
| | Feb 6 2026 | $275,000 | 49 | 1,834 sq ft | 98.5% | $150 |
| | Jan 13 2026 | $267,000 | 61 | 2,250 sq ft | 97.1% | $119 |
| | Jan 9 2026 | $190,000 | 44 | 1,478 sq ft | 95.0% | $129 |
| | Nov 17 2025 | $267,500 | 82 | 3,308 sq ft | 76.4% | $81 |
| | Oct 14 2025 | $325,000 | 39 | 2,035 sq ft | 98.5% | $160 |
| | Sep 3 2025 | $373,000 | 32 | 2,616 sq ft | 99.5% | $143 |
| | Jul 14 2025 | $345,000 | 44 | 2,907 sq ft | 95.8% | $119 |
| | Jun 6 2025 | $545,000 | 91 | 2,571 sq ft | 99.3% | $212 |
| | May 12 2025 | $174,450 | 22 | 1,820 sq ft | 97.0% | $96 |
| | Jan 31 2025 | $247,500 | 17 | 1,566 sq ft | 99.0% | $158 |
| | Sep 5 2024 | $315,000 | 28 | 2,598 sq ft | 100.0% | $121 |
| | Jul 3 2024 | $265,000 | 21 | 1,702 sq ft | 104.0% | $156 |
| | Apr 26 2024 | $240,000 | 171 | 1,606 sq ft | 98.8% | $149 |
| | Apr 15 2024 | $225,000 | 61 | 2,606 sq ft | 86.6% | $86 |
| | Sep 15 2023 | $205,000 | 93 | 2,075 sq ft | 93.2% | $99 |
| | Sep 7 2023 | $226,000 | 48 | 1,659 sq ft | 98.7% | $136 |
| | Jun 15 2023 | $235,000 | 99 | 1,688 sq ft | 100.0% | $139 |
| | Apr 21 2023 | $306,000 | 83 | 2,063 sq ft | 94.2% | $148 |
| | Mar 31 2023 | $250,000 | 128 | 2,190 sq ft | 94.4% | $114 |
| | Mar 9 2023 | $240,000 | 159 | 1,855 sq ft | 100.4% | $129 |
| | Jan 17 2023 | $165,000 | 259 | 1,613 sq ft | 85.1% | $102 |
| | Nov 29 2022 | $15,000 | 158 | — | 75.4% | — |
| | Oct 20 2022 | $243,500 | 27 | 2,048 sq ft | 92.1% | $119 |
| | Aug 12 2022 | $201,000 | 16 | 1,526 sq ft | 129.7% | $132 |
| | Aug 5 2022 | $177,000 | 27 | 2,001 sq ft | 95.7% | $88 |
| | Jul 25 2022 | $288,500 | 167 | 3,206 sq ft | 100.0% | $90 |
| | Jun 13 2022 | $220,000 | 45 | 1,799 sq ft | 102.4% | $122 |
| | May 13 2022 | $221,000 | 34 | 1,459 sq ft | 110.6% | $151 |
| | Apr 8 2022 | $230,000 | 27 | 1,680 sq ft | 107.0% | $137 |
| | Jan 14 2022 | $246,000 | 52 | 1,800 sq ft | 100.0% | $137 |
| | Jan 5 2022 | $180,000 | 46 | 1,941 sq ft | 105.9% | $93 |
| | Nov 18 2021 | $155,000 | 126 | 1,650 sq ft | 100.0% | $94 |
| | Nov 9 2021 | $222,800 | 37 | 1,528 sq ft | 99.0% | $146 |
| | Oct 13 2021 | $210,000 | 34 | 1,798 sq ft | 93.3% | $117 |
| | Sep 24 2021 | $275,000 | 43 | 2,446 sq ft | 100.0% | $112 |
| | Sep 9 2021 | $203,000 | 35 | 1,496 sq ft | 106.8% | $136 |
| | Jun 24 2021 | $195,000 | 111 | 1,450 sq ft | 100.0% | $134 |
| | Apr 30 2021 | $220,000 | 37 | 1,983 sq ft | 105.8% | $111 |
| | Jan 5 2021 | $135,000 | 63 | 1,450 sq ft | 100.2% | $93 |
| | Dec 18 2020 | $179,900 | 55 | 1,849 sq ft | 100.0% | $97 |
| | Aug 31 2020 | $230,000 | 45 | 1,694 sq ft | 95.9% | $136 |
| | Aug 14 2020 | $242,500 | 255 | 2,265 sq ft | 100.0% | $107 |
| | Jun 26 2020 | $179,900 | 80 | 1,908 sq ft | 100.0% | $94 |
| | May 13 2020 | $7,500 | 46 | — | 75.0% | — |
| | May 8 2020 | $160,000 | 166 | 1,682 sq ft | 98.3% | $95 |
Closed sales from MLS history for Woodland Heights, Spartanburg
Woodland Heights median sale price is $275,000, down 12.7% from a year ago; Spartanburg is up 6.0%.
+1 outside price range.
The Woodland Heights real estate market shows buyer's market conditions. Homes typically sell within 63 days. With 7 active listings and 9 homes sold in the past year, buyers have more negotiating power and time to decide.
Listings taken off the market in the past year in Woodland Heights, Spartanburg
Spartanburg, SC 29301
Spartanburg, SC 29301
3 bd · 2 ba · 2,043 sqft
These homes are no longer available, but they show recent pricing and listing activity in Woodland Heights. Our agents can help you watch for new listings in this area.
Contact an agentFree account needed — create one to continue viewing homes.
Members see everything — free👋 Still browsing Woodland Heights?
Full photos, price history, and every active & pending home in Woodland Heights with a free account.
Palmetto Park Realty Team
 $285K
$285K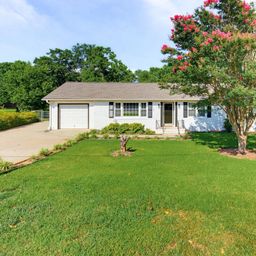 $275K
$275K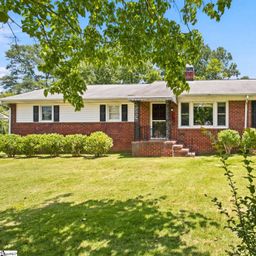 $275K
$275K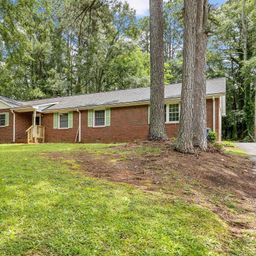 $265K
$265K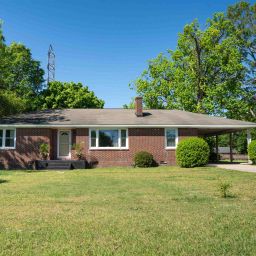 $250K
$250K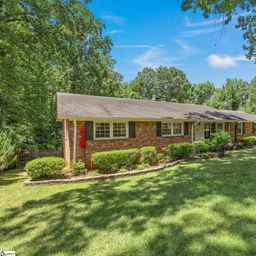 $280K
$280KCheck your messages
We sent a code to .
Verify your number and we'll text you price drops and new Woodland Heights listings. 1–2 texts a month, stop anytime.
Enjoy full access to this home and every home on Palmetto Park.