Pending
$249,900 $143/sqft
136 Shannon Street
Spartanburg, SC 29307
3 bd · 2 ba · 1,748 sqft · 1964 · 4 mo ago
Garage
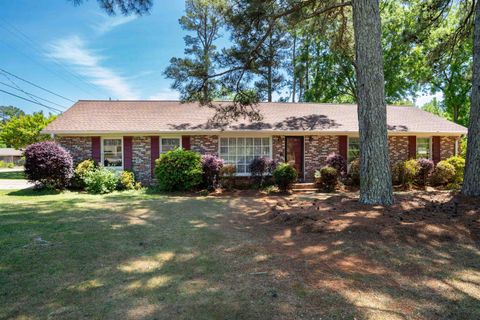
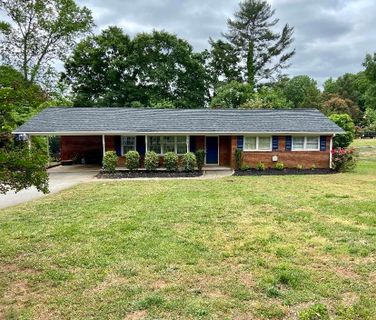
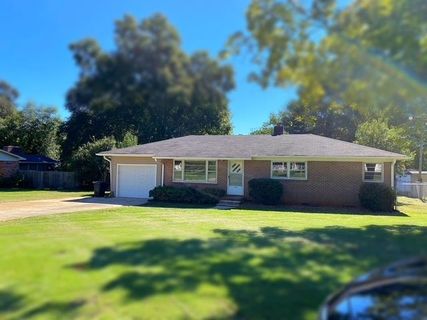
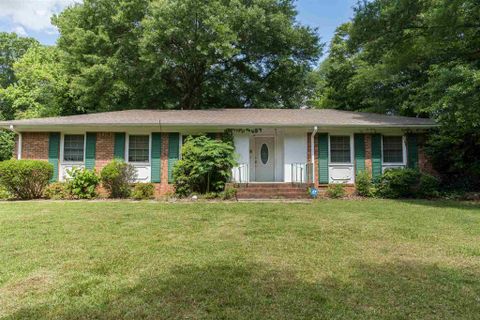
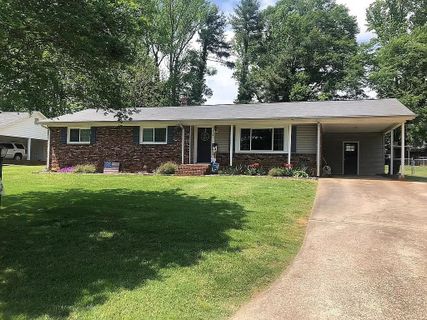
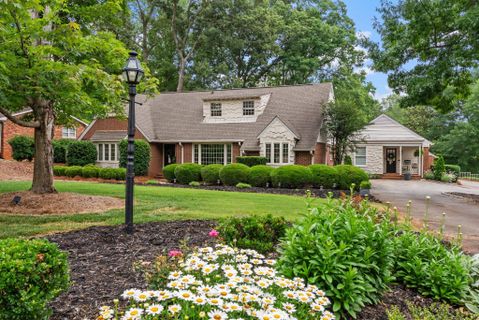
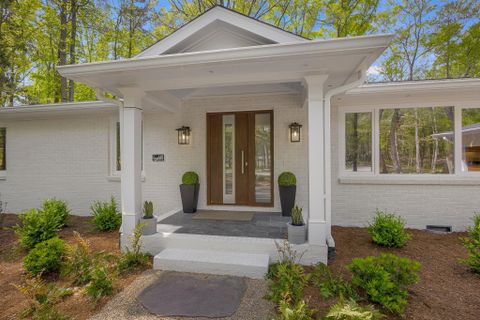
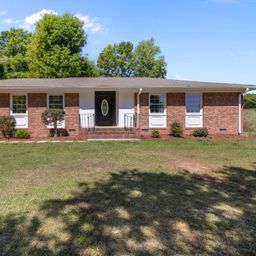
Eastway Park has the feel of a long-established Spartanburg east-side neighborhood where brick ranches, mature trees, and practical outdoor spaces set the tone.
Community overview based on MLS listing data for Eastway Park, Spartanburg
Eastway Park has the feel of a long-established Spartanburg east-side neighborhood where brick ranches, mature trees, and practical outdoor spaces set the tone. Homes here tend to sit on generous lots, and many have been refreshed with modern kitchens, updated baths, and flexible bonus rooms that make everyday living feel easy and adaptable. The streets read as settled rather than flashy, with cul-de-sacs, fenced yards, and detached workshops adding to the neighborhood’s unmistakably lived-in character.
"Eastway Park blends classic ranch living with the kind of useful outdoor space that still matters every day."
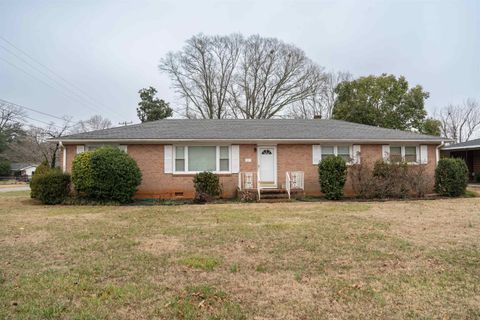
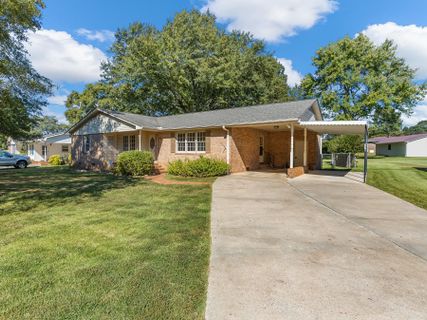
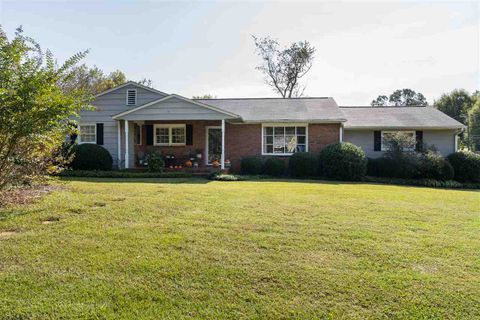
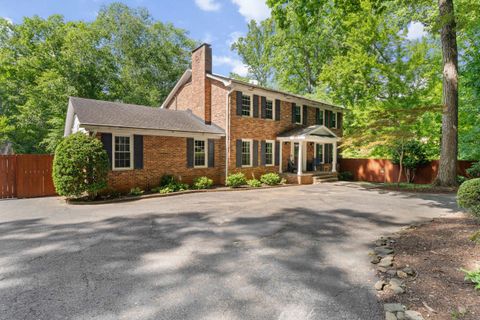
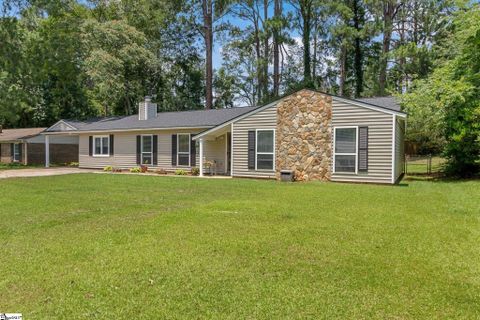
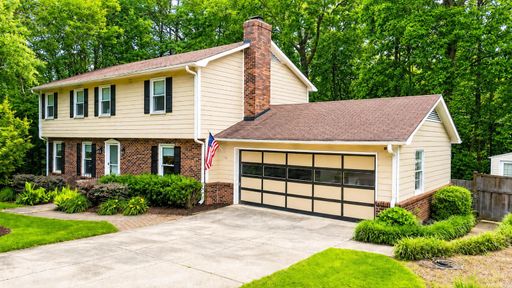
Single-family ranch homes define the neighborhood, with construction dating from the early 1960s through the early 1980s. Brick appears often enough to shape the look and feel of the community, and many homes pair that exterior with hardwood floors, carports or garages, and generous storage. Inside, the floor plans are often straightforward but surprisingly flexible: den spaces with fireplaces, dining areas that open to kitchens, and bonus rooms that can serve as offices, hobby rooms, or extra living areas.
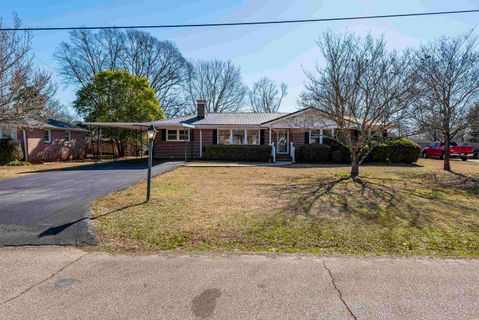
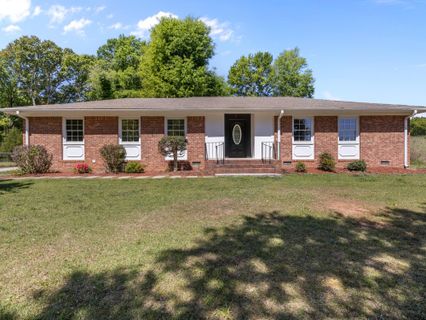
Outdoor features are a major part of the appeal. Fenced backyards, covered porches, rebuilt decks, patios, and detached workshops show up repeatedly, giving the neighborhood a practical, hands-on quality. The overall impression is of homes that have been cared for, improved over time, and used in ways that fit real daily routines.
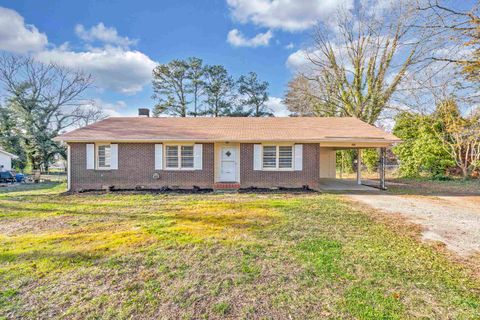
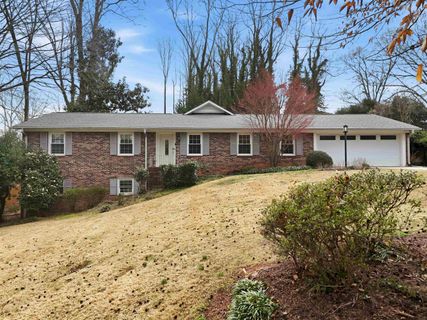
Eastway Park does not lean on resort-style amenities; instead, it offers the kind of everyday convenience that comes from being close to Spartanburg’s east-side services. Residents can expect quick access to shopping, dining, entertainment, and nearby hospitals, while the neighborhood itself offers a quieter, more residential pace. A neighborhood park with a basketball court, baseball or softball field, and a playground adds a recreational anchor within the community.
"The rhythm here is simple: classic houses, useful yards, and easy access to the east side’s essentials."
Eastway Park sits on Spartanburg’s east side, with easy reach to Hillcrest, downtown Spartanburg, and the newer Spartanburg High School. Listings point to a short drive to I-85 and downtown Spartanburg, and one remark notes the high school is less than 2 miles away. The community is in District 7 and is commonly zoned for Jesse Boyd Elementary, McCracken Middle, and Spartanburg High. That school alignment, along with proximity to east-side shopping, restaurants, hospitals, and Hillcrest Shopping Center, helps explain why this pocket remains a familiar Spartanburg address for buyers who want a central east-side location with straightforward daily access.
Palmetto Park Realty Team · Spartanburg
Ask about Eastway Park — we answer fast
See what it's worth — your home's own sale history plus recent Eastway Park sales, free.
What's my home worth?Communities similar to Eastway Park
 1.0 mi
 Hillbrook, Spartanburg
7 active · $349,900
 1.8 mi
 Pierce Acres, Spartanburg
4 active · $347,450
 1.0 mi
 Hillbrook Forest, Spartanburg
10 active · $337,950
 2.2 mi
 Pine Forest, Spartanburg
2 active · $319,000
 2.0 mi
 Heathwood East, Spartanburg
2 active · $386,950
 2.1 mi
 Calhoun Lakes, Spartanburg
3 active · $965,000
41 recently sold in Eastway Park, Spartanburg
| Property | Sold | Sold Price | Days on Market | Size | Sold to Ask | Sold $/SF |
|---|---|---|---|---|---|---|
| | Jun 29 2026 | $245,000 | 62 | 1,700 sq ft | 102.5% | $144 |
| | May 5 2026 | $212,500 | 119 | 1,428 sq ft | 97.0% | $149 |
| | May 14 2025 | $260,000 | 91 | 1,600 sq ft | 96.7% | $163 |
| | Mar 20 2023 | $186,900 | 32 | 1,252 sq ft | 100.0% | $149 |
| | Jun 10 2022 | $233,000 | 32 | 1,676 sq ft | 108.4% | $139 |
| | Dec 7 2021 | $150,000 | 74 | 1,161 sq ft | 96.8% | $129 |
| | Oct 28 2021 | $187,500 | 31 | 1,530 sq ft | 100.0% | $123 |
| | Sep 21 2021 | $163,500 | 124 | 1,748 sq ft | 109.0% | $94 |
| | Jul 27 2021 | $211,000 | 56 | 1,731 sq ft | 106.0% | $122 |
| | Dec 4 2020 | $163,000 | 46 | 1,393 sq ft | 102.0% | $117 |
| | Jul 10 2020 | $165,000 | 56 | 2,066 sq ft | 94.3% | $80 |
| | May 15 2020 | $180,000 | 46 | 1,747 sq ft | 103.4% | $103 |
| | Sep 16 2019 | $121,700 | 40 | 1,278 sq ft | 99.9% | $95 |
| | Apr 9 2019 | $117,000 | 230 | 1,366 sq ft | 97.6% | $86 |
| | Dec 11 2018 | $140,000 | 56 | 1,637 sq ft | 96.6% | $86 |
| | Oct 25 2018 | $129,500 | 49 | 1,673 sq ft | 94.9% | $77 |
| | Aug 14 2018 | $129,900 | 48 | 1,393 sq ft | 100.0% | $93 |
| | Jun 1 2018 | $134,900 | 45 | 1,486 sq ft | 100.0% | $91 |
| | Apr 25 2018 | $95,000 | 46 | 1,252 sq ft | 100.2% | $76 |
| | Apr 3 2018 | $99,000 | 36 | 1,516 sq ft | 100.0% | $65 |
| | Feb 16 2018 | $136,000 | 81 | 1,747 sq ft | 99.6% | $78 |
| | Dec 4 2017 | $77,500 | 39 | 1,486 sq ft | 97.0% | $52 |
| | Aug 30 2017 | $116,000 | 37 | 1,393 sq ft | 105.5% | $83 |
| | Aug 1 2017 | $109,000 | 42 | 1,135 sq ft | 100.0% | $96 |
| | Aug 18 2016 | $120,000 | 78 | 1,702 sq ft | 100.1% | $71 |
| | Jun 15 2016 | $97,000 | 126 | 1,334 sq ft | 97.0% | $73 |
| | Nov 10 2015 | $138,500 | 46 | 2,114 sq ft | 100.0% | $66 |
| | May 27 2015 | $68,000 | 44 | 1,432 sq ft | 89.5% | $47 |
| | Apr 25 2014 | $126,799 | 205 | 1,948 sq ft | 97.5% | $65 |
| | Feb 15 2013 | $53,000 | 192 | 1,637 sq ft | 110.6% | $32 |
| | Mar 18 2011 | $105,000 | 280 | 1,411 sq ft | 95.5% | $74 |
| | Dec 7 2010 | $80,000 | 158 | 1,301 sq ft | 94.2% | $61 |
| | Apr 30 2010 | $122,500 | 347 | 1,411 sq ft | 100.0% | $87 |
| | Mar 24 2009 | $45,000 | 14 | 1,720 sq ft | 100.0% | $26 |
| | Jun 26 2008 | $125,500 | 154 | 1,731 sq ft | 96.6% | $73 |
| | Jun 13 2008 | $81,400 | 63 | 1,411 sq ft | 99.4% | $58 |
| | Feb 22 2008 | $135,000 | 109 | 2,066 sq ft | 98.2% | $65 |
| | Jun 2 2006 | $98,500 | 392 | 1,418 sq ft | 98.6% | $69 |
| | May 2 2006 | $96,000 | 113 | 1,624 sq ft | 96.5% | $59 |
| | Jun 29 2005 | $113,900 | 34 | 1,500 sq ft | 100.0% | $76 |
| | May 12 2005 | $14,000 | 43 | — | 93.3% | — |
Closed sales from MLS history for Eastway Park, Spartanburg
Eastway Park median sale price is $187,500; Spartanburg is up 5.8%.
Below trend-line threshold — city median shown for context
The Eastway Park real estate market shows balanced market conditions. Homes typically sell within 56 days. With 1 active listing and 2 homes sold in the past year, a healthy balance exists between buyers and sellers.
Listings taken off the market in the past year in Eastway Park, Spartanburg
These homes are no longer available, but they show recent pricing and listing activity in Eastway Park. Our agents can help you watch for new listings in this area.
Contact an agentFree account needed — create one to continue viewing homes.
Members see everything — free👋 Still browsing Eastway Park?
Full photos, price history, and every active & pending home in Eastway Park with a free account.
Palmetto Park Realty Team
 $250K
$250KCheck your messages
We sent a code to .
Verify your number and we'll text you price drops and new Eastway Park listings. 1–2 texts a month, stop anytime.
Enjoy full access to this home and every home on Palmetto Park.