Cotton Mill Place Condos in a Historic Mill Conversion
4 homes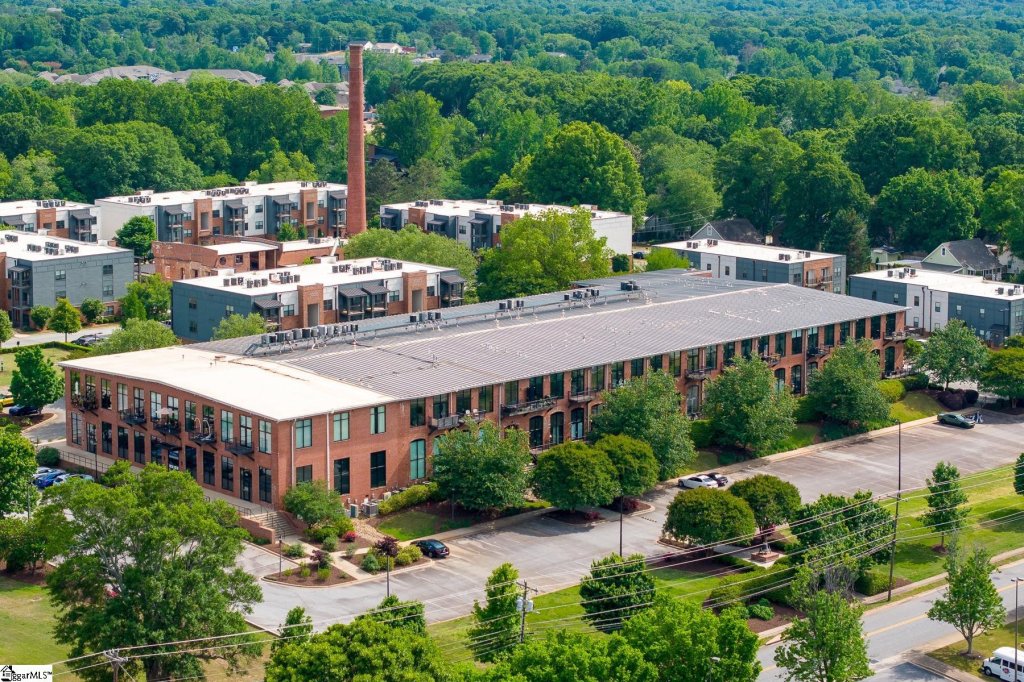
Community Highlights
- Historic 1908 mill conversion with authentic architectural character
- Walkable downtown Simpsonville location near Main Street
- Climate-controlled storage included with many residences
- Limited resale inventory in a landmark condo setting
* Based on what we noticed in listing details.

board games · Books · comfortable seating
pond with fountain · Swings · landscaped gardens +2
11x12 to 12x15 feet
* Based on what we noticed in listing details.

Architecture & Style
- Exposed Brick Walls
- Original Hardwood Floors
- High Ceilings
- Floor-To-Ceiling Windows
- Exposed Wooden Beams
- Exposed Ductwork
- Spiral Staircases
* Based on what we noticed in listing details.

Location & Proximity
Upstate South Carolina, Greenville County
- Warehouse at Vaughn's
- 1885 Taproom
- Chestnut Coffee
- Ice Cream Station
- Swamp Rabbit Trail
* Based on what we noticed in listing details.

Amanda Powell
REALTOR®
Greenville


Questions about Cotton Mill Place?
Call Us(864) 757-4000
First Impressions
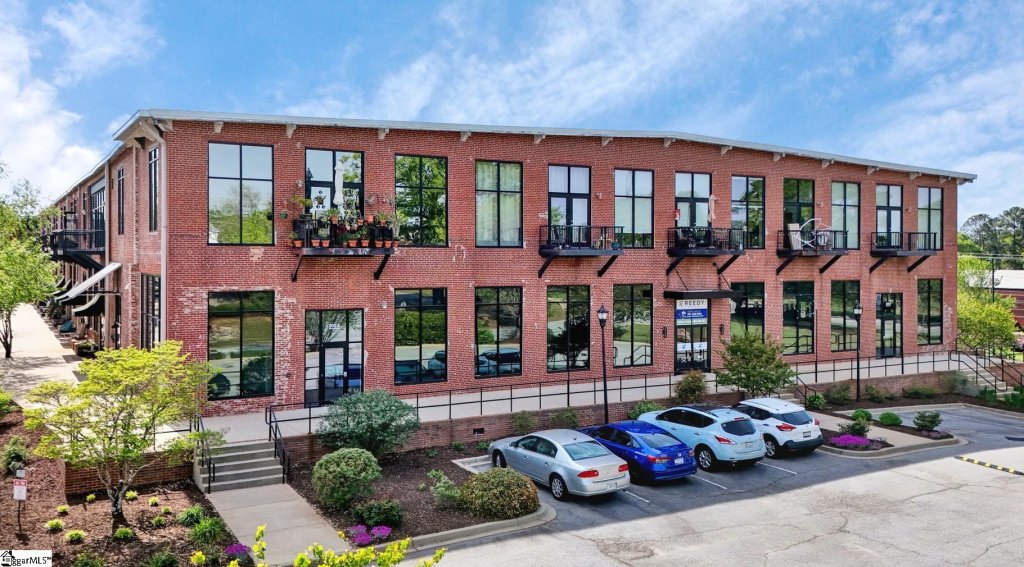
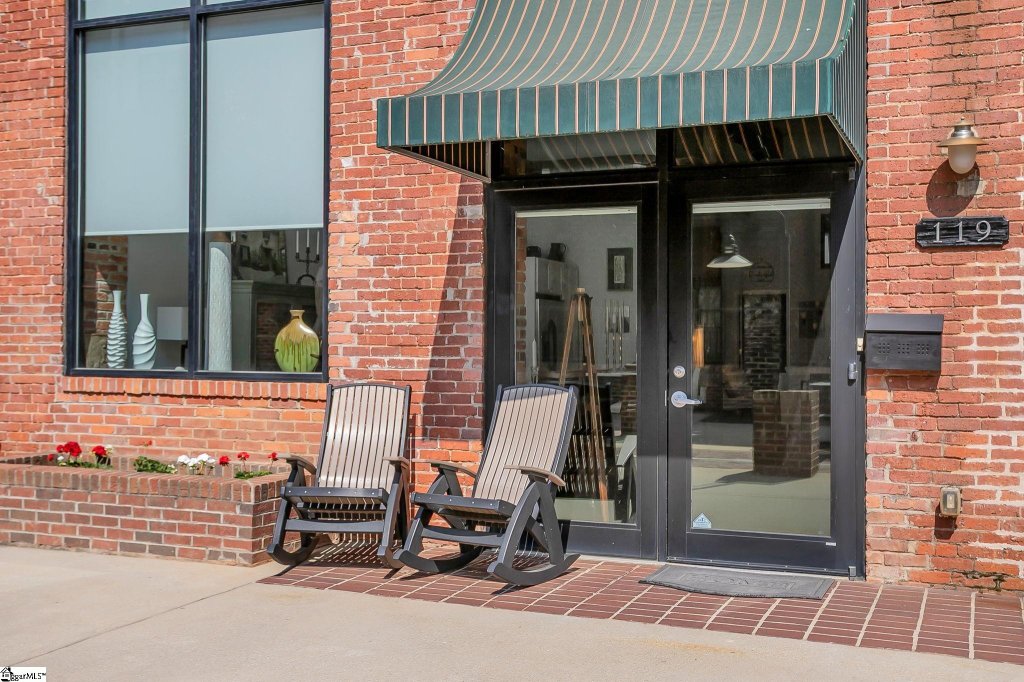
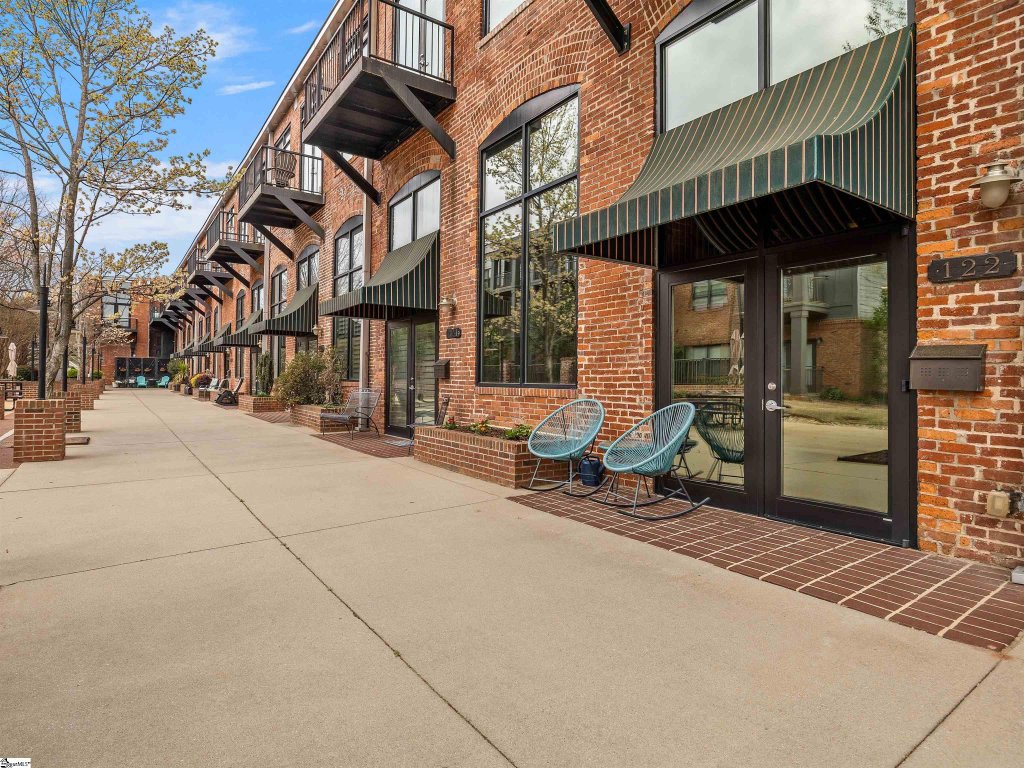
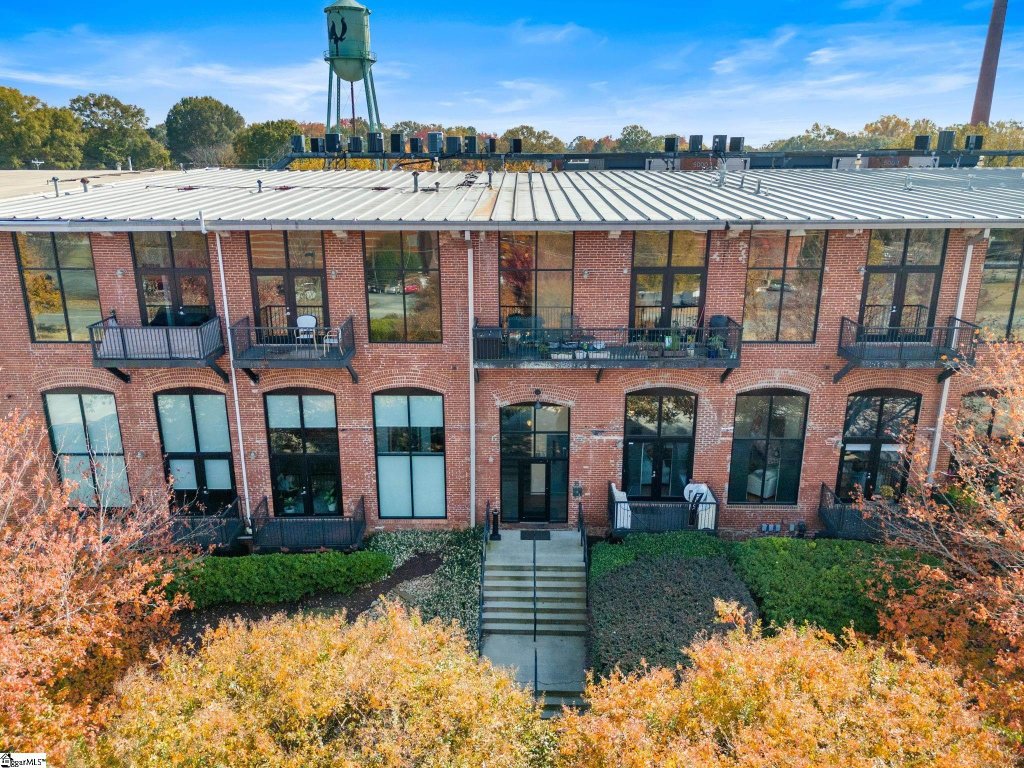
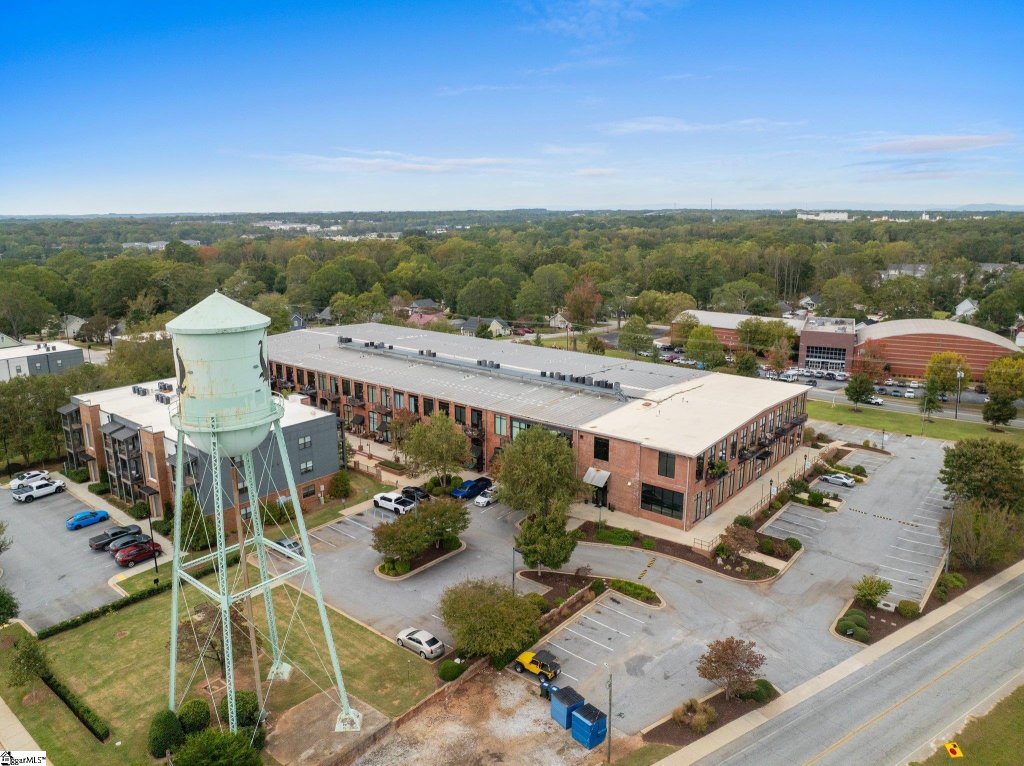
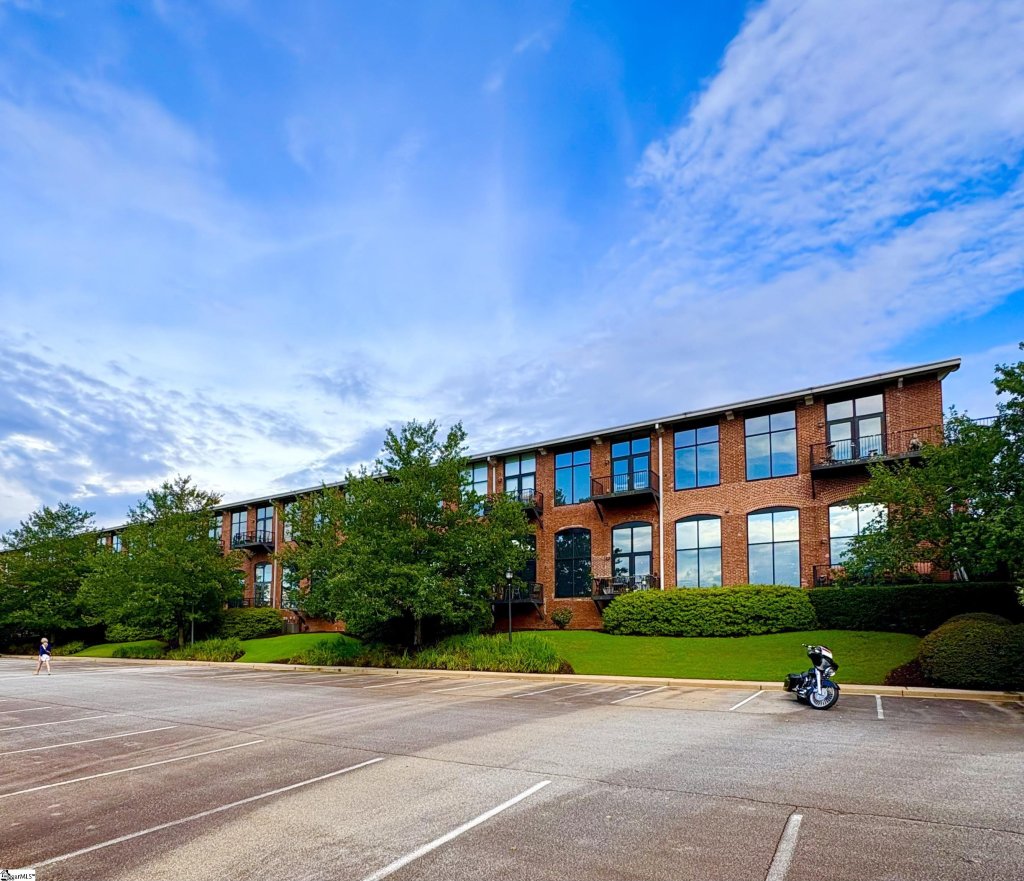
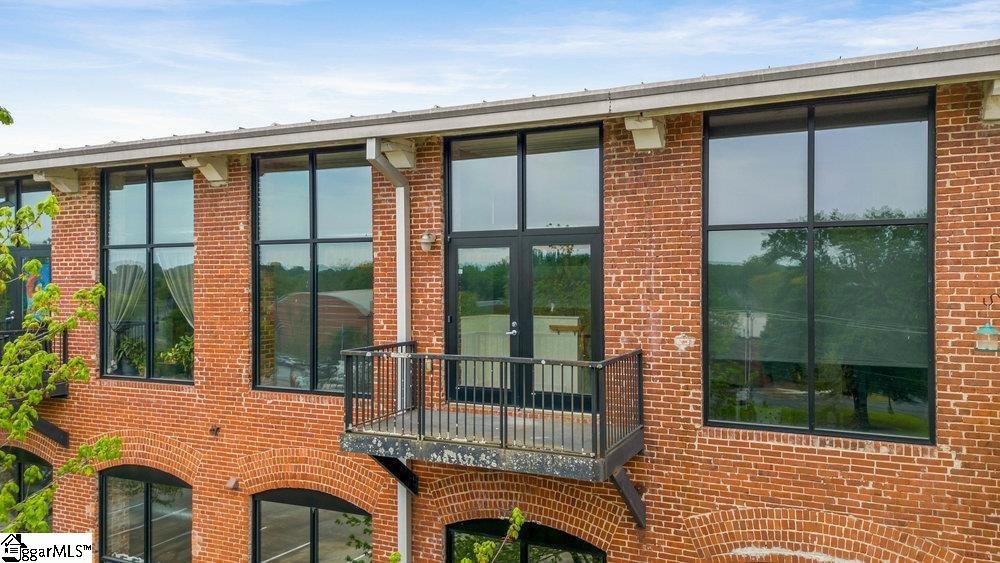
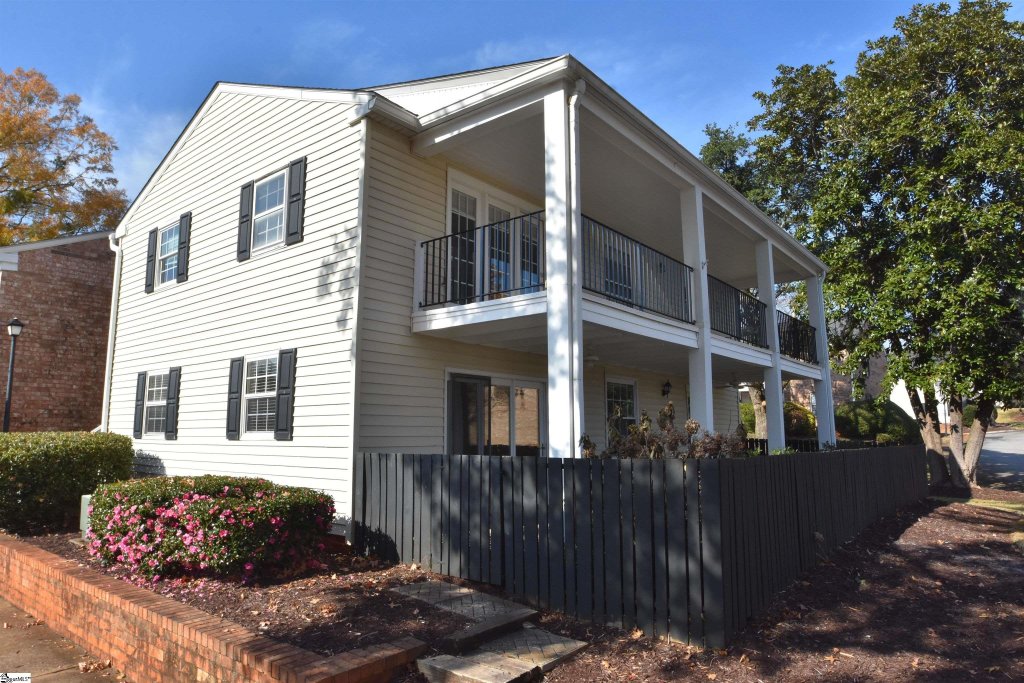
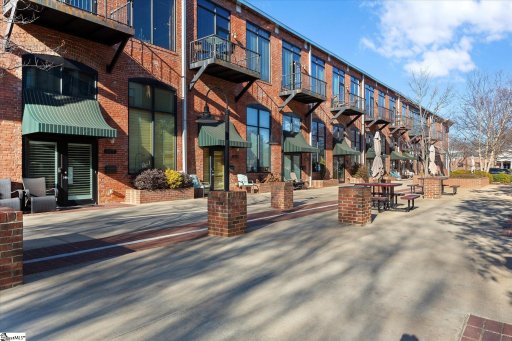
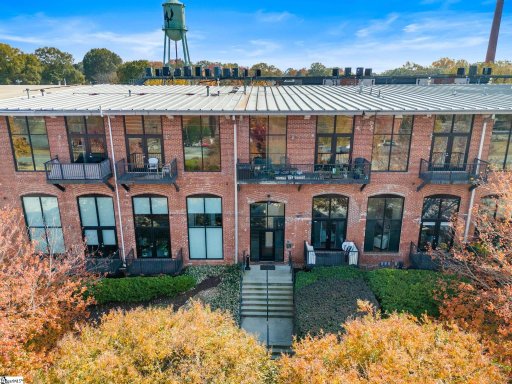
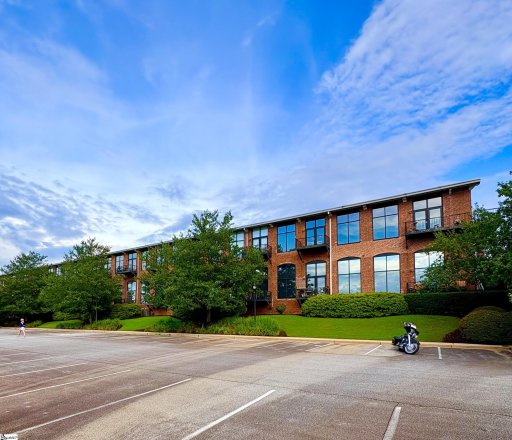
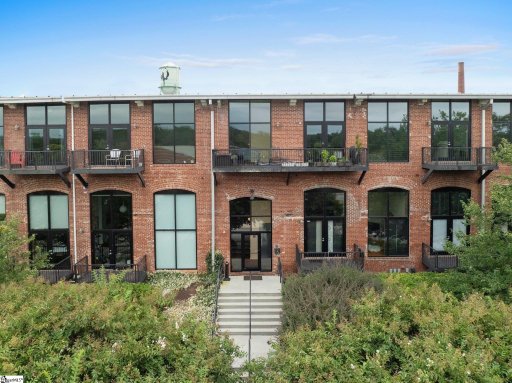
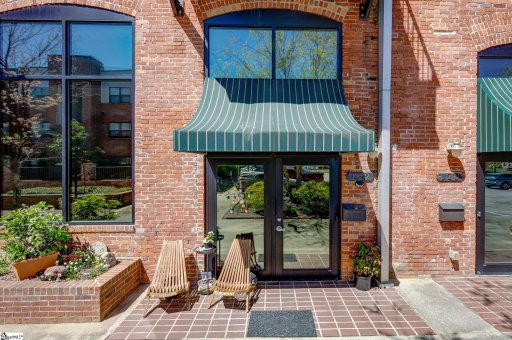
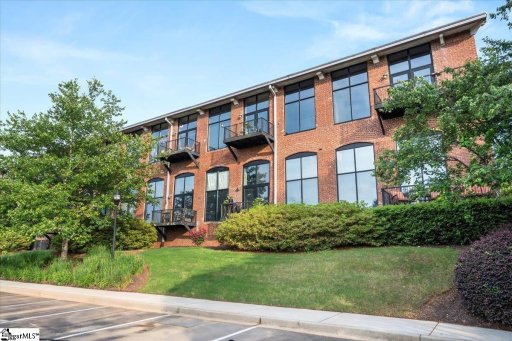
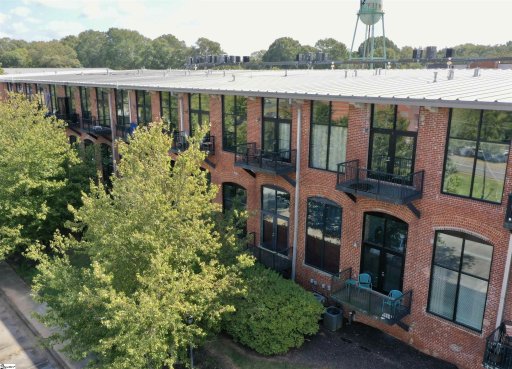
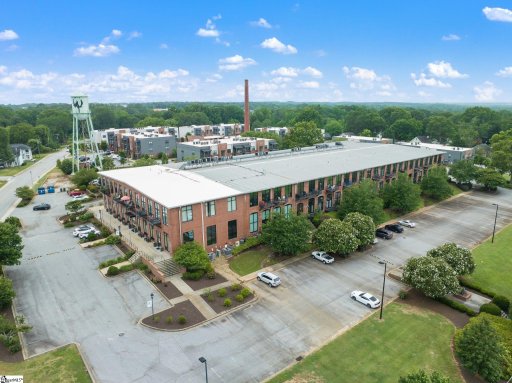
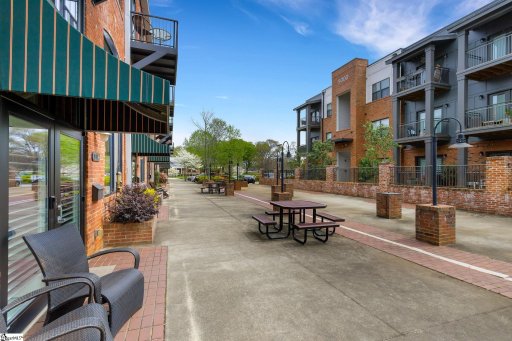
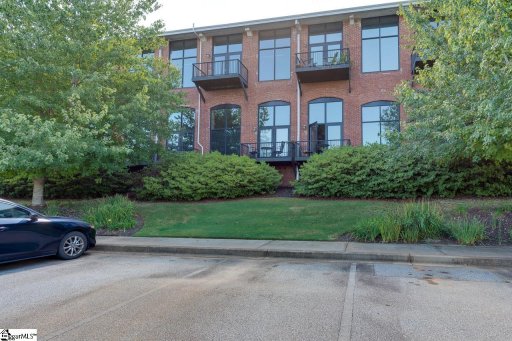
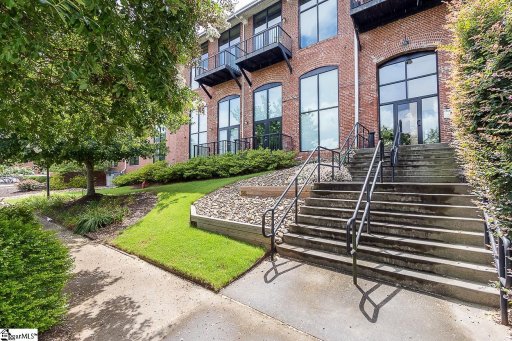
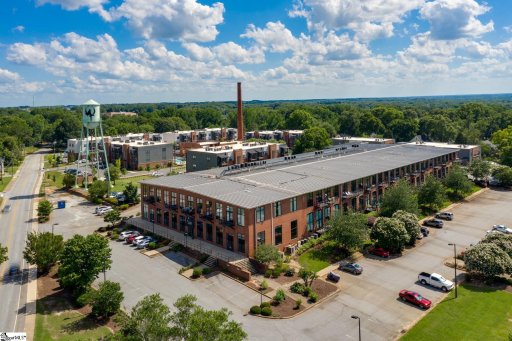
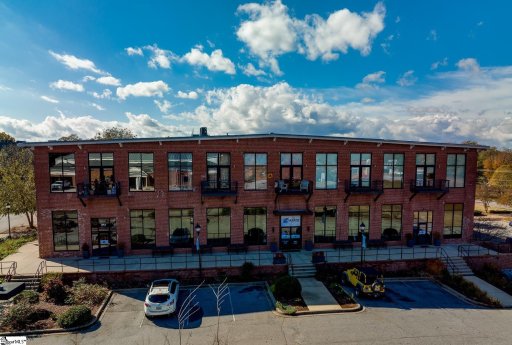
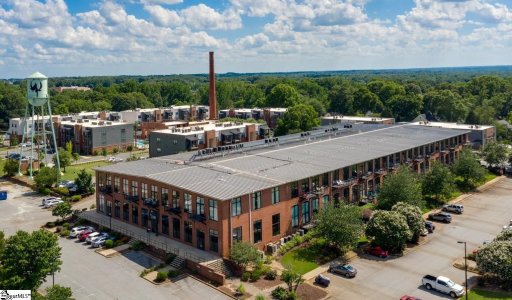
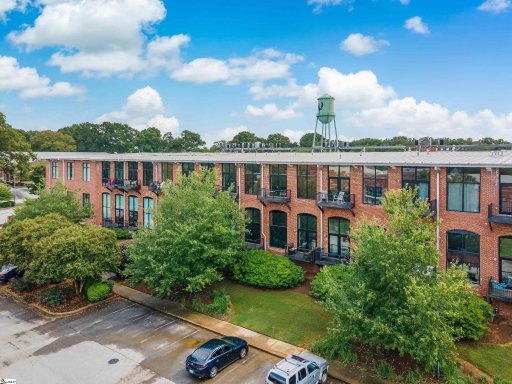
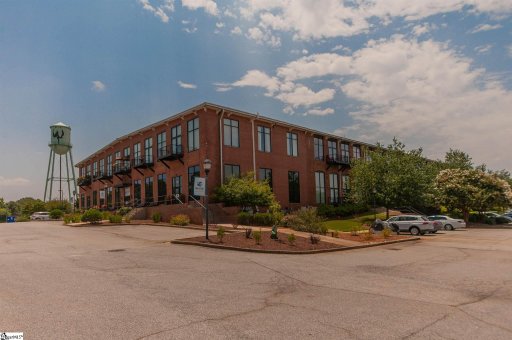
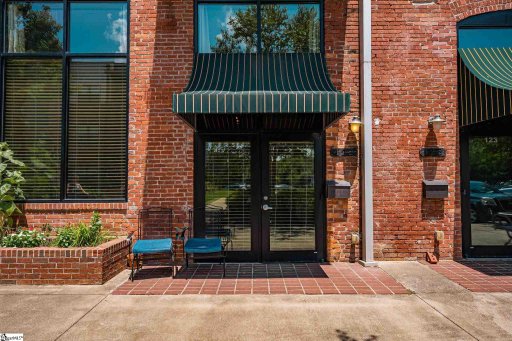
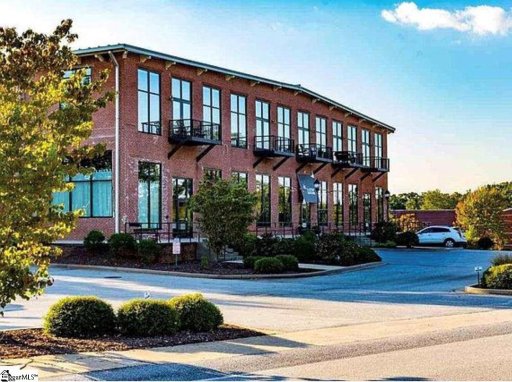
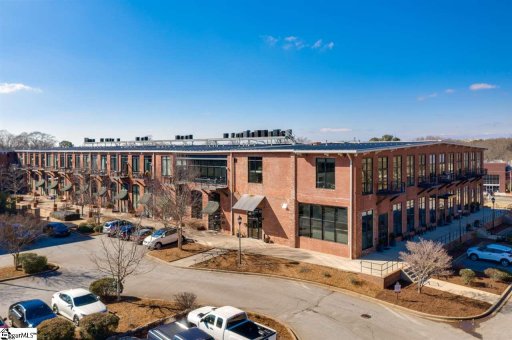
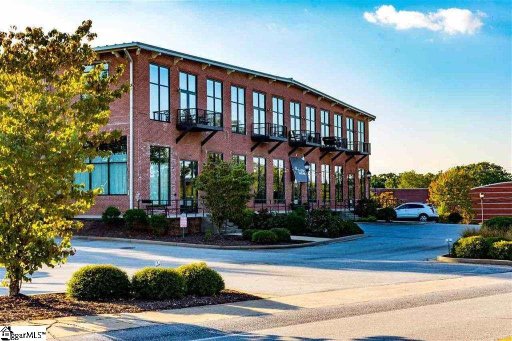
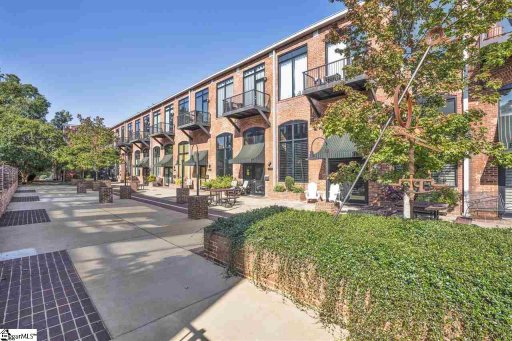
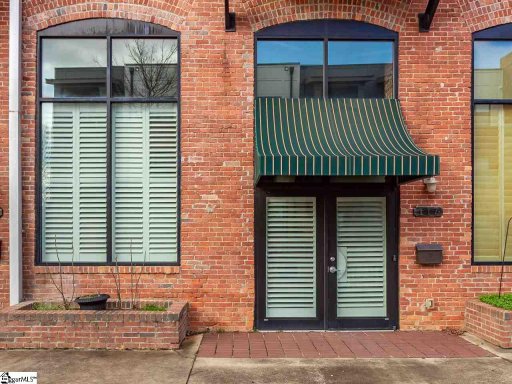
Cotton Mill Place is one of Simpsonville’s most distinctive addresses, set inside the restored Woodside Cotton Mill and anchored right in the heart of downtown. The setting feels unmistakably urban for the Upstate: brick, timber, tall windows, and a streetscape that puts Main Street just a short walk away. The community’s historic landmark status gives it an identity that newer construction simply cannot duplicate, and that sense of place is what residents tend to notice first.
Home Styles & Community Feel
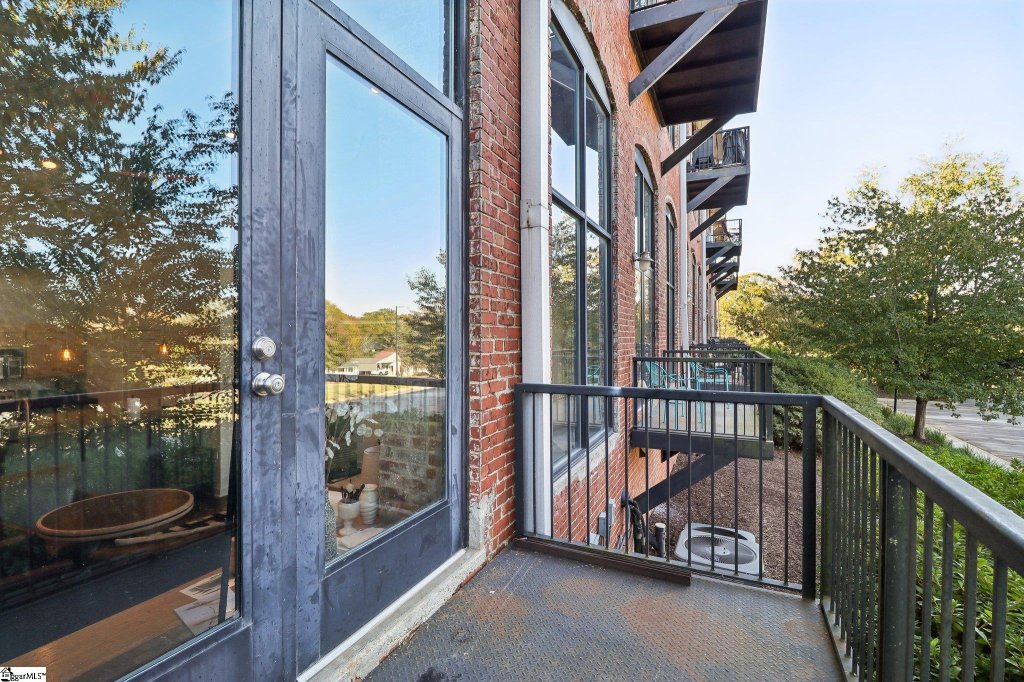
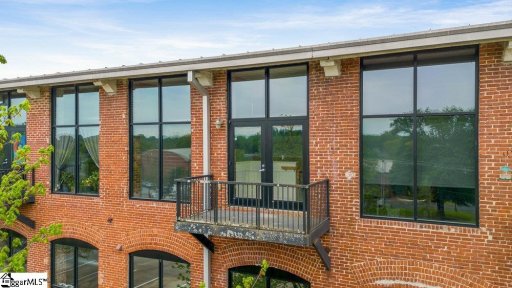
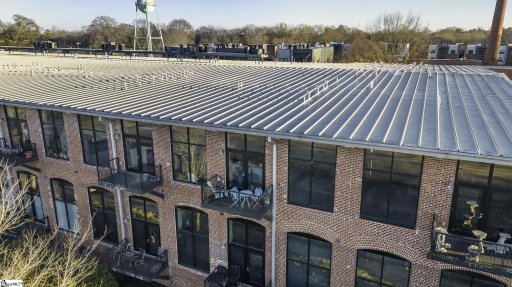
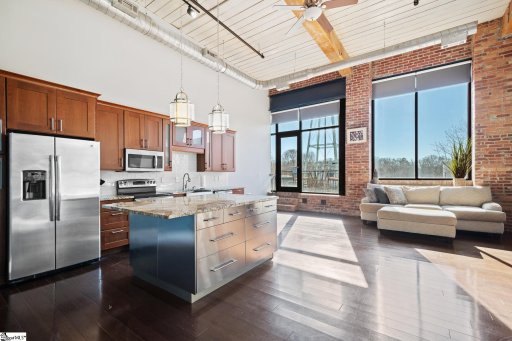
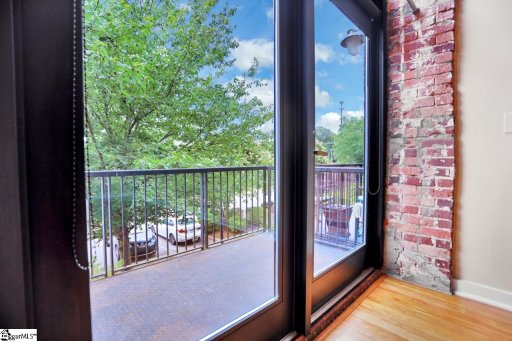
These are loft-style condominiums with a true industrial character. Soaring 15- to 17-foot ceilings, exposed brick, original hardwood floors, wooden beams, and visible ductwork create a layered, architectural look that is both bold and inviting. Many homes also feature floor-to-ceiling windows, spiral staircases, mezzanines, balconies, and open-concept layouts that make the most of the building’s volume and light. Recent updates commonly include quartz or granite counters, stainless steel appliances, refreshed baths, and updated lighting, so the historic shell is often paired with a polished interior finish. A notable advantage here is the extra climate-controlled storage, with many units offering a separate room just outside the door—an uncommon bonus in condo living.
These insights are based on listing details and are informational only; verify details for any specific property.
Market Trends
Buyers have more negotiating power. Properties may take longer to sell. Prices have increased 50%.
Year-over-Year Comparison
Last 12 months

Recently Sold Properties
| Property | Sold Date▼ | Sale Price↕ | DOM↕ | LP/SP↕ | Size↕ | $/SF↕ |
|---|---|---|---|---|---|---|
 SOLD 300 South Street Unit 221 1 bed2 bath | Apr 13 2026 | $310,000 | 44 | 99% | 1479 sq ft | $210 |
 SOLD 300 South Street Unit 203 2 bed2 bath | Feb 25 2026 | $315,000 | 107 | 96% | 1336 sq ft | $236 |
 SOLD 300 South Street Unit 105 1 bed1 bath | Feb 13 2026 | $225,000 | 35 | 🎯100% | 1047 sq ft | $215 |
3 month gap in market activity | ||||||
 SOLD 300 South Street #224 2 bed2 bath | Oct 23 2025 | $270,000 | 17 | 96% | 1400 sq ft | $193 |
 SOLD 300 South Street #202 2 bed1 bath | Sep 25 2025 | $206,000 | 72 | 96% | 868 sq ft | $237 |
8 month gap in market activity | ||||||
 SOLD 300 South Street Unit 106 2 bed2 bath | Jan 3 2025 | $272,500 | 70 | 94% | 1036 sq ft | $263 |
 SOLD 300 South Street Unit 233 1 bed1 bath | Nov 22 2024 | $221,500 | 57 | 98% | 752 sq ft | $295 |
4 month gap in market activity | ||||||
 SOLD 300 South Street Unit 208 3 bed3 bath | Jul 8 2024 | $250,000 | 81 | 93% | 1200 sq ft | $208 |
 SOLD 300 South Street Unit 122 1 bed1 bath | Jun 14 2024 | $262,000 | 76 | 98% | 1393 sq ft | $188 |
 SOLD 300 South Street Unit 227 1 bed2 bath | Jun 5 2024 | $315,000 | 27 | 95% | 1650 sq ft | $191 |
6 month gap in market activity | ||||||
 SOLD 300 South Street Unit 106 2 bed2 bath | Nov 10 2023 | $243,500 | 36 | 97% | 1100 sq ft | $221 |
2 month gap in market activity | ||||||
 SOLD 300 South Street Unit 103 1 bed1 bath | Aug 25 2023 | $199,900 | 31 | 🎯100% | 1100 sq ft | $182 |
3 month gap in market activity | ||||||
 SOLD 300 South Street Unit 117 2 bed2 bath | Apr 28 2023 | $305,000 | 26 | 🎯102% | 1715 sq ft | $178 |
 SOLD 300 South Street #209 2 bed1 bath | Mar 3 2023 | $250,000 | 63 | 97% | 1240 sq ft | $202 |
2 month gap in market activity | ||||||
 SOLD 300 South Street #226 2 bed2 bath | Dec 9 2022 | $307,000 | 14 | 96% | 1639 sq ft | $187 |
 SOLD 300 South Street Unit 203 2 bed2 bath | Oct 19 2022 | $270,000 | 26 | 🎯104% | 1320 sq ft | $205 |
2 month gap in market activity | ||||||
 SOLD 300 South Street 1 bed1 bath | Aug 16 2022 | $125,000 | 19 | 🎯100% | 434 sq ft | $288 |
4 month gap in market activity | ||||||
 SOLD 300 South Street Unit 102 1 bed1 bath | Mar 28 2022 | $184,500 | 32 | 🎯100% | 682 sq ft | $271 |
2 month gap in market activity | ||||||
 SOLD 300 South Street 1 bed1 bath | Jan 20 2022 | $170,000 | 64 | 🎯103% | 890 sq ft | $191 |
 SOLD 300 South Street Unit# 104 1 bed1 bath | Dec 20 2021 | $200,000 | 23 | 🎯105% | 638 sq ft | $313 |
 SOLD 300 South Street Unit #212 1 bed1 bath | Nov 29 2021 | $199,000 | 23 | 🎯100% | 1095 sq ft | $182 |
 SOLD 300 South Street Unit #204 3 bed3 bath | Nov 10 2021 | $260,000 | 33 | 🎯111% | 1433 sq ft | $181 |
2 month gap in market activity | ||||||
 SOLD 300 South Street Suite 102 1 bed1 bath | Sep 7 2021 | $159,000 | 35 | 🎯100% | 638 sq ft | $249 |
 SOLD 300 South Street Unit 122 1 bed1 bath | Aug 31 2021 | $195,000 | 55 | 🎯100% | 1405 sq ft | $139 |
 SOLD 300 South Street Unit 215 2 bed2 bath | Jul 30 2021 | $220,000 | 52 | 98% | 1700 sq ft | $129 |
 SOLD 300 South Street Unit 103 1 bed1 bath | Jul 15 2021 | $153,000 | 38 | 🎯106% | 868 sq ft | $176 |
3 month gap in market activity | ||||||
 SOLD 300 South Street Unit 222 2 bed2 bath | Mar 29 2021 | $200,000 | 39 | 🎯100% | 1532 sq ft | $131 |
 SOLD 300 South Street Unit 215 2 bed2 bath | Mar 26 2021 | $220,000 | 30 | 🎯102% | 1716 sq ft | $128 |
4 month gap in market activity | ||||||
 SOLD 300 South Street 213 2 bed2 bath | Nov 20 2020 | $190,000 | 42 | 97% | 1700 sq ft | $112 |
8 month gap in market activity | ||||||
 SOLD 300 South Street 117 1 bed1 bath | Mar 13 2020 | $172,900 | 56 | 96% | 1272 sq ft | $136 |
300 South Street Unit 221
$310,000
300 South Street Unit 203
$315,000
300 South Street Unit 105
$225,000
300 South Street #224
$270,000
300 South Street #202
$206,000
300 South Street Unit 106
$272,500
300 South Street Unit 233
$221,500
300 South Street Unit 208
$250,000
300 South Street Unit 122
$262,000
300 South Street Unit 227
$315,000
300 South Street Unit 106
$243,500
300 South Street Unit 103
$199,900
300 South Street Unit 117
$305,000
300 South Street #209
$250,000
300 South Street #226
$307,000
300 South Street Unit 203
$270,000
300 South Street
$125,000
300 South Street Unit 102
$184,500
300 South Street
$170,000
300 South Street Unit# 104
$200,000
300 South Street Unit #212
$199,000
300 South Street Unit #204
$260,000
300 South Street Suite 102
$159,000
300 South Street Unit 122
$195,000
300 South Street Unit 215
$220,000
300 South Street Unit 103
$153,000
300 South Street Unit 222
$200,000
300 South Street Unit 215
$220,000
300 South Street 213
$190,000
300 South Street 117
$172,900
Market Statistics
The Cotton Mill Place real estate market shows buyer's market conditions. Homes typically sell within 76 days. With 4 active listings and 5 homes sold in the past year, Buyers have more negotiating power and time to decide.
Pricing
Median Price:$319,950
Average Price:$325,975
Property Details
Avg Bedrooms:1.4
Avg Bathrooms:1.5
Avg Lot Size:0.03 acres
Market Activity
Active Listings:4
Sold Last Year:5
Median Days to Sell:76 days
Community Info
Median Year Built:2007
New Construction:0%
Recently Off Market Properties
6 propertiesLooking for similar properties?
These properties are no longer available, but we can help you find similar homes in Cotton Mill Place. Our agents have access to upcoming listings and can notify you when new properties become available.