Active
$600,000 $276/sqft
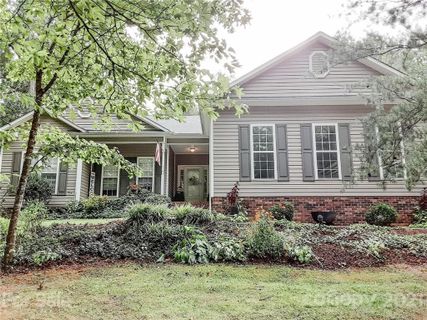
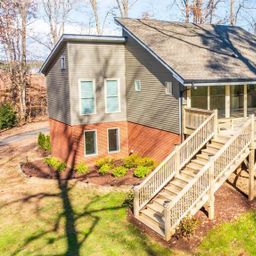
2106 Lynmore Drive
Sherrills Ford, NC 28673
3 bd · 2 ba · 2,171 sqft · 2.4 ac · 1982 · 8 mo ago
Fireplace Garage
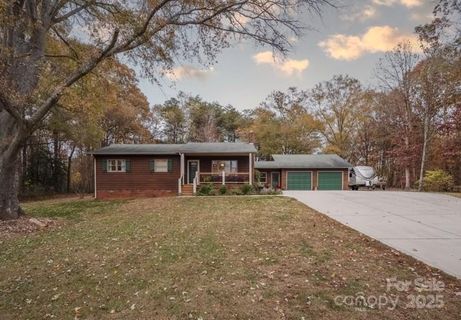
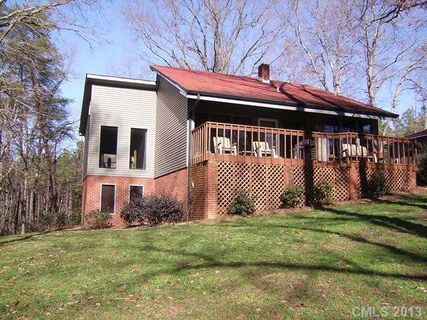
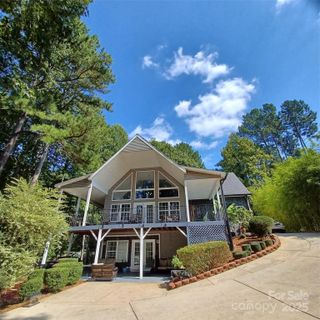
Lynmore in Sherrills Ford is a small, lot-forward single-family pocket where acreage, garages, and outdoor space carry the profile.
Community overview based on MLS listing data for Lynmore, Sherrills Ford
Lynmore in Sherrills Ford is a small, lot-forward single-family pocket where acreage, garages, and outdoor space carry the profile. Homes here run from 1982 to 2004, and the active pricing sits in the upper-middle tier, with asks from $480,000 to $650,000 and a median and average both at $565,000. That combination points to a neighborhood where usable land and flexible space matter as much as interior finish.
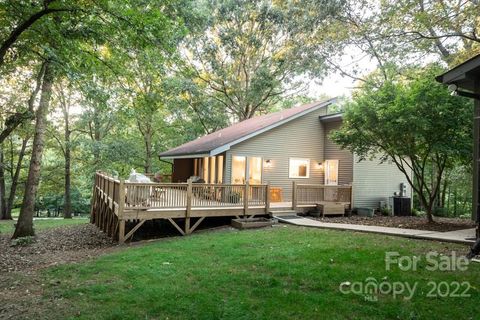
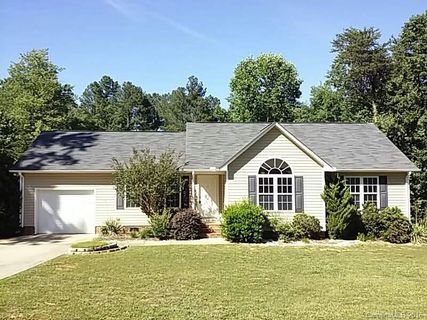
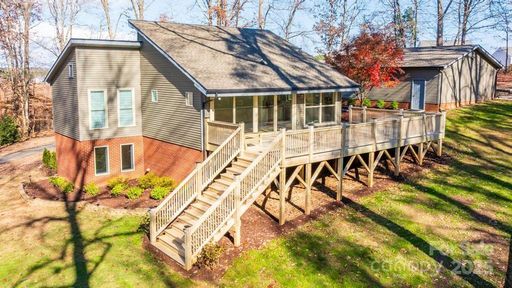
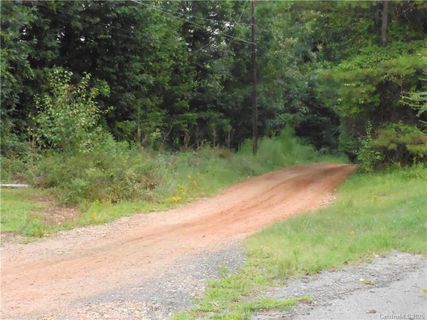
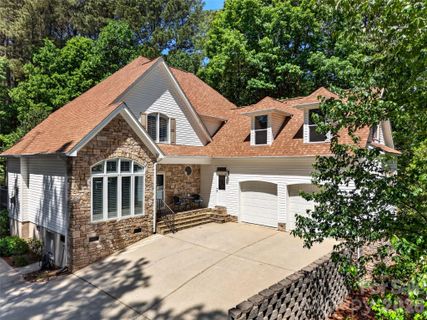
The clearest signature is the way these homes are set up for storage, work, and parking. One active listing features a 24-by-40 attached garage with more than 950 square feet of insulated space, a storage room, and RV hookup. Another is arranged around 2.35 acres, two parcels, a detached garage, a shed, and a newly built deck. Across the neighborhood, detached garages, carports, utility buildings, and extra parking are routine, and several homes are marketed with no HOA.
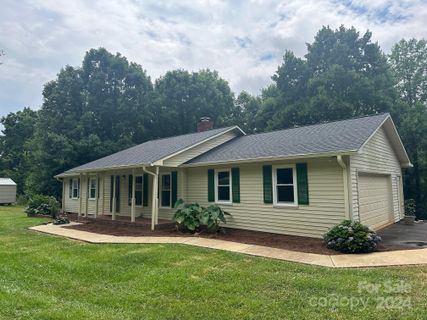
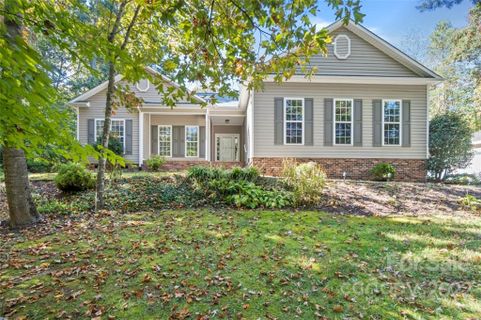
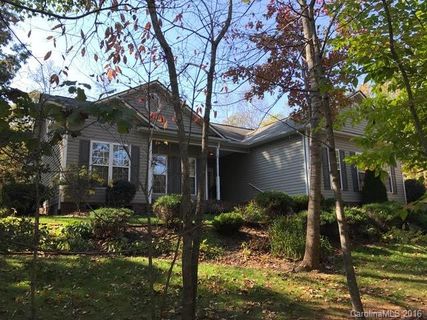
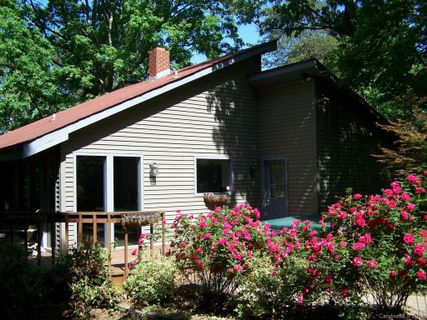
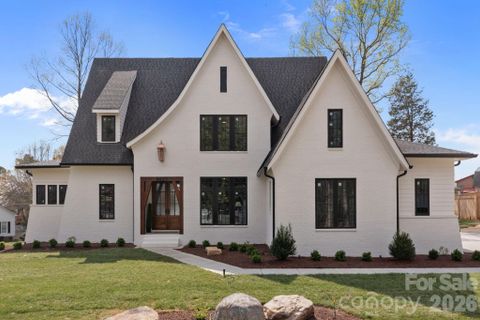
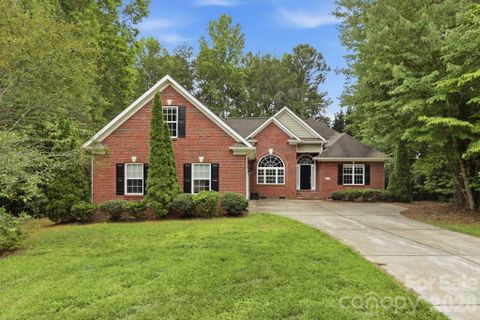
Interior plans are practical and often updated. Ranch and contemporary styles lead the mix, with vaulted ceilings, open great rooms, wall-to-wall windows, updated kitchens, and lower-level flex rooms appearing again and again. Sunrooms, sitting rooms, media rooms, and workshop areas expand the usable square footage, while newer roofs, HVAC systems, and refreshed finishes show up on multiple homes. Outdoor living is part of the package too, with covered porches, decks, patios, grilling areas, fenced yards, hot tubs, and room for boats or other recreational equipment.
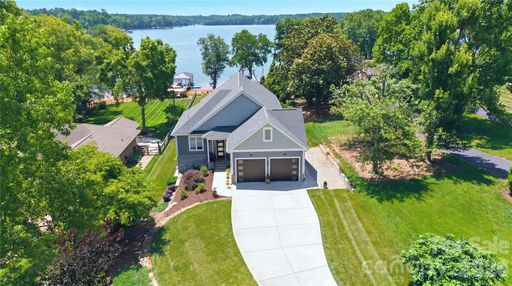
Lynmore sits close to the Village of Sherrills Ford retail corridor, the new Publix, Highway 16, and Lake Norman access, with Mooresville also called out as a nearby drive. School assignments in the community table point to Sherrills Ford Elementary, Mill Creek Middle, and Bandys High. The result is a straightforward Sherrills Ford neighborhood: larger lots, useful outbuildings, and homes that have been adapted over time for everyday life rather than shared-amenity living.
Palmetto Park Realty Team · Sherrills Ford
Ask about Lynmore — we answer fast
See what it's worth — your home's own sale history plus recent Lynmore sales, free.
What's my home worth?Communities similar to Lynmore
 4.0 mi
 Colony Harbor, Sherrills Ford
2 active · $1,074,450
 3.9 mi
 Mountain Creek, Sherrills Ford
2 active · $299,500
 2.7 mi
 The Retreat, Sherrills Ford
2 active · $814,950
 3.5 mi
 Island Point, Sherrills Ford
3 active · $634,900
 3.7 mi
 Somerset On Lake Norman, Terrell
2 active · $592,450
 3.2 mi
 Dockside, Sherrills Ford
2 active · $481,950
9 recently sold in Lynmore, Sherrills Ford
| Property | Sold | Sold Price | Days on Market | Size | Sold to Ask | Sold $/SF |
|---|---|---|---|---|---|---|
| | Jul 15 2026 | $425,000 | 223 | 2,068 sq ft | 94.4% | $206 |
| | Sep 30 2024 | $349,000 | 91 | 1,491 sq ft | 100.0% | $234 |
| | Dec 16 2022 | $400,000 | 56 | 1,678 sq ft | 97.8% | $238 |
| | Nov 17 2022 | $350,000 | 40 | 1,719 sq ft | 95.9% | $204 |
| | Nov 17 2021 | $366,900 | 54 | 1,673 sq ft | 102.2% | $219 |
| | Jan 3 2017 | $239,000 | 81 | 1,673 sq ft | 100.8% | $143 |
| | Sep 14 2016 | $129,507 | 78 | 1,310 sq ft | 100.0% | $99 |
| | Jun 19 2015 | $175,000 | 402 | 1,719 sq ft | 100.0% | $102 |
| | Feb 28 2013 | $173,500 | 43 | 1,851 sq ft | 99.1% | $94 |
Closed sales from MLS history for Lynmore, Sherrills Ford
Below trend-line threshold — city median shown for context
The Lynmore real estate market shows buyer's market conditions. Homes typically sell within 78 days. With 1 active listing and 1 home sold in the past year, buyers have more negotiating power and time to decide.
Free account needed — create one to continue viewing homes.
Members see everything — free👋 Still browsing Lynmore?
Full photos, price history, and every active & pending home in Lynmore with a free account.
Palmetto Park Realty Team
 $600K
$600KCheck your messages
We sent a code to .
Verify your number and we'll text you price drops and new Lynmore listings. 1–2 texts a month, stop anytime.
Enjoy full access to this home and every home on Palmetto Park.