Fair conditions for both buyers and sellers. Room for negotiation.
| Property | Sold Date▼ | Sale Price↕ | DOM↕ | LP/SP↕ | Size↕ | $/SF↕ |
|---|---|---|---|---|---|---|
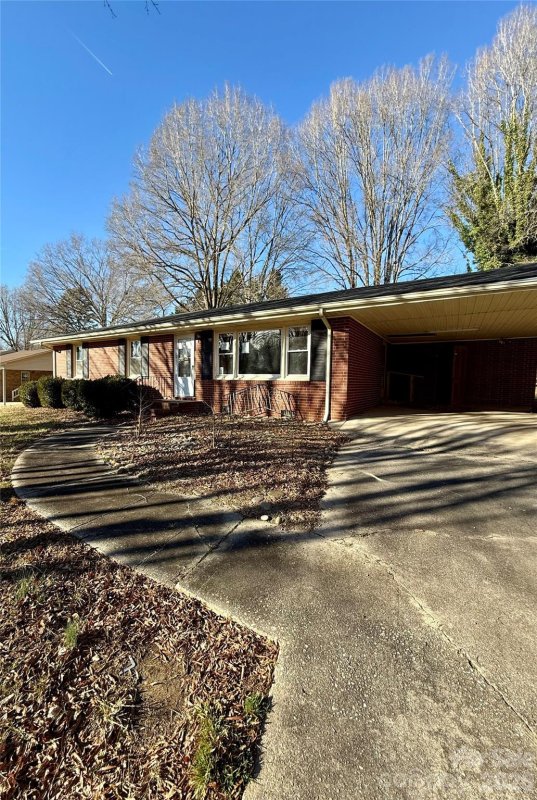
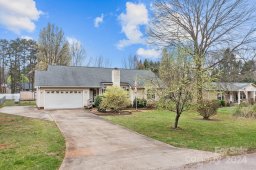
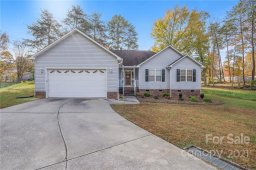
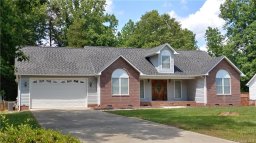
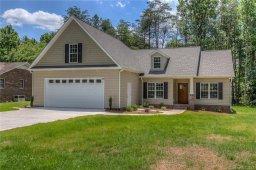
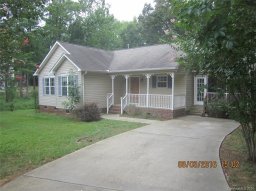
 SOLD 614 W Peeler Street 3 bed2 bath | Jul 30 2025 | $290,000 | 33 | 🎯100% | 1633 sq ft | $178 |
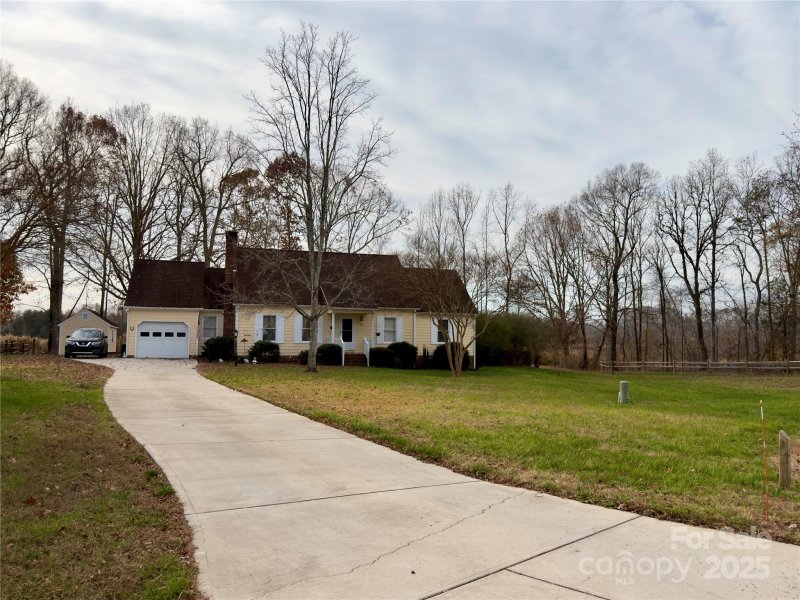
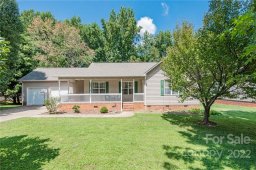
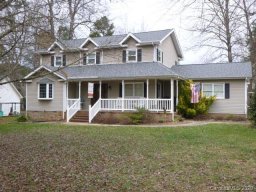
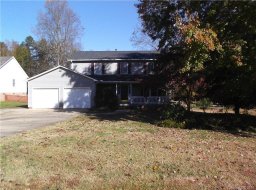
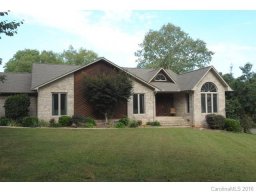
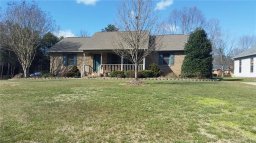
 SOLD 709 Weldon Lane 3 bed2 bath | Jul 21 2025 | $370,000 | 80 | 99% | 1784 sq ft | $207 |
6 month gap in market activity | ||||||
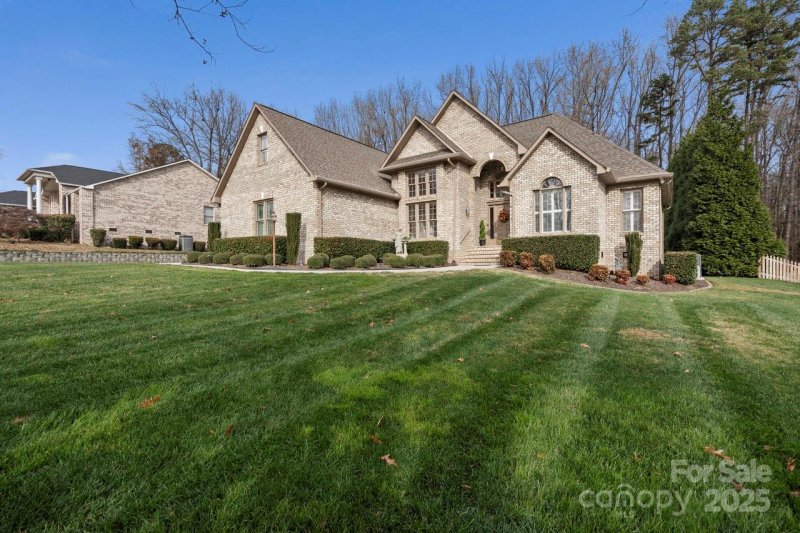
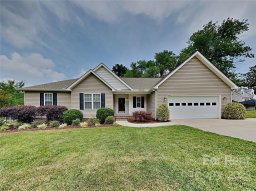
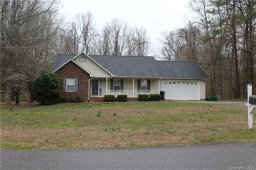
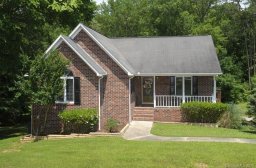
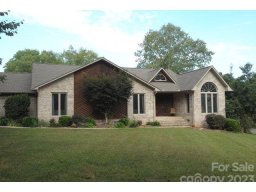
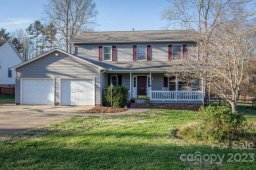
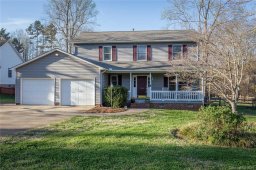
 SOLD 717 Campbell Avenue 3 bed2 bath | Jan 2 2025 | $265,000 | 48 | 99% | 1427 sq ft | $186 |
8 month gap in market activity | ||||||
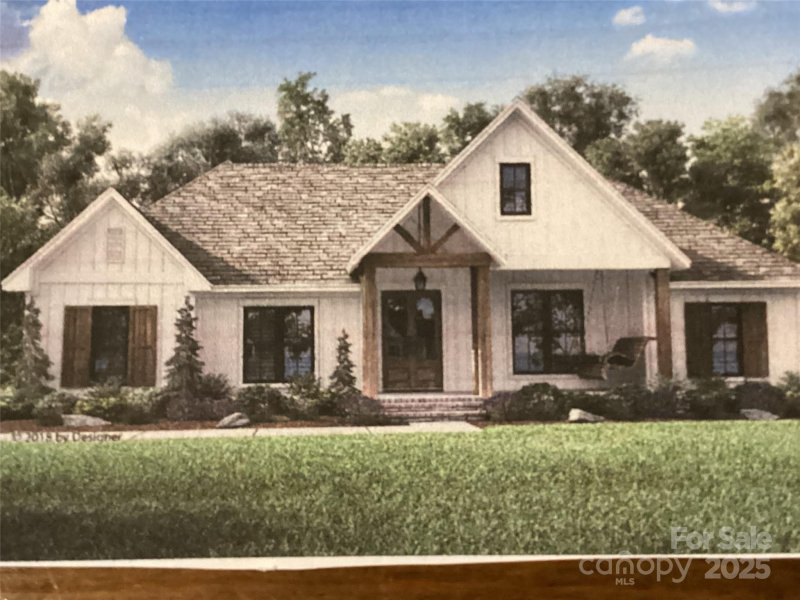
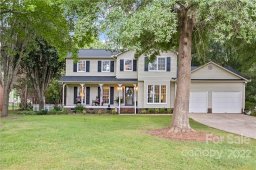
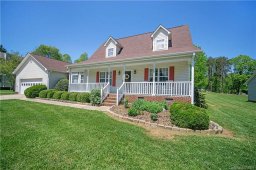
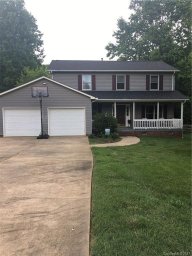
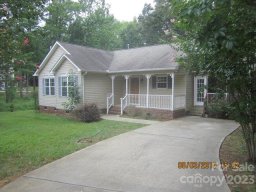
 SOLD 705 W Campbell Avenue 3 bed2 bath | May 3 2024 | $285,000 | 39 | 🎯102% | 1672 sq ft | $170 |
1+ year gap in market activity | ||||||
 SOLD 722 W Campbell Avenue 3 bed2 bath | Sep 30 2022 | $305,000 | 30 | 🎯102% | 1526 sq ft | $200 |
 SOLD 520 Peeler Street 3 bed2 bath | Sep 8 2022 | $1,915 | 21 | 🎯100% | 1540 sq ft | $1 |
 SOLD 717 Weldon Lane 3 bed2 bath | Aug 23 2022 | $350,000 | 45 | 🎯100% | 1818 sq ft | $193 |
7 month gap in market activity | ||||||
 SOLD 605 Campbell Avenue 3 bed2 bath | Jan 7 2022 | $268,000 | 56 | 🎯105% | 1590 sq ft | $169 |
10 month gap in market activity | ||||||
 SOLD 714 Foil Street 3 bed2 bath | Mar 11 2021 | $270,000 | 64 | 98% | 2390 sq ft | $113 |
11 month gap in market activity | ||||||
 SOLD 510 Garland Drive 3 bed2 bath | Mar 20 2020 | $194,500 | 26 | 🎯100% | 1725 sq ft | $113 |
8 month gap in market activity | ||||||
 SOLD 606 Peeler Street 3 bed2 bath | Jul 15 2019 | $190,900 | 70 | 🎯103% | 1853 sq ft | $103 |
 SOLD 710 Foil Street 3 bed2 bath | Jun 18 2019 | $193,000 | 29 | 🎯100% | 1868 sq ft | $103 |
 SOLD 702 Foil Street 3 bed2 bath | May 17 2019 | $190,000 | 194 | 🎯103% | 2016 sq ft | $94 |
10 month gap in market activity | ||||||
 SOLD 316 Garland Drive 5 bed3 bath | Jul 20 2018 | $197,000 | 43 | 🎯101% | 2849 sq ft | $69 |
11 month gap in market activity | ||||||
 SOLD 702 Foil Street 3 bed2 bath | Jul 27 2017 | $1,395 | 45 | 🎯100% | 2016 sq ft | $1 |
 SOLD 709 Foil Street 4 bed3 bath | Jun 30 2017 | $245,000 | 52 | 94% | 1977 sq ft | $124 |
7 month gap in market activity | ||||||
 SOLD 411 Garland Place 3 bed2 bath | Nov 29 2016 | $185,000 | 67 | 96% | 1909 sq ft | $97 |
 SOLD 411 Garland Drive 3 bed2 bath | Nov 29 2016 | $185,000 | 67 | 96% | 1909 sq ft | $97 |
 SOLD 608 Campbell Avenue East 3 bed2 bath | Oct 28 2016 | $94,000 | 78 | 94% | 1530 sq ft | $61 |
 SOLD 608 Campbell Avenue 3 bed2 bath | Oct 28 2016 | $94,000 | 78 | 94% | 1530 sq ft | $61 |
5 month gap in market activity | ||||||
 SOLD 618 Peeler Street 3 bed2 bath | May 13 2016 | $155,000 | 77 | 97% | 1573 sq ft | $99 |
 SOLD 702 Foil Street 4 bed3 bath | May 6 2016 | $174,500 | 49 | 97% | 1990 sq ft | $88 |
 SOLD 702 Foil Street 4 bed2 bath | May 6 2016 | $174,500 | 56 | 97% | 1990 sq ft | $88 |
 SOLD 714 W Campbell Avenue 3 bed2 bath | Apr 7 2016 | $136,900 | 47 | 🎯100% | 1500 sq ft | $91 |
 SOLD 714 Campbell Avenue West 3 bed2 bath | Apr 7 2016 | $136,900 | 47 | 🎯100% | 1500 sq ft | $91 |
9 month gap in market activity | ||||||
 SOLD 613 Campbell Avenue 3 bed2 bath | Jun 25 2015 | $135,000 | 41 | 🎯100% | 1620 sq ft | $83 |
 SOLD 706 W Peeler Street 4 bed3 bath | Jun 25 2015 | $298,000 | 62 | 92% | 3794 sq ft | $79 |
 SOLD 706 Peeler Street West 4 bed3 bath | Jun 25 2015 | $298,000 | 62 | 92% | 3790 sq ft | $79 |
 SOLD 618 Peeler Street West 3 bed2 bath | May 28 2015 | $155,000 | 37 | 97% | 1573 sq ft | $99 |
 SOLD 618 Peeler Street 3 bed2 bath | May 28 2015 | $155,000 | 37 | 97% | 1573 sq ft | $99 |
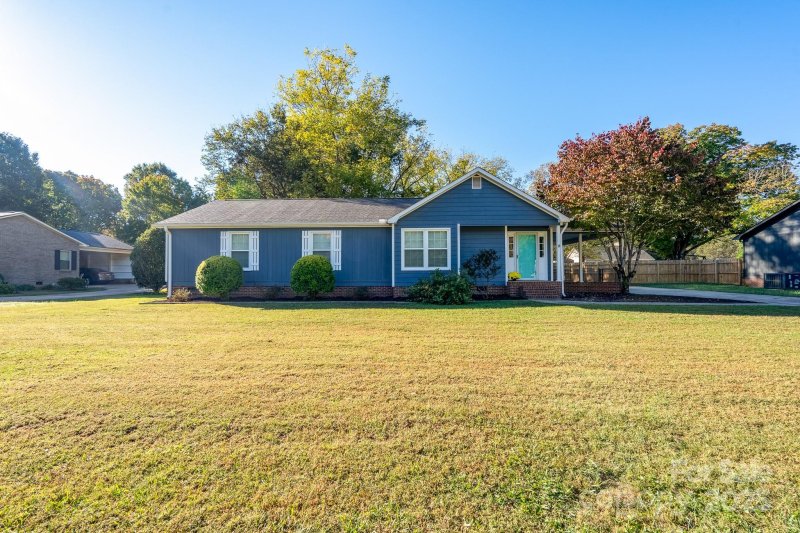
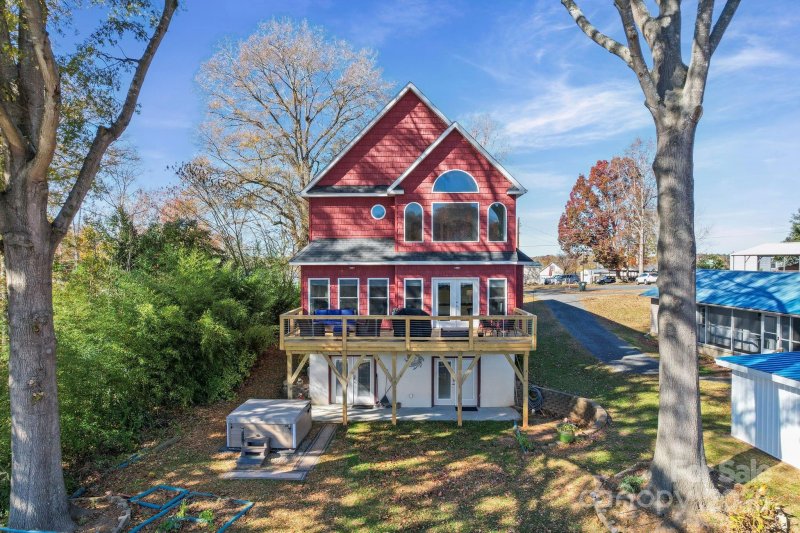
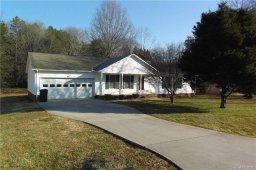
614 W Peeler Street
$290,000
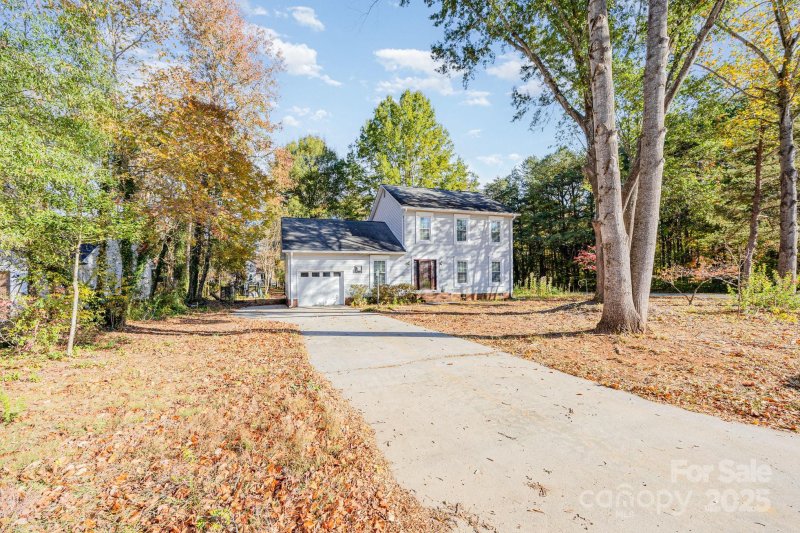
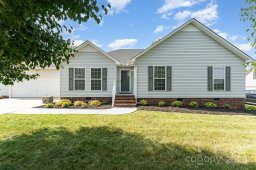
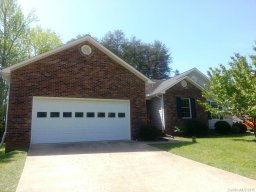
709 Weldon Lane
$370,000
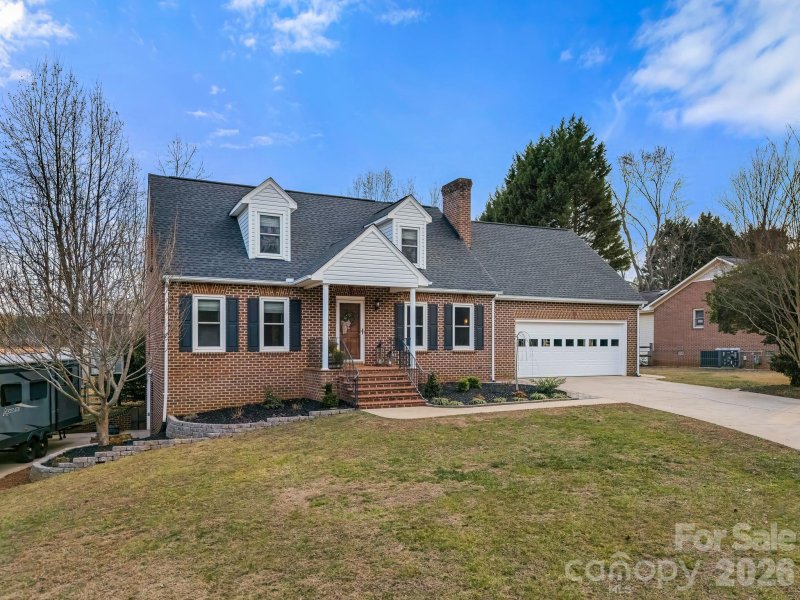
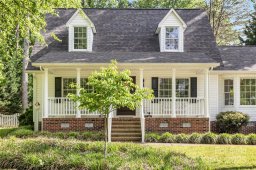
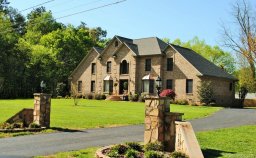
717 Campbell Avenue
$265,000
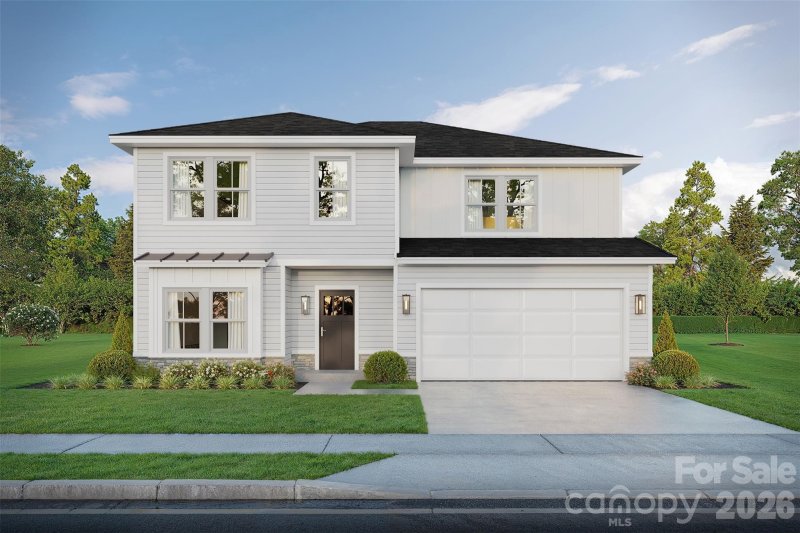
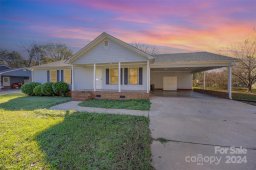
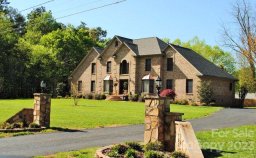
705 W Campbell Avenue
$285,000
722 W Campbell Avenue
$305,000
520 Peeler Street
$1,915
717 Weldon Lane
$350,000
605 Campbell Avenue
$268,000
714 Foil Street
$270,000
510 Garland Drive
$194,500
606 Peeler Street
$190,900
710 Foil Street
$193,000
702 Foil Street
$190,000
316 Garland Drive
$197,000
702 Foil Street
$1,395
709 Foil Street
$245,000
411 Garland Place
$185,000
411 Garland Drive
$185,000
608 Campbell Avenue East
$94,000
608 Campbell Avenue
$94,000
618 Peeler Street
$155,000
702 Foil Street
$174,500
702 Foil Street
$174,500
714 W Campbell Avenue
$136,900
714 Campbell Avenue West
$136,900
613 Campbell Avenue
$135,000
706 W Peeler Street
$298,000
706 Peeler Street West
$298,000
618 Peeler Street West
$155,000
618 Peeler Street
$155,000
The Garland Place real estate market shows buyer's market conditions. Homes typically sell within 3164 days. With 3 active listings and 2 homes sold in the past year, Buyers have more negotiating power and time to decide.
Median Price:$314,900
Average Price:$359,633.34
Avg Bedrooms:3.2
Avg Bathrooms:2.1
Avg Lot Size:0.50 acres
Active Listings:3
Sold Last Year:2
Median Days to Sell:3164 days
Has HOA:No
Median Year Built:1996
New Construction:0%