Buyers have more negotiating power. Properties may take longer to sell. Prices have increased 51%.
| Property | Sold Date▼ | Sale Price↕ | DOM↕ | LP/SP↕ | Size↕ | $/SF↕ |
|---|---|---|---|---|---|---|
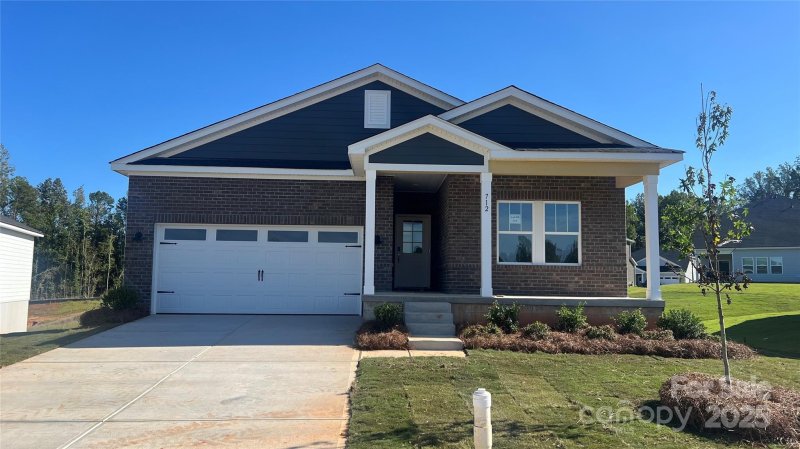
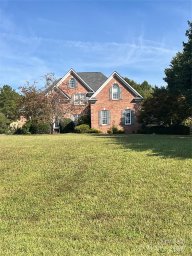
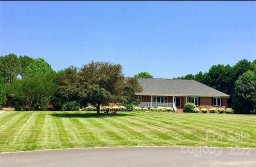
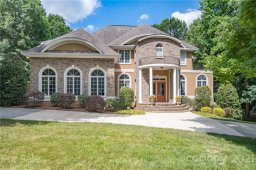
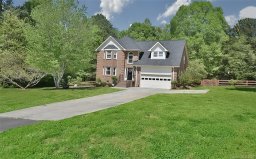
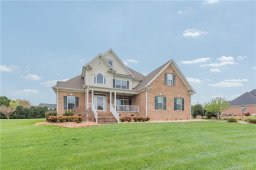
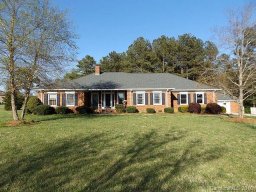
 SOLD 3178 Newcastle Drive 3 bed3 bath | Jan 30 2026 | $665,000 | 178 | 95% | 3025 sq ft | $220 |
3 month gap in market activity | ||||||
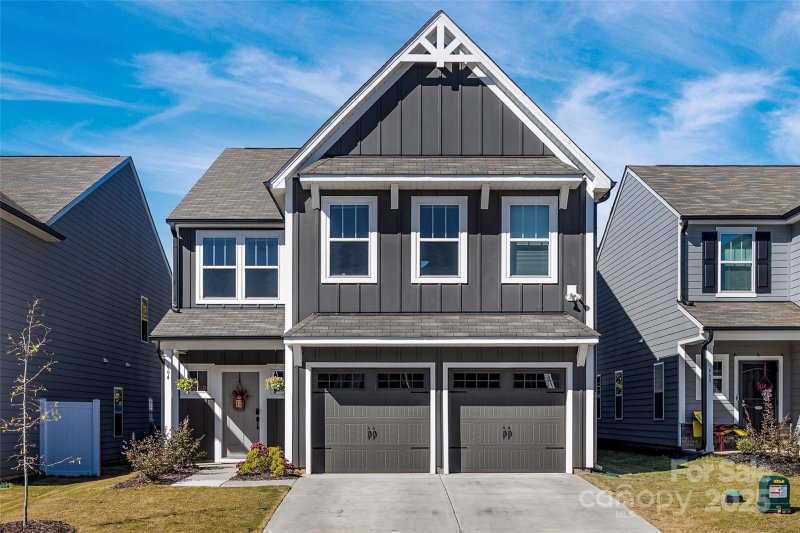
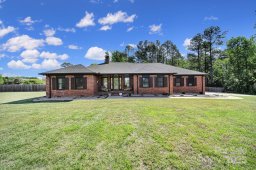
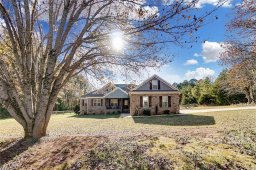
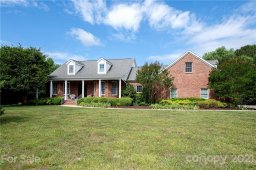
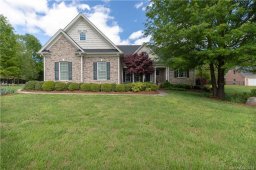
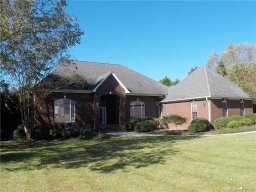
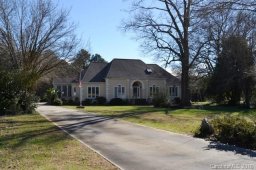
 SOLD 3224 Newcastle Drive 4 bed3 bath | Oct 30 2025 | $440,000 | 37 | 🎯100% | 2305 sq ft | $191 |
4 month gap in market activity | ||||||
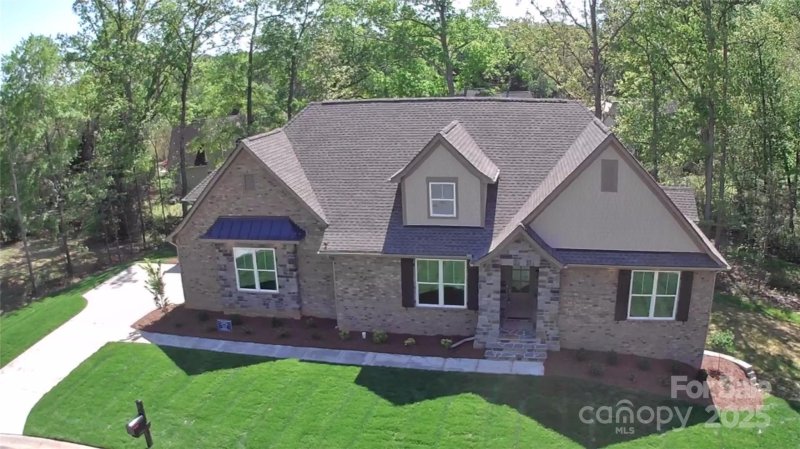
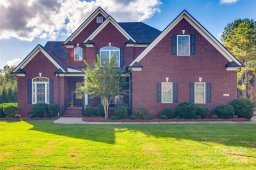
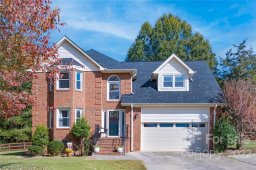
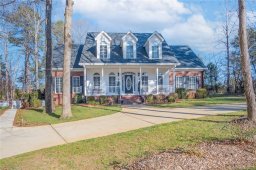
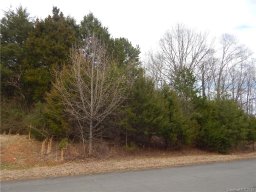
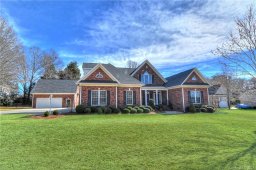
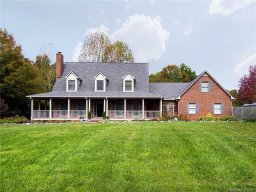
 SOLD 3270 Kings Row Drive 4 bed2 bath | Jun 18 2025 | $660,000 | 40 | 🎯103% | 2789 sq ft | $237 |
6 month gap in market activity | ||||||
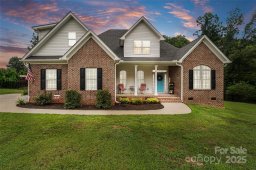
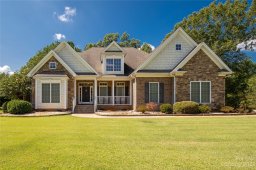
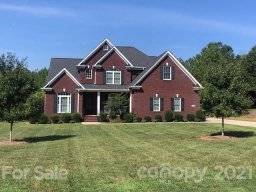
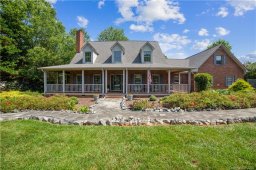
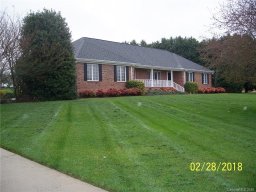
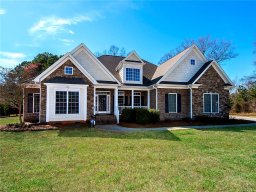
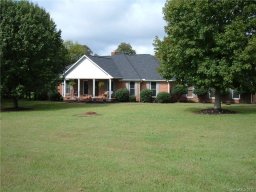
 SOLD 2029 Balmoral Drive 5 bed4 bath | Dec 20 2024 | $787,000 | 50 | 93% | 3790 sq ft | $208 |
1+ year gap in market activity | ||||||
 SOLD 2047 Balmoral Drive 4 bed4 bath | Oct 23 2023 | $625,000 | 33 | 🎯100% | 2822 sq ft | $221 |
8 month gap in market activity | ||||||
 SOLD 3242 Newcastle Drive 3 bed2 bath | Feb 15 2023 | $500,000 | 71 | 94% | 2205 sq ft | $227 |
 SOLD 3149 Newcastle Drive 4 bed2 bath | Dec 22 2022 | $631,000 | 82 | 97% | 3122 sq ft | $202 |
 SOLD 3246 Kings Row Drive 4 bed3 bath | Dec 2 2022 | $550,000 | 32 | 🎯100% | 2914 sq ft | $189 |
1+ year gap in market activity | ||||||
 SOLD 55 Ac Balmoral Drive | Nov 3 2021 | $500,000 | 371 | 83% | — | — |
2 month gap in market activity | ||||||
 SOLD 2029 Balmoral Drive 5 bed3 bath | Aug 27 2021 | $575,000 | 34 | 🎯100% | 3790 sq ft | $152 |
 SOLD 2053 Balmoral Drive 5 bed4 bath | Aug 20 2021 | $695,000 | 50 | 🎯104% | 5215 sq ft | $133 |
 SOLD 970 Oxford Drive 4 bed3 bath | Aug 10 2021 | $460,000 | 55 | 94% | 4902 sq ft | $94 |
4 month gap in market activity | ||||||
 SOLD 2056 Balmoral Drive 5 bed3 bath | Mar 19 2021 | $622,000 | 63 | 🎯102% | 4653 sq ft | $134 |
6 month gap in market activity | ||||||
 SOLD 3218 Newcastle Drive 3 bed2 bath | Aug 31 2020 | $401,000 | 41 | 🎯100% | 2741 sq ft | $146 |
 SOLD 3246 Kings Row Drive 4 bed3 bath | Jul 17 2020 | $394,900 | 93 | 99% | 2926 sq ft | $135 |
8 month gap in market activity | ||||||
 SOLD 2038 Balmoral Drive 4 bed3 bath | Nov 8 2019 | $445,000 | 191 | 99% | 3327 sq ft | $134 |
3 month gap in market activity | ||||||
 SOLD Lot 42 Newcastle Drive | Aug 1 2019 | $41,500 | 167 | 92% | — | — |
1+ year gap in market activity | ||||||
 SOLD 3242 Newcastle Drive 3 bed2 bath | May 25 2018 | $329,000 | 83 | 🎯100% | 2220 sq ft | $148 |
 SOLD 1011 Piccadilly Lane 4 bed3 bath | May 7 2018 | $377,000 | 41 | 🎯101% | 2733 sq ft | $138 |
2 month gap in market activity | ||||||
 SOLD 978 Oxford Drive 4 bed3 bath | Feb 8 2018 | $418,000 | 92 | 97% | 3002 sq ft | $139 |
8 month gap in market activity | ||||||
 SOLD 2044 Balmoral Drive 4 bed3 bath | Jun 2 2017 | $450,000 | 89 | 99% | 3411 sq ft | $132 |
 SOLD 2047 Balmoral Drive 4 bed4 bath | Apr 24 2017 | $400,000 | 52 | 98% | 3172 sq ft | $126 |
8 month gap in market activity | ||||||
 SOLD 3270 Kings Row Drive 4 bed2 bath | Aug 5 2016 | $310,000 | 267 | 98% | 2578 sq ft | $120 |
4 month gap in market activity | ||||||
 SOLD 3291 Kings Row Drive 4 bed3 bath | Mar 30 2016 | $262,000 | 79 | 87% | 3140 sq ft | $83 |
 SOLD Lot A Newcastle Drive | Mar 24 2016 | $40,000 | 314 | 89% | — | — |
 SOLD 2071 Balmoral Drive 3 bed2 bath | Mar 11 2016 | $322,500 | 304 | 93% | 4054 sq ft | $80 |
2 month gap in market activity | ||||||
 SOLD 3218 Newcastle Drive 3 bed2 bath | Jan 8 2016 | $320,000 | 70 | 98% | 2741 sq ft | $117 |
 SOLD 948 Adnah Church Road 4 bed3 bath | Dec 2 2015 | $250,000 | 63 | 96% | 2614 sq ft | $96 |
2 month gap in market activity | ||||||
 SOLD 1314 Adnah Church Road 4 bed3 bath | Sep 17 2015 | $260,000 | 160 | 95% | 3100 sq ft | $84 |
2 month gap in market activity | ||||||
 SOLD 2023 Balmoral Drive 3 bed2 bath | Jul 9 2015 | $387,000 | 62 | 98% | 3165 sq ft | $122 |
3178 Newcastle Drive
$665,000
3224 Newcastle Drive
$440,000
3270 Kings Row Drive
$660,000
2029 Balmoral Drive
$787,000
2047 Balmoral Drive
$625,000
3242 Newcastle Drive
$500,000
3149 Newcastle Drive
$631,000
3246 Kings Row Drive
$550,000
55 Ac Balmoral Drive
$500,000
2029 Balmoral Drive
$575,000
2053 Balmoral Drive
$695,000
970 Oxford Drive
$460,000
2056 Balmoral Drive
$622,000
3218 Newcastle Drive
$401,000
3246 Kings Row Drive
$394,900
2038 Balmoral Drive
$445,000
Lot 42 Newcastle Drive
$41,500
3242 Newcastle Drive
$329,000
1011 Piccadilly Lane
$377,000
978 Oxford Drive
$418,000
2044 Balmoral Drive
$450,000
2047 Balmoral Drive
$400,000
3270 Kings Row Drive
$310,000
3291 Kings Row Drive
$262,000
Lot A Newcastle Drive
$40,000
2071 Balmoral Drive
$322,500
3218 Newcastle Drive
$320,000
948 Adnah Church Road
$250,000
1314 Adnah Church Road
$260,000
2023 Balmoral Drive
$387,000
The Wellington Heights real estate market shows buyer's market conditions. Homes typically sell within 2947 days. With 1 active listings and 3 homes sold in the past year, Buyers have more negotiating power and time to decide.
Median Price:$715,000
Average Price:$715,000
Avg Bedrooms:3.9
Avg Bathrooms:2.8
Avg Lot Size:3.10 acres
Active Listings:1
Sold Last Year:3
Median Days to Sell:2947 days
Has HOA:No
Median Year Built:1998
New Construction:0%