Active
$409,900 $196/sqft
395 Runnymede Drive
Rock Hill, SC 29732
4 bd · 2 ba · 2,088 sqft · 1995 · 2 mo ago
Fireplace Garage
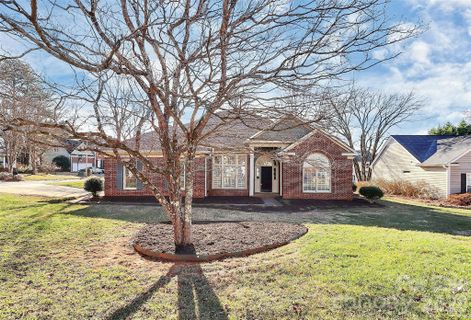
Tysons Forest in Rock Hill has the feel of an established suburban pocket that has grown into itself over time.
Community overview based on MLS listing data for Tysons Forest, Rock Hill
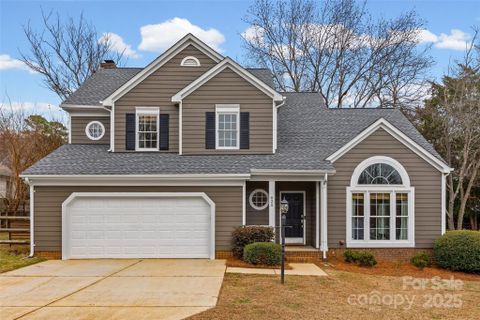
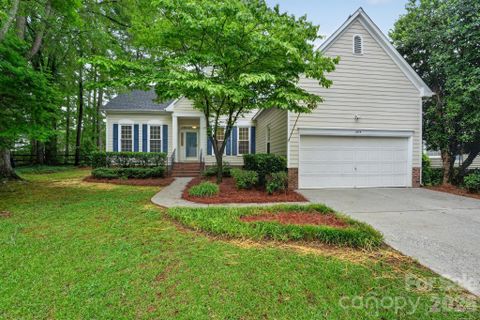
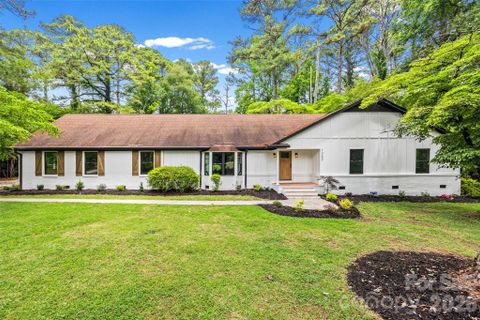
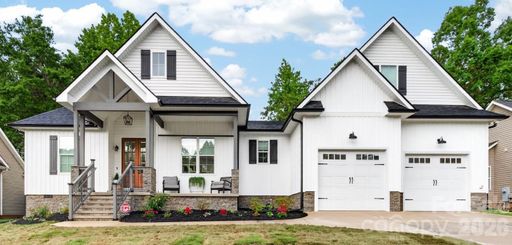
Tysons Forest in Rock Hill has the feel of an established suburban pocket that has grown into itself over time. The streets are lined with mature trees, and many homes sit on wooded or cul-de-sac lots that give the neighborhood a tucked-away character without feeling disconnected from the city. It is the kind of place where front porches, back decks, and shaded yards matter just as much as square footage, and that outdoor setting shows up again and again in the homes here.
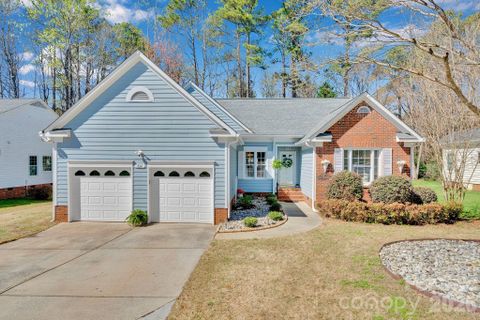
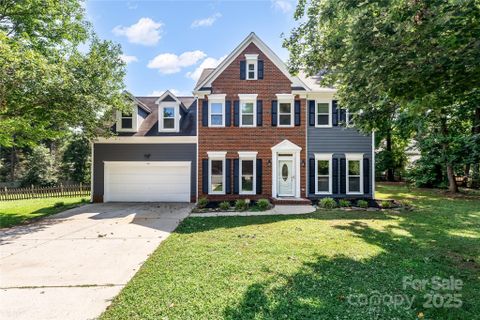
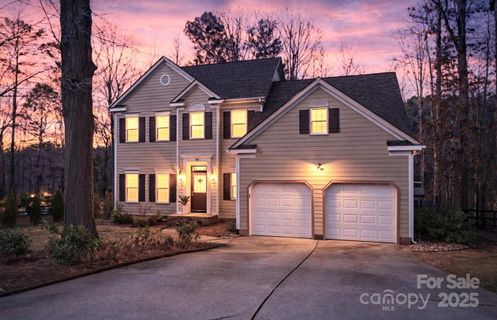
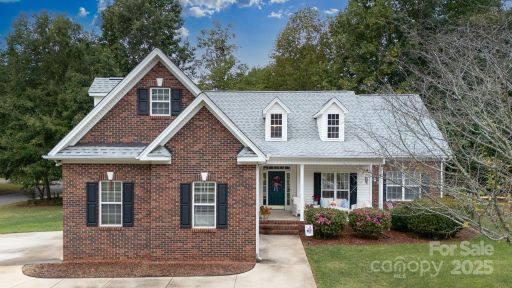
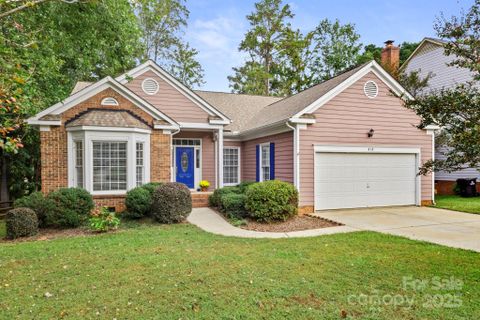
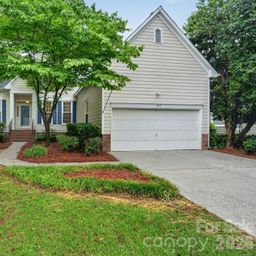
The neighborhood is made up primarily of single-family homes, with most residences built between the early 1990s and the early 2000s. Typical floor plans lean traditional, but the interiors often feel open and updated, with features like vaulted ceilings, arched windows, formal dining rooms, breakfast areas, bonus rooms, and flexible main-level spaces. Many homes feature brick exteriors, and garage parking is a major part of the community’s appeal, with attached two-car garages appearing frequently. Outdoor living is another defining trait: screened porches, decks, fenced yards, patios, and wooded backdrops are common, and several homes have been refreshed with newer roofs, HVAC systems, flooring, and kitchen updates.
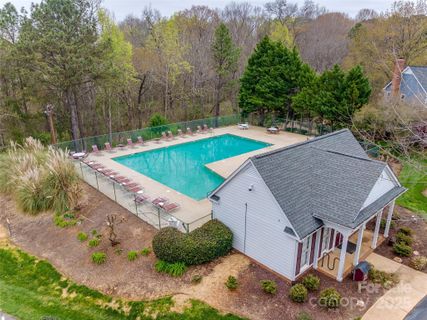
Community amenities add to the everyday rhythm. Residents can enjoy a pool, playground, picnic area, and in some listings a clubhouse or pavilion-style gathering space. That mix gives Tysons Forest a relaxed, amenity-rich setting where the neighborhood itself plays a visible role in daily life.
Tysons Forest has a comfortable, lived-in pace shaped by both the homes and the shared spaces. The pool and playground are recurring highlights, and the picnic and pavilion areas make it easy to imagine casual afternoons close to home. Several properties also emphasize wooded privacy, mature landscaping, and backyard features that extend the living space outdoors. Inside, the homes tend to support both everyday routines and more flexible use, with bonus rooms, offices, lofts, and large laundry areas showing up often. It is a neighborhood that balances practical convenience with a little extra room to spread out.
The community sits in Rock Hill, in the broader York County area of the Charlotte metro’s South Carolina side. Public remarks consistently point to easy access to I-77, along with quick trips to shopping, dining, parks, hospitals, and doctors’ offices. Downtown Rock Hill is also described as being just minutes away, and Winthrop University and Piedmont Medical Center are both mentioned as nearby landmarks. School assignments commonly include Richmond Drive Elementary, Rawlinson Road Middle, and South Pointe High School. That combination of established schools, commuter access, and everyday destinations gives Tysons Forest a well-connected Rock Hill location with a distinctly residential feel.
Palmetto Park Realty Team · Rock Hill
Ask about Tysons Forest — we answer fast
See what it's worth — your home's own sale history plus recent Tysons Forest sales, free.
What's my home worth?Communities similar to Tysons Forest
 0.7 mi
 Wedgewood, Rock Hill
3 active · $575,000
 1.2 mi
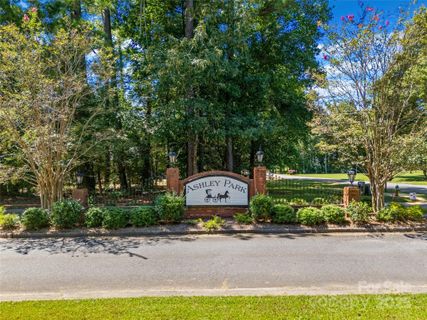
 Ashley Park, Rock Hill
2 active · $252,500
 1.1 mi
 Fewell Estates, Rock Hill
2 active · $432,500
 1.6 mi
 The Crossing, Rock Hill
3 active · $425,000
 1.4 mi
 Meadow Lakes, Rock Hill
6 active · $664,500
 1.4 mi
 Stafford Park, Rock Hill
4 active · $456,450
Showing 1-48+ recently sold in Tysons Forest, Rock Hill
| Property | Sold | Sold Price | Days on Market | Size | Sold to Ask | Sold $/SF |
|---|---|---|---|---|---|---|
| | Jun 10 2026 | $435,678 | 91 | 2,275 sq ft | 99.0% | $192 |
| | Apr 15 2026 | $435,000 | 89 | 2,274 sq ft | 97.6% | $191 |
| | Apr 14 2026 | $385,000 | 32 | 1,672 sq ft | 101.3% | $230 |
| | Apr 1 2026 | $415,000 | 278 | 2,282 sq ft | 96.5% | $182 |
| | Feb 26 2026 | $425,000 | 47 | 2,210 sq ft | 100.0% | $192 |
| | Jan 28 2026 | $410,000 | 50 | 2,041 sq ft | 98.8% | $201 |
| | Nov 20 2025 | $383,750 | 49 | 1,952 sq ft | 101.0% | $197 |
| | Nov 19 2025 | $410,000 | 47 | 2,303 sq ft | 97.6% | $178 |
| | Oct 21 2025 | $395,000 | 193 | 1,992 sq ft | 100.0% | $198 |
| | Sep 9 2025 | $415,000 | 45 | 2,124 sq ft | 104.0% | $195 |
| | Jun 6 2025 | $450,000 | 56 | 2,183 sq ft | 97.8% | $206 |
| | Apr 29 2025 | $380,000 | 45 | 1,952 sq ft | 95.0% | $195 |
| | Nov 27 2024 | $405,000 | 23 | 2,032 sq ft | 100.0% | $199 |
| | Oct 30 2024 | $392,000 | 65 | 2,321 sq ft | 101.0% | $169 |
| | Aug 14 2024 | $474,900 | 74 | 2,547 sq ft | 100.0% | $186 |
| | Jun 27 2024 | $456,000 | 41 | 2,454 sq ft | 102.5% | $186 |
| | May 21 2024 | $370,000 | 168 | 1,998 sq ft | 97.4% | $185 |
| | Jul 21 2023 | $390,000 | 57 | 2,124 sq ft | 95.4% | $184 |
| | Jul 6 2023 | $355,000 | 94 | 1,875 sq ft | 96.0% | $189 |
| | Jul 6 2023 | $425,100 | 34 | 2,544 sq ft | 102.4% | $167 |
| | May 12 2023 | $380,000 | 50 | 2,168 sq ft | 104.8% | $175 |
| | Feb 10 2023 | $305,000 | 92 | 1,617 sq ft | 98.7% | $189 |
| | Oct 14 2022 | $378,500 | 147 | 2,336 sq ft | 99.9% | $162 |
| | Oct 11 2022 | $390,000 | 75 | 2,586 sq ft | 100.0% | $151 |
| | Sep 20 2022 | $333,000 | 83 | 2,243 sq ft | 102.5% | $148 |
| | Sep 1 2022 | $555,000 | 55 | 2,433 sq ft | 96.5% | $228 |
| | Nov 12 2021 | $330,000 | 36 | 1,957 sq ft | 101.6% | $169 |
| | Sep 24 2021 | $360,000 | 21 | 2,250 sq ft | 100.0% | $160 |
| | Aug 17 2021 | $349,900 | 46 | 2,042 sq ft | 100.0% | $171 |
| | Mar 30 2021 | $308,000 | 47 | 2,392 sq ft | 102.7% | $129 |
| | Jan 14 2021 | $270,000 | 38 | 1,930 sq ft | 100.0% | $140 |
| | Jan 6 2021 | $258,000 | 39 | 1,650 sq ft | 103.2% | $156 |
| | Oct 21 2020 | $256,000 | 56 | 2,059 sq ft | 102.4% | $124 |
| | Jun 26 2020 | $305,000 | 128 | 2,706 sq ft | 98.4% | $113 |
| | Jun 17 2020 | $245,000 | 118 | 2,236 sq ft | 100.8% | $110 |
| | May 29 2020 | $305,000 | 36 | 2,200 sq ft | 101.7% | $139 |
| | Apr 30 2020 | $285,000 | 48 | 2,721 sq ft | 100.0% | $105 |
| | Aug 26 2019 | $235,000 | 116 | 2,077 sq ft | 94.4% | $113 |
| | Jun 21 2019 | $240,777 | 59 | 1,978 sq ft | 100.3% | $122 |
| | May 17 2019 | $235,000 | 45 | 2,266 sq ft | 101.3% | $104 |
| | May 14 2019 | $262,000 | 48 | 2,372 sq ft | 98.9% | $110 |
| | Apr 17 2019 | $262,000 | 50 | 2,256 sq ft | 100.8% | $116 |
| | Jan 3 2019 | $245,000 | 113 | 2,185 sq ft | 98.0% | $112 |
| | Jan 3 2019 | $245,000 | 113 | 2,185 sq ft | 98.0% | $112 |
| | Oct 23 2018 | $200,000 | 120 | 2,097 sq ft | 97.6% | $95 |
| | Sep 25 2018 | $239,900 | 40 | 2,547 sq ft | 100.0% | $94 |
| | Sep 21 2018 | $228,000 | 59 | 2,266 sq ft | 99.1% | $101 |
| | Sep 21 2018 | $228,000 | 59 | 2,266 sq ft | 99.1% | $101 |
Closed sales from MLS history for Tysons Forest, Rock Hill
Tysons Forest median sale price is $412,500, up 1.9% from a year ago; Rock Hill is up 1.5%.
The Tysons Forest real estate market shows balanced market conditions. Homes typically sell within 53 days. With 2 active listings and 10 homes sold in the past year, a healthy balance exists between buyers and sellers.
Listings taken off the market in the past year in Tysons Forest, Rock Hill
Rock Hill, SC 29732
4 bd · 2 ba · 2,380 sqft
Rock Hill, SC 29732
4 bd · 2 ba · 2,336 sqft
These homes are no longer available, but they show recent pricing and listing activity in Tysons Forest. Our agents can help you watch for new listings in this area.
Contact an agentFree account needed — create one to continue viewing homes.
Members see everything — free👋 Still browsing Tysons Forest?
Full photos, price history, and every active & pending home in Tysons Forest with a free account.
Palmetto Park Realty Team
 $410K
$410KCheck your messages
We sent a code to .
Verify your number and we'll text you price drops and new Tysons Forest listings. 1–2 texts a month, stop anytime.
Enjoy full access to this home and every home on Palmetto Park.