Active
$129,999 $200/sqft
609 Clarinda Street
Rock Hill, SC 29730
2 bd · 1 ba · 650 sqft · 1952 · 21 d ago
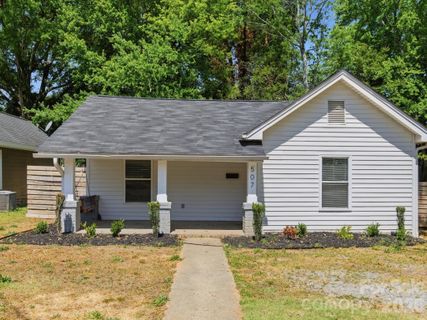
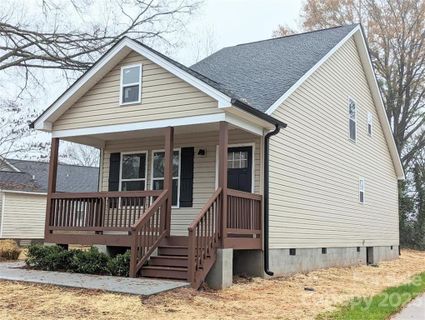
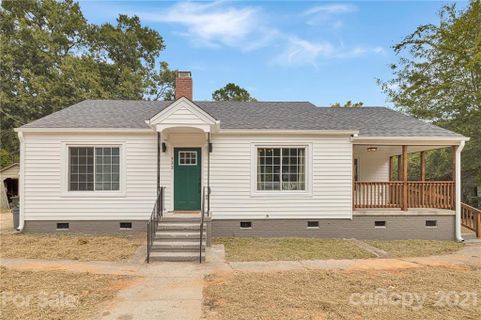
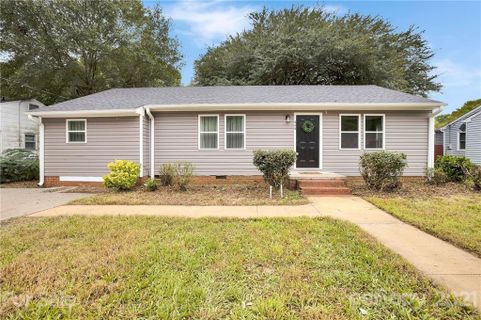
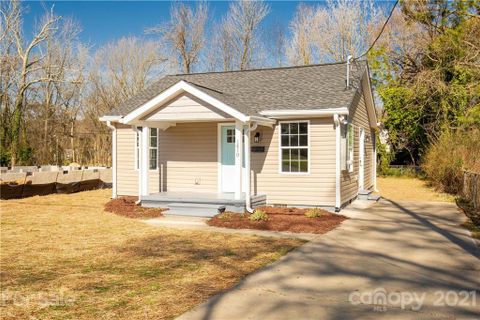
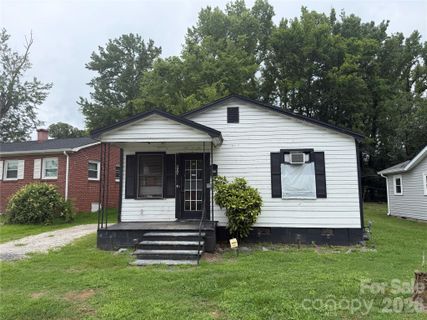
Rock Hill reads like a neighborhood with layers: older cottages and ranches, a few newer builds, and plenty of homes that have been thoughtfully updated over time.
Community overview based on MLS listing data for Rock Hill, Rock Hill
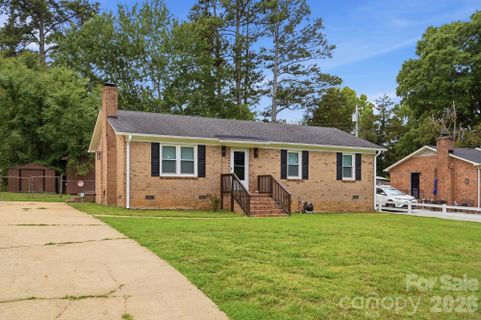
Rock Hill reads like a neighborhood with layers: older cottages and ranches, a few newer builds, and plenty of homes that have been thoughtfully updated over time. The setting feels established and practical, with tree-lined streets, modest lots, and the kind of curb appeal that comes from mature landscaping and well-kept yards. Many homes feature porches, fenced backyards, and flexible outdoor spaces that make everyday living feel easy.
"A well-rooted Rock Hill pocket where classic homes, usable yards, and city convenience come together."
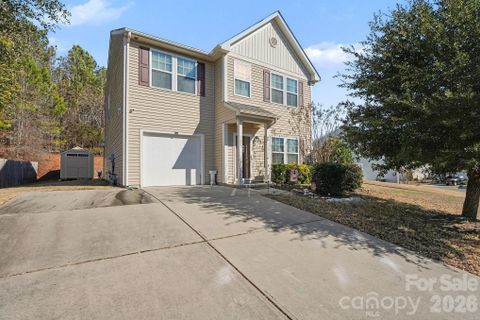
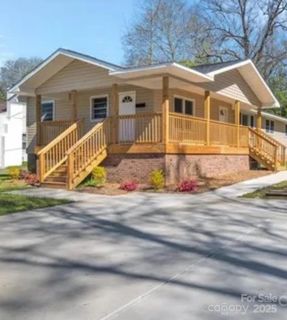
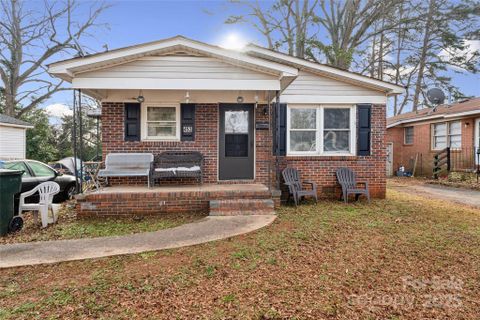
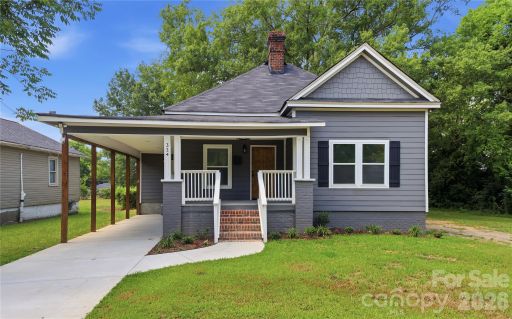
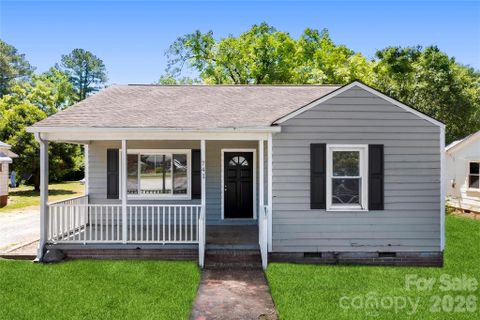
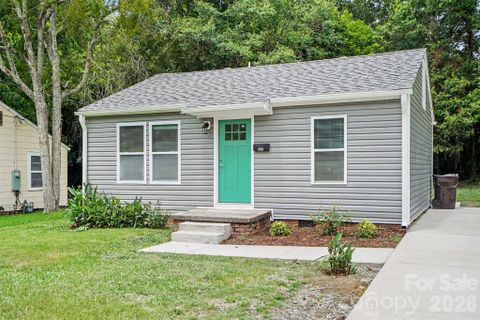
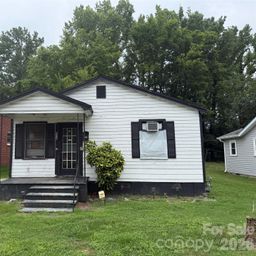
Single-family homes define the area, and the housing stock stretches from 1920s and 1940s bungalows to early-2000s and even newer construction. Brick appears in some homes, while others lean into siding, ranch profiles, and renovated interiors with modern kitchens, updated flooring, and refreshed baths. That mix gives the community a lived-in, adaptable character rather than a one-note look.
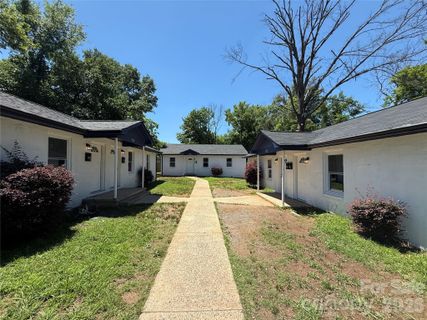
Lot sizes vary widely, which adds to the appeal. Some properties sit on compact, manageable parcels, while others stretch out to a half-acre or more, with one-acre and larger tracts also showing up. Outdoor features like covered patios, front porches, sheds, firepit areas, and fenced yards are common themes, and they help blur the line between indoor comfort and outdoor use.
This is a place where convenience matters. Listings repeatedly point to easy access to shopping, dining, schools, parks, and major roads, and that everyday practicality is part of the community’s identity. Several homes are close to downtown Rock Hill, while others sit near the Cherry Road area, Dave Lyle Boulevard, and Winthrop University. The rhythm here is straightforward: run errands, head into town, or get on the interstate without much fuss.
"The appeal here is simple: established streets, useful outdoor space, and quick access to the places people use most."
Rock Hill sits in York County in the Midlands of South Carolina, with the community centered around the city’s core and nearby corridors such as Cherry Road, Dave Lyle Boulevard, and Constitution Boulevard. Public remarks place some homes just minutes from downtown Rock Hill, about 2 minutes from I-77, and less than 2 miles northwest of the SC Center Business District. Other listings note easy access to I-77 for commuting to Charlotte. Nearby destinations include Winthrop University, Fountain Park, Glencairn Gardens, Piedmont Medical Center, and the downtown Rock Hill area. School names are not specified in the provided records, so the school picture remains general rather than tied to a single assignment.
Palmetto Park Realty Team · Rock Hill
Ask about Rock Hill — we answer fast
See what it's worth — your home's own sale history plus recent Rock Hill sales, free.
What's my home worth?Communities similar to Rock Hill
 1.0 mi
 Woodland Park, Rock Hill
9 active · $200,000
 1.8 mi
 Westover, Rock Hill
2 active · $179,950
 1.4 mi
 Sunset Park, Rock Hill
7 active · $239,000
 2.5 mi
 Darlington Heights, Rock Hill
2 active · $294,500
 2.3 mi
 Southland Park, Rock Hill
2 active · $237,500
 0.9 mi
 Fairview, Rock Hill
3 active · $185,900
18 recently sold in Rock Hill, Rock Hill
| Property | Sold | Sold Price | Days on Market | Size | Sold to Ask | Sold $/SF |
|---|---|---|---|---|---|---|
| | May 7 2026 | $340,000 | 97 | 2,317 sq ft | 98.6% | $147 |
| | Aug 25 2025 | $211,000 | 17 | 1,610 sq ft | 91.7% | $131 |
| | Aug 6 2025 | $125,000 | 183 | 950 sq ft | 75.8% | $132 |
| | May 15 2025 | $177,000 | 83 | 1,152 sq ft | 95.7% | $154 |
| | Jul 26 2023 | $210,000 | 82 | 2,000 sq ft | 99.5% | $105 |
| | Mar 3 2023 | $255,000 | 170 | 1,145 sq ft | 97.1% | $223 |
| | Oct 27 2021 | $247,000 | 34 | 1,589 sq ft | 96.9% | $155 |
| | Oct 21 2021 | $246,500 | 34 | 1,422 sq ft | 102.7% | $173 |
| | Oct 18 2021 | $105,000 | 38 | 648 sq ft | 95.5% | $162 |
| | Jun 18 2021 | $183,000 | 100 | 1,050 sq ft | 96.3% | $174 |
| | Apr 1 2021 | $200,000 | 40 | 1,170 sq ft | 105.3% | $171 |
| | Dec 20 2019 | $220,000 | 36 | 1,734 sq ft | 97.8% | $127 |
| | Sep 26 2019 | $129,000 | 49 | 1,394 sq ft | 103.2% | $93 |
| | Jul 22 2019 | $160,000 | 69 | 1,074 sq ft | 101.9% | $149 |
| | May 31 2017 | $45,500 | 464 | 980 sq ft | 88.7% | $46 |
| | Jun 24 2016 | $58,900 | 123 | 1,180 sq ft | 98.3% | $50 |
| | Oct 17 2014 | $173,500 | 51 | 1,825 sq ft | 100.0% | $95 |
| | Jul 28 2014 | $45,250 | 56 | — | 90.5% | — |
Closed sales from MLS history for Rock Hill, Rock Hill
Rock Hill median sale price is $200,000; Rock Hill is up 1.5%.
The Rock Hill real estate market shows balanced market conditions. Homes typically sell within 51 days. With 2 active listings and 3 homes sold in the past year, a healthy balance exists between buyers and sellers.
Listings taken off the market in the past year in Rock Hill, Rock Hill
Rock Hill, SC 29730
3 bd · 1 ba · 1,007 sqft
Rock Hill, SC 29730
3 bd · 1 ba · 1,535 sqft
These homes are no longer available, but they show recent pricing and listing activity in Rock Hill. Our agents can help you watch for new listings in this area.
Contact an agentFree account needed — create one to continue viewing homes.
Members see everything — free👋 Still browsing Rock Hill?
Full photos, price history, and every active & pending home in Rock Hill with a free account.
Palmetto Park Realty Team
 $130K
$130K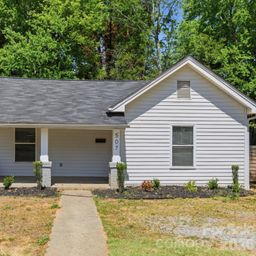 $225K
$225KCheck your messages
We sent a code to .
Verify your number and we'll text you price drops and new Rock Hill listings. 1–2 texts a month, stop anytime.
Enjoy full access to this home and every home on Palmetto Park.