Active
$1,125,000 $428/sqft
2127 Robert Drive
Morganton, NC 28655
3 bd · 4 ba · 2,627 sqft · 4.7 ac · 2026 · 4 mo ago
Fireplace Garage
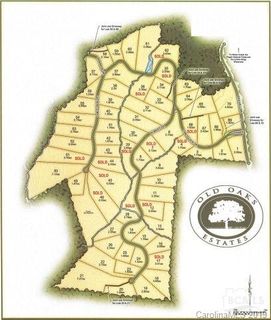
Old Oaks Estates feels like a foothills retreat with a little more room to breathe than most suburban enclaves.
Community overview based on MLS listing data for Old Oaks Estates, Morganton
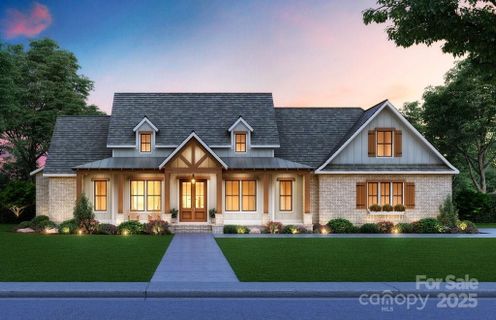
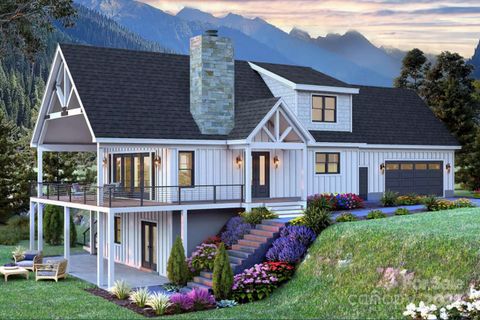
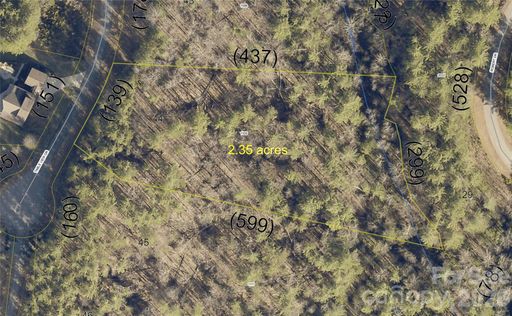
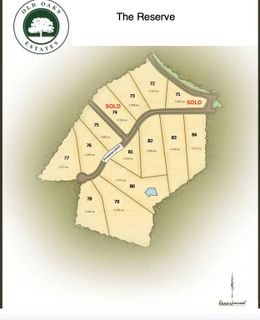
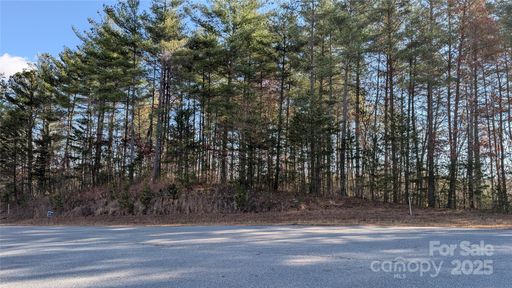
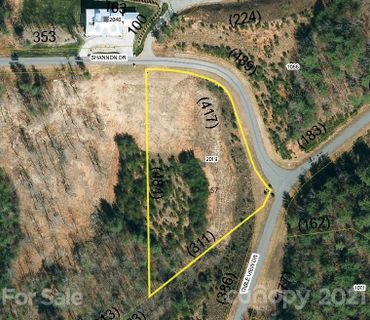
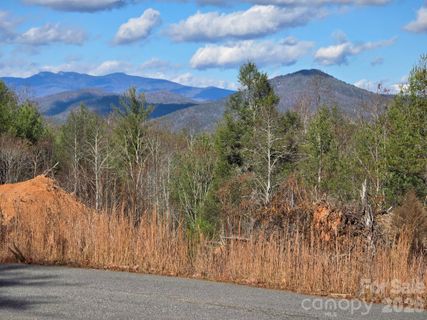
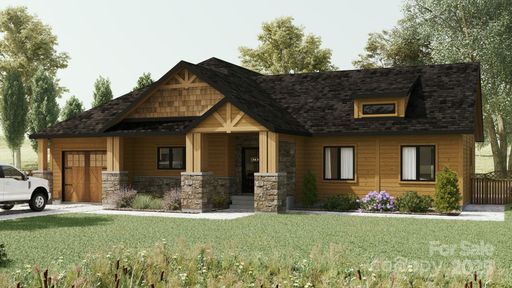
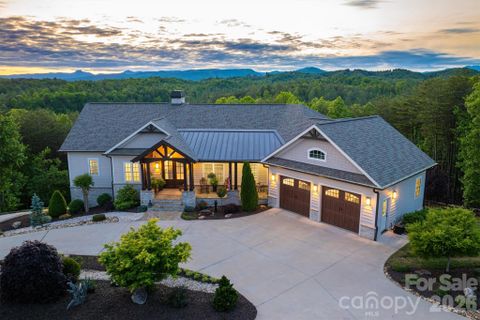
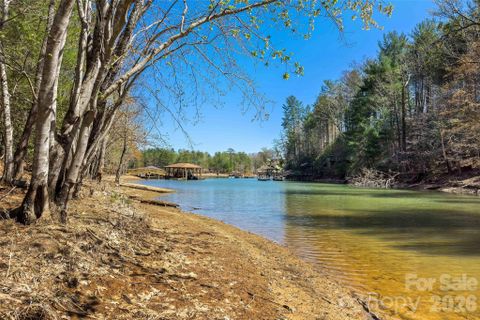
Old Oaks Estates feels like a foothills retreat with a little more room to breathe than most suburban enclaves. The setting is gated, the roads are paved, and the lots are notably generous, with acreage parcels and gently rolling ground shaping the neighborhood’s character. From many homesites, the views do the talking: Table Rock, Hawksbill, South Mountains, and even Grandfather Mountain appear in listing remarks often enough to define the place. Rather than a tightly packed street pattern, the community leans into privacy, wooded backdrops, and a landscape that invites custom building.
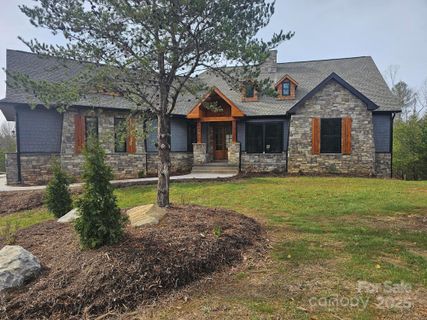
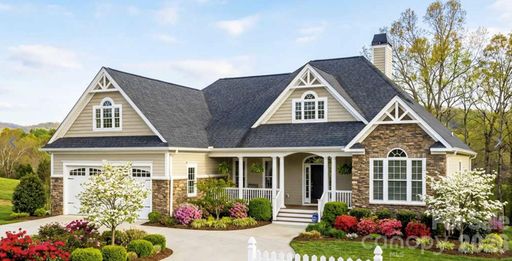
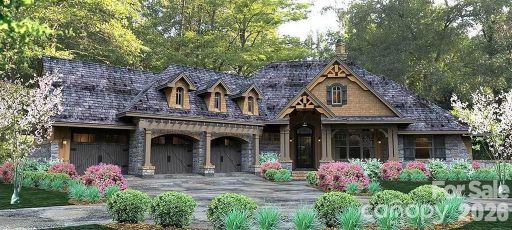
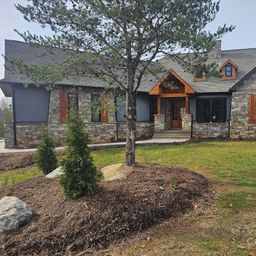
This is a mixed community where land remains a major part of the story, but the homes themselves set a clear tone. Custom construction, proposed builds, and newer completed homes all point toward a neighborhood built around individuality. Craftsman, European, cottage, chalet, and timberblock influences show up alongside open floor plans, vaulted ceilings, large windows, and covered porches that extend living space outdoors. Walk-out basements are common, and oversized garages appear often enough to feel like part of the design language. Many homes feature brick exteriors? Not here; the standout materials are more about wood, glass, stone accents, and mountain-home details that suit the terrain.
Daily life here is shaped by the land and the access it provides. Several properties mention high-speed fiber internet, including service up to 1000 meg, which is a meaningful convenience in a rural mountain setting. The paved, state-spec roads make the drive in and out feel more polished than remote, and the community’s gated access adds an extra layer of structure. Nearby recreation is a real part of the rhythm: Lake James, Pisgah National Forest, Wilson Creek, Linville Gorge, hiking trails, kayaking, canoeing, golf courses, wineries, public libraries, and a free public garden all surface in remarks. Foothills Regional Airport is another recurring landmark, and some listings note short-term rentals are allowed, adding flexibility for owners who want the property to serve more than one purpose.
Old Oaks Estates sits in the Morganton-to-Lenoir foothills corridor in Burke County, with public remarks placing it about 15 minutes from downtown Morganton on some listings and 20 minutes from downtown Lenoir on others. Another remark puts it roughly an hour from Charlotte, giving the community a clear regional reach without losing its mountain setting. Nearby destinations include downtown Morganton, downtown Lenoir, Foothills Regional Airport, Lake James, Pisgah National Forest, Wilson Creek, and Linville Gorge. School information in the MLS points to Mountain View Elementary and Walter Johnson Middle, while the high school is not specified. For buyers who want a mountain backdrop with practical access to town services and regional recreation, Old Oaks Estates offers a distinct western North Carolina address with a strong sense of place.
Palmetto Park Realty Team · Morganton
Ask about Old Oaks Estates — we answer fast
Communities similar to Old Oaks Estates
 4.2 mi
 The Bluffs Of Wilson Creek, Lenoir
6 active · $25,000
 4.8 mi
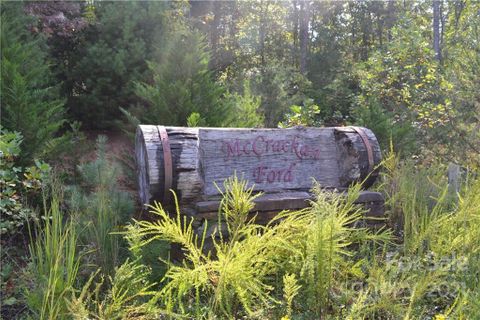
 McCracken Ford, Morganton
2 active · $249,682
 3.4 mi
 The Coves Mountain River Club, Lenoir
75 active · $129,900
 5.3 mi
 Heartwood Forest, Collettsville
2 active · $48,950
 9.3 mi
 Waters Edge, Morganton
8 active · $85,000
 7.1 mi
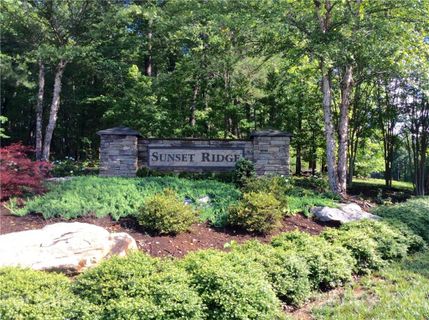
 Sunset Ridge, Morganton
4 active · $42,900
25 recently sold in Old Oaks Estates, Morganton
| Property | Sold | List Price | DOM | Size | List $/SF |
|---|---|---|---|---|---|
| | May 4 2026 | $79,997 | 52 | — | — |
| | Nov 3 2025 | $50,000 | 1236 | — | — |
| | Sep 12 2025 | $34,999 | 329 | — | — |
| | Apr 4 2025 | $85,000 | 2204 | — | — |
| | Apr 4 2025 | $65,000 | 2204 | — | — |
| | Jun 7 2024 | $89,900 | 68 | — | — |
| | Feb 23 2024 | $150,000 | 722 | — | — |
| | Jan 11 2024 | $575,000 | 55 | 2,095 sq ft | $274 |
| | Nov 17 2023 | $75,000 | 1700 | — | — |
| | Nov 17 2023 | $80,000 | 1700 | — | — |
| | Feb 15 2023 | $60,000 | 1425 | — | — |
| | Dec 19 2022 | $900,000 | 118 | 2,654 sq ft | $339 |
| | Apr 26 2022 | $79,900 | 270 | — | — |
| | Apr 14 2022 | $549,000 | 42 | 2,023 sq ft | $271 |
| | Sep 13 2021 | $479,000 | 230 | 1,867 sq ft | $257 |
| | Jun 30 2021 | $55,000 | 830 | — | — |
| | Feb 22 2021 | $429,000 | 72 | 2,550 sq ft | $168 |
| | Jan 26 2021 | $45,000 | 675 | — | — |
| | Oct 30 2019 | $298,000 | 397 | 2,189 sq ft | $136 |
| | Dec 20 2016 | $139,900 | — | — | — |
| | Mar 31 2016 | $309,900 | 165 | 2,023 sq ft | $153 |
| | Jul 21 2015 | $329,900 | 473 | 2,550 sq ft | $129 |
| | Apr 29 2015 | $255,000 | 50 | 2,023 sq ft | $126 |
| | Apr 29 2015 | $255,000 | 51 | 2,023 sq ft | $126 |
| | Apr 29 2015 | $255,000 | 49 | 2,023 sq ft | $126 |
Aggregated from MLS listing history for Old Oaks Estates, Morganton
The Old Oaks Estates real estate market shows buyer's market conditions. Homes typically sell within 299 days. With 29 active listings and 3 homes sold in the past year, buyers have more negotiating power and time to decide.
Listings taken off the market in the past year in Old Oaks Estates, Morganton
Morganton, NC 28655
3 bd · 3 ba · 4,437 sqft
Morganton, NC 28655
Morganton, NC 28655
4 bd · 3 ba · 2,506 sqft
These homes are no longer available, but they show recent pricing and listing activity in Old Oaks Estates. Our agents can help you watch for new listings in this area.
Contact an agentFree account needed — create one to continue viewing homes.
Members see everything — free👋 Still browsing Old Oaks Estates?
Full photos, price history, and every active & pending home in Old Oaks Estates with a free account.
Palmetto Park Realty Team
 $1.15M
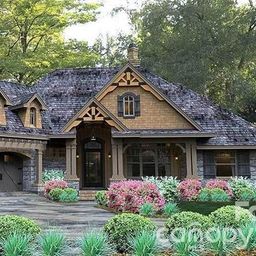 $1.13M
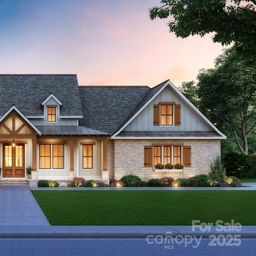 $875K
$875K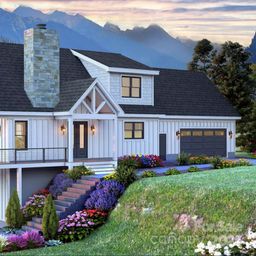 $725K
$725K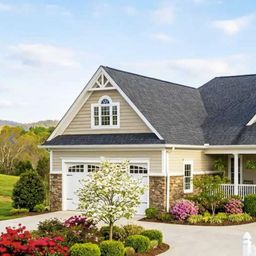 $600K
$600K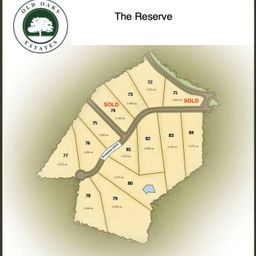 $130K
$130KCheck your messages
We sent a code to .
Verify your number and we'll text you price drops and new Old Oaks Estates listings. 1–2 texts a month, stop anytime.
Enjoy full access to this home and every home on Palmetto Park.