Waterside Landing Homes for Sale
No homes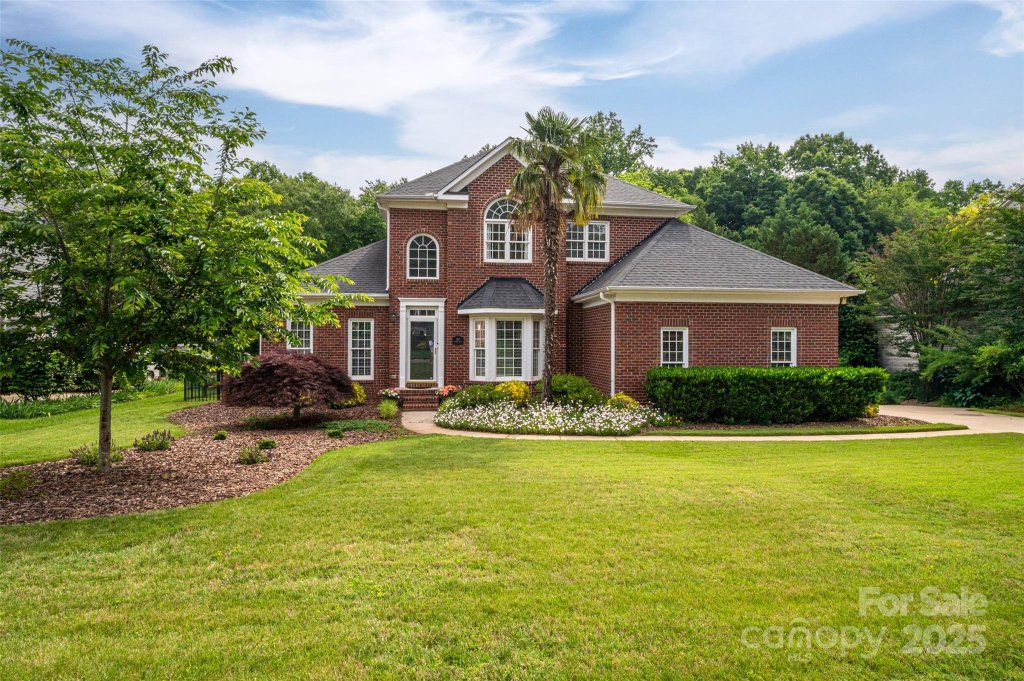

Community Highlights
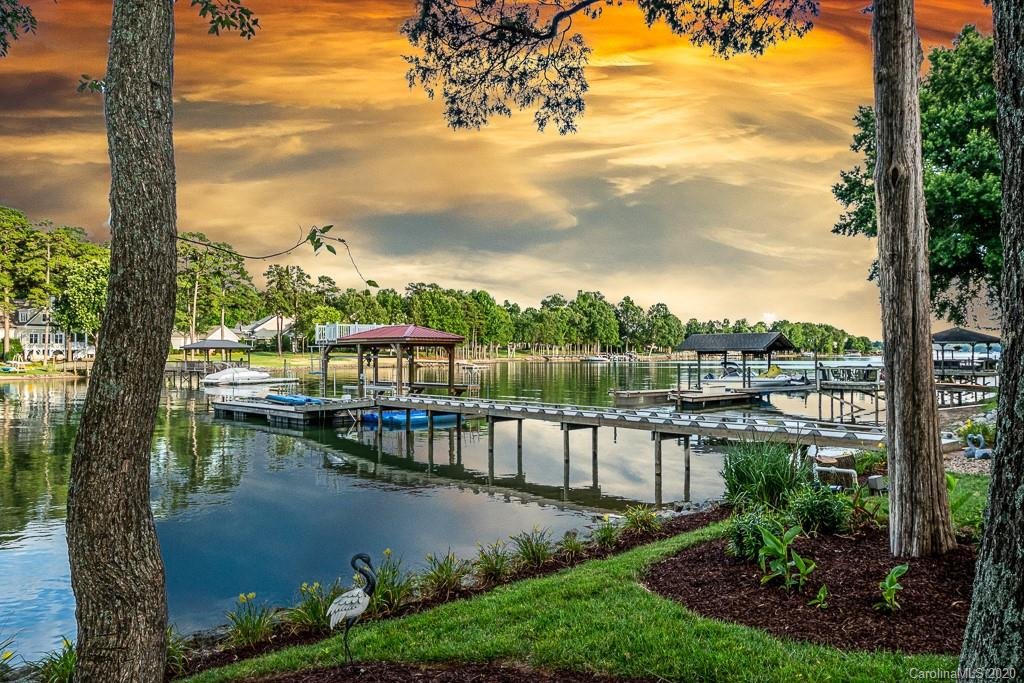
- Lake Norman frontage with deeded boat-slip access and a day dock
- Garage parking in every home
- Large lots for the peninsula setting, averaging about 0.42 acres
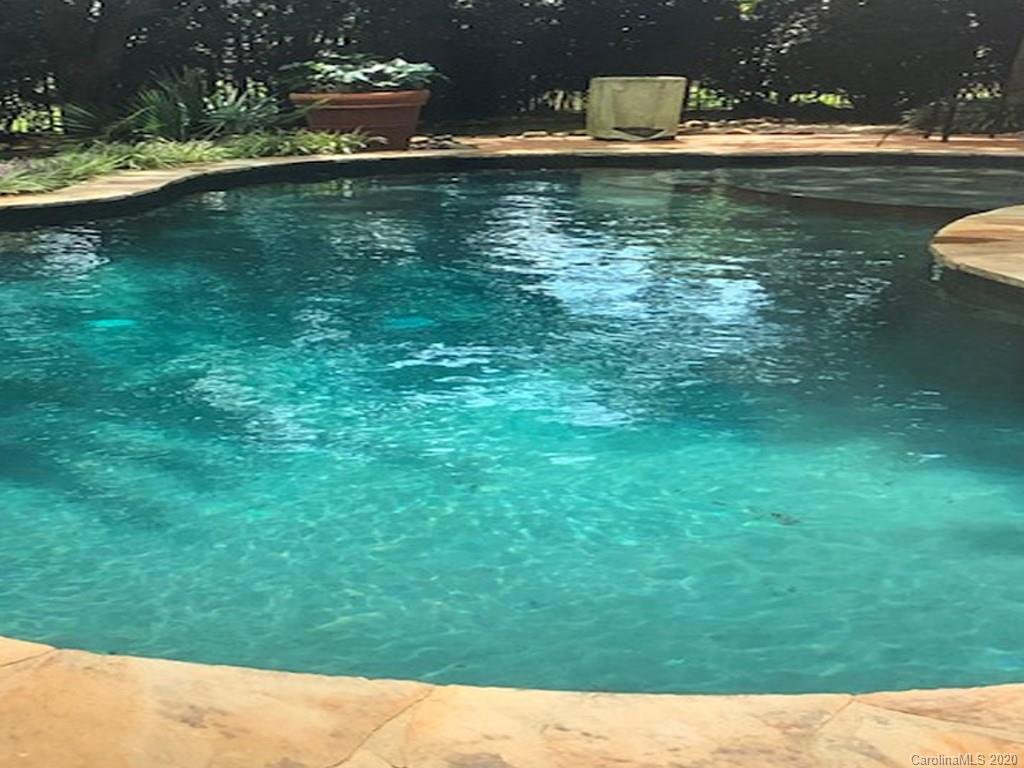
- Outdoor living spaces such as decks, screened porches, fenced yards, and private pools
* Based on what we noticed in listing details.


shared access
* Based on what we noticed in listing details.
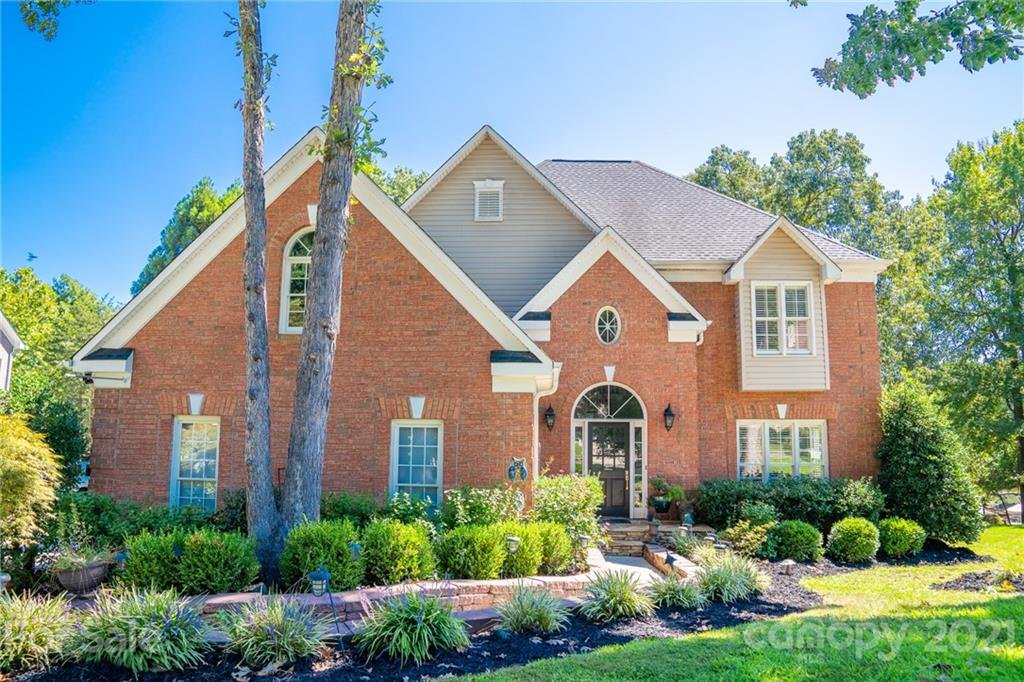


Architecture & Style
- Waterfront Lots
- Attached Garages
- Private Pools
- Deeded Boat Slips
- Deck Spaces
- Hardwood Floors
- Granite Kitchens
* Based on what we noticed in listing details.

Location & Proximity
Lake Norman waterfront peninsula in Mooresville
- Lake Norman
- LangTree area
- I-77 Exit 31
- Mooresville shopping and dining
* Based on what we noticed in listing details.


Community Highlights
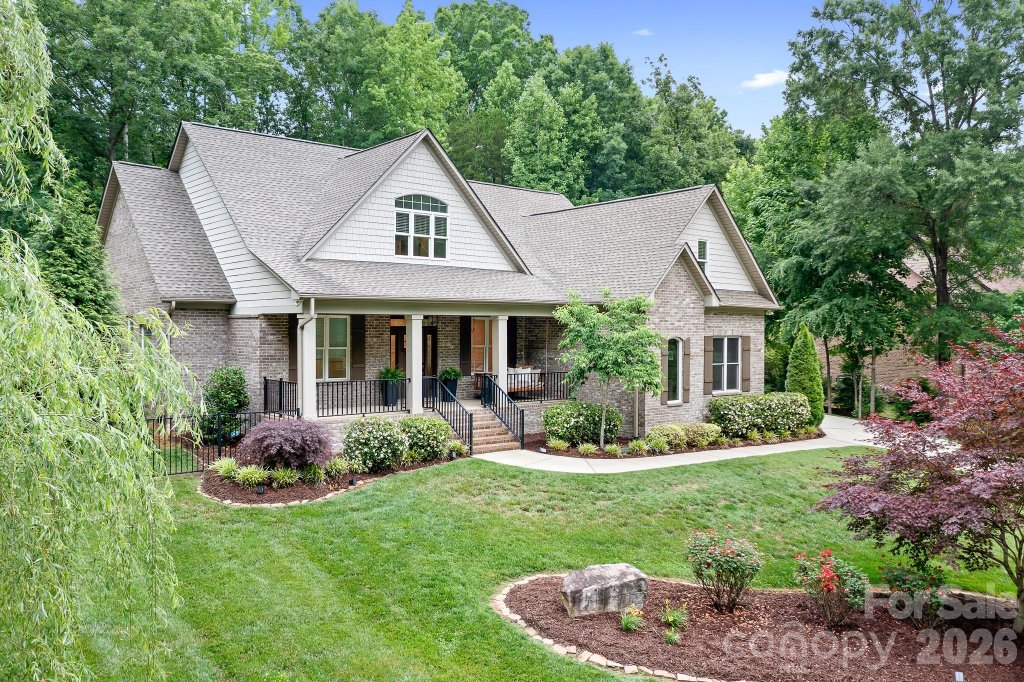
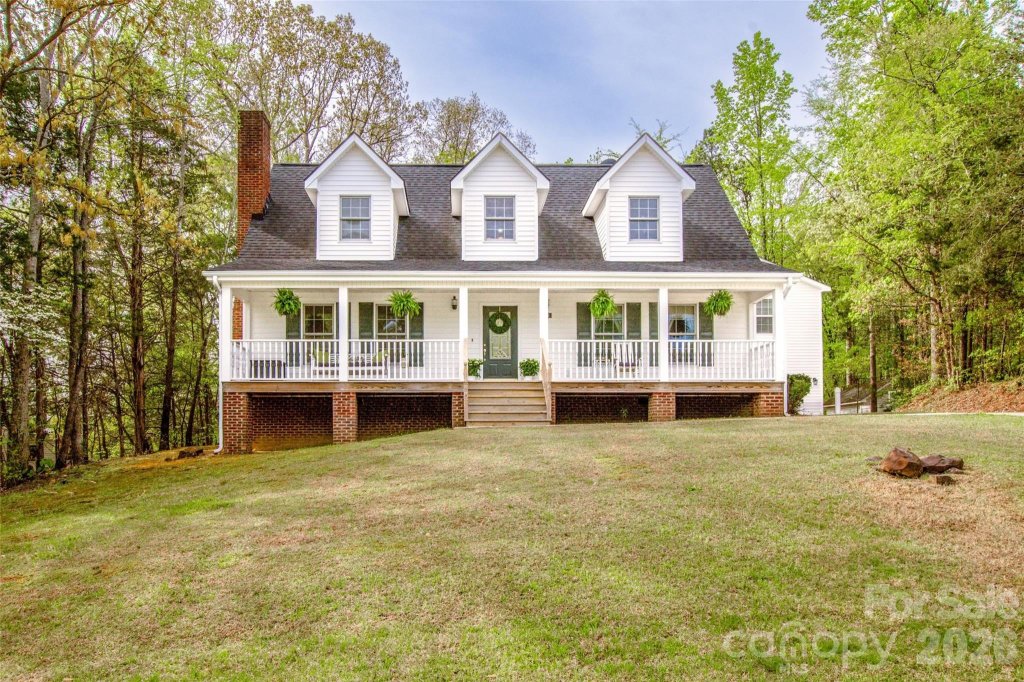
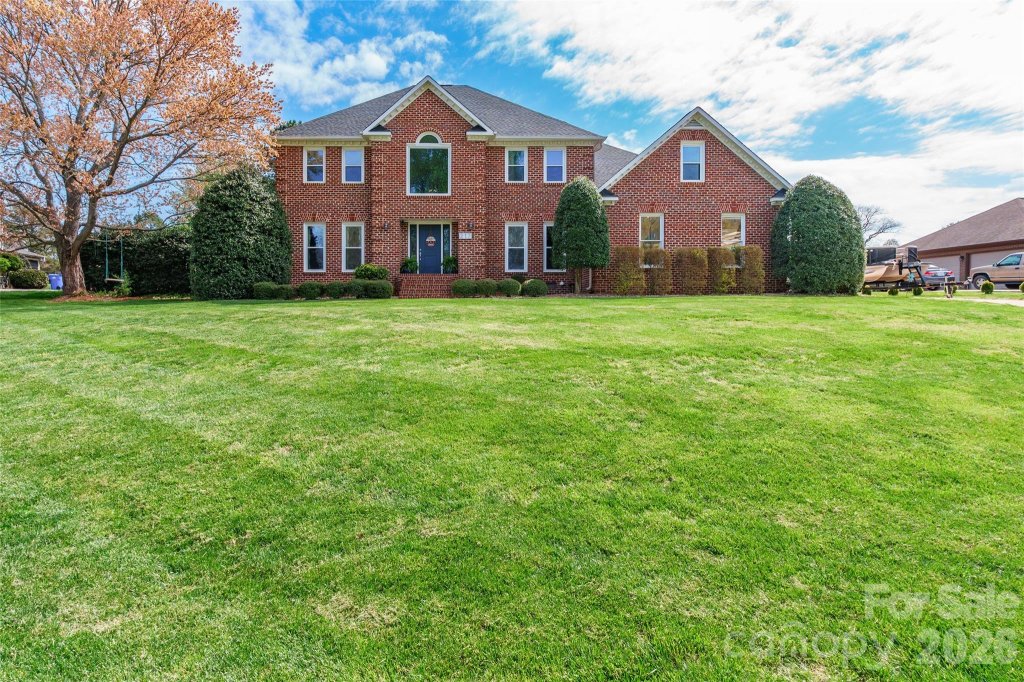
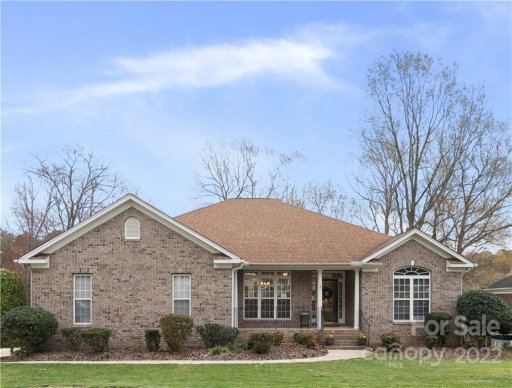
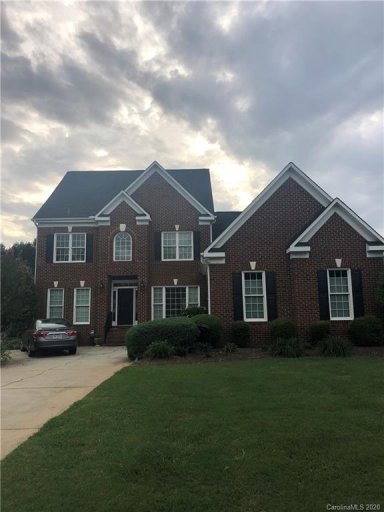
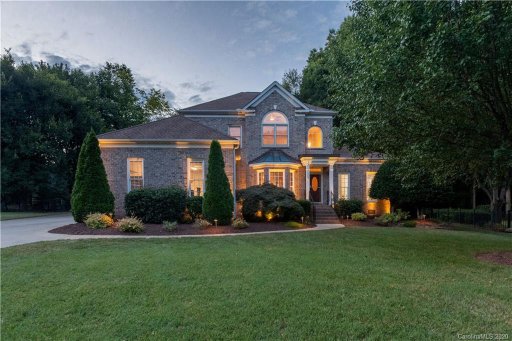
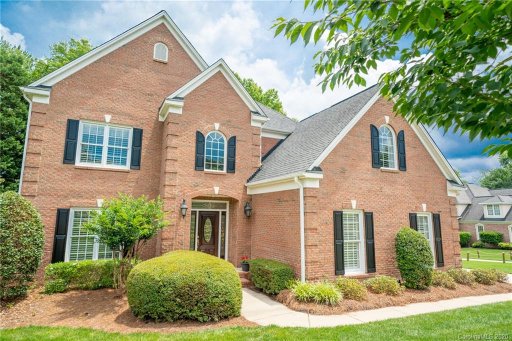
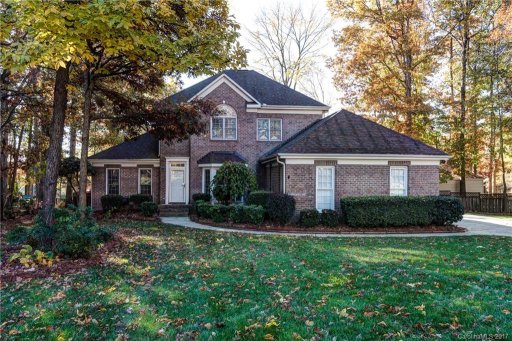
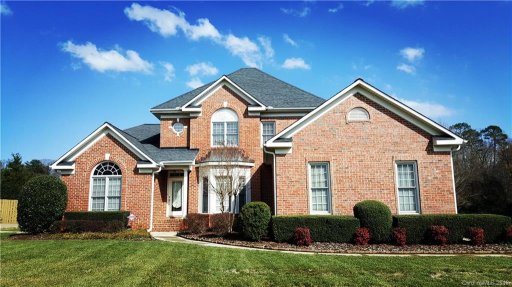
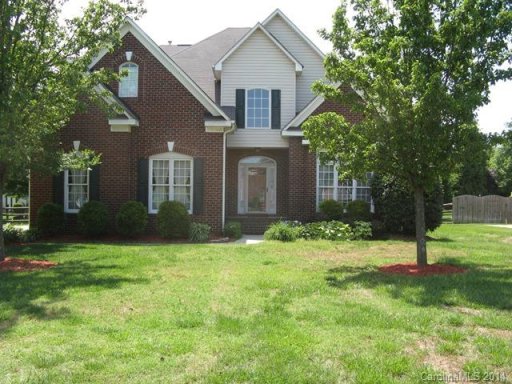
Waterside Landing sits on the Langtree Peninsula in Mooresville, where Lake Norman access shapes the neighborhood as much as the street plan does. The setting reads as a lake-oriented single-family enclave: waterfront parcels, deeded boat-slip access, and a day dock give the community a clear shoreline identity.
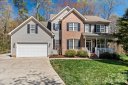
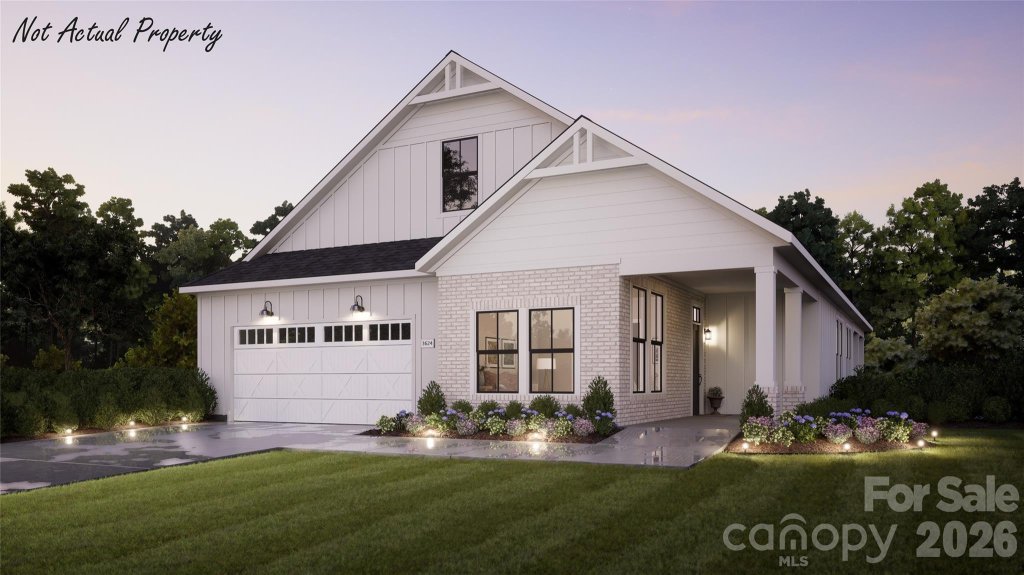
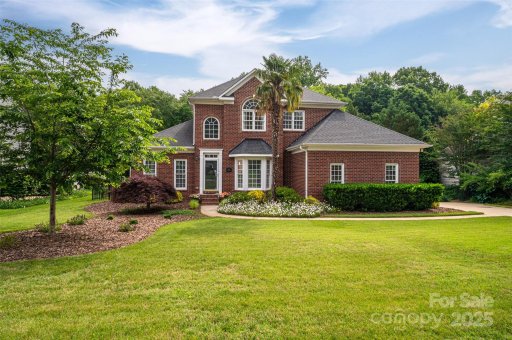
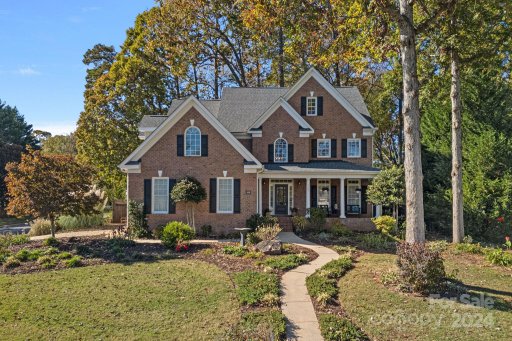
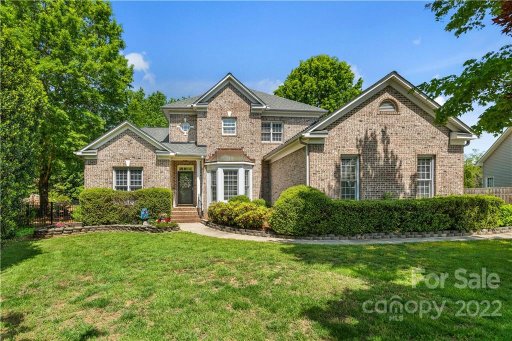
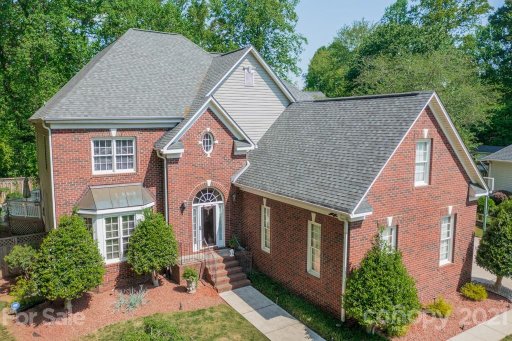
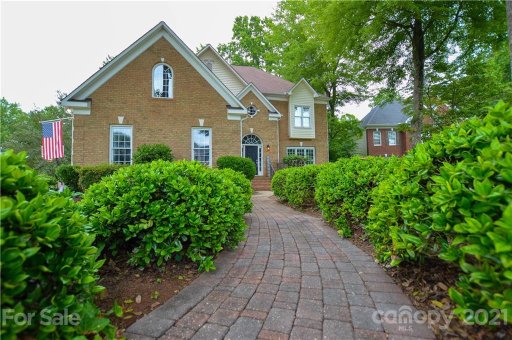
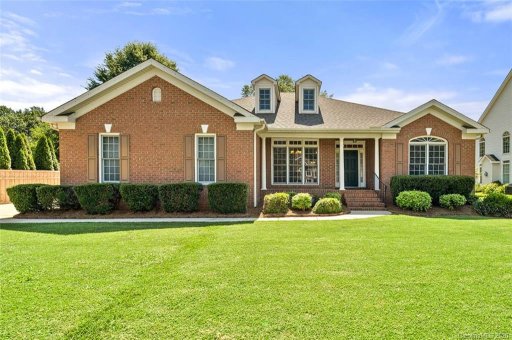
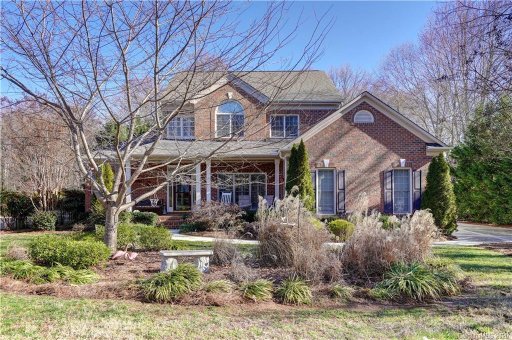
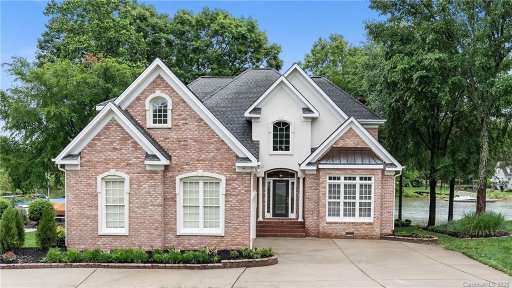
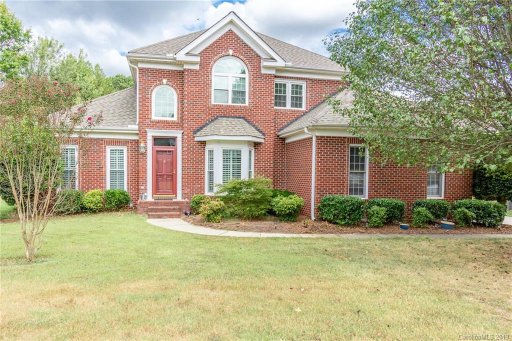
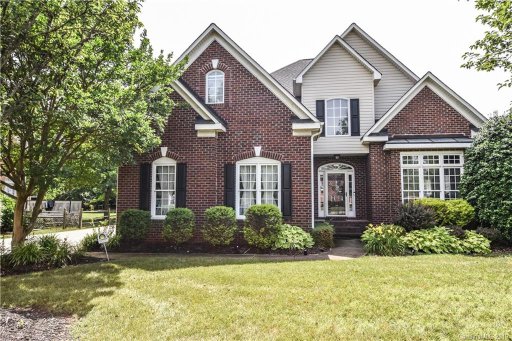
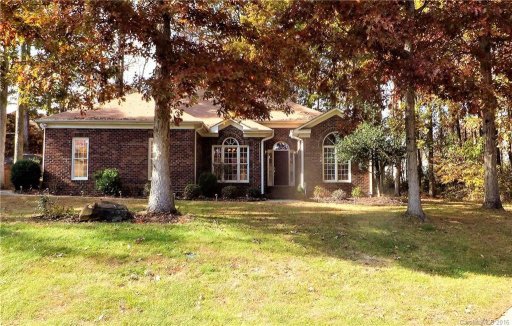
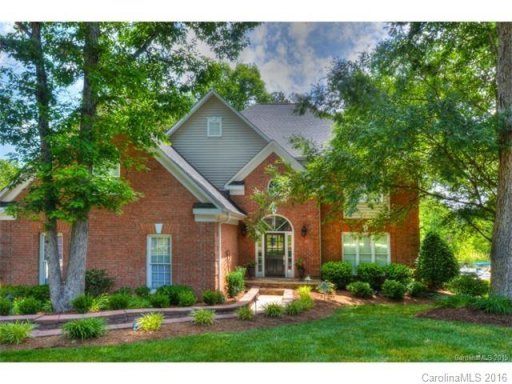
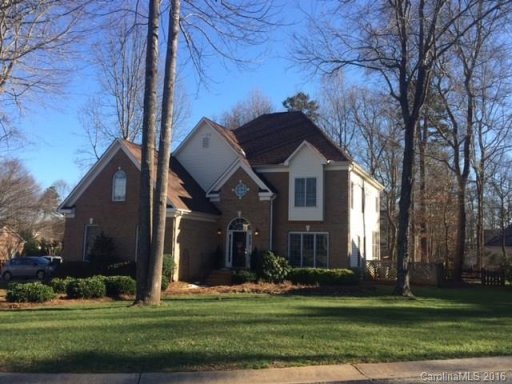
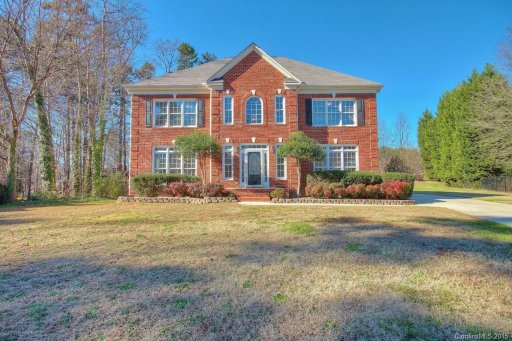
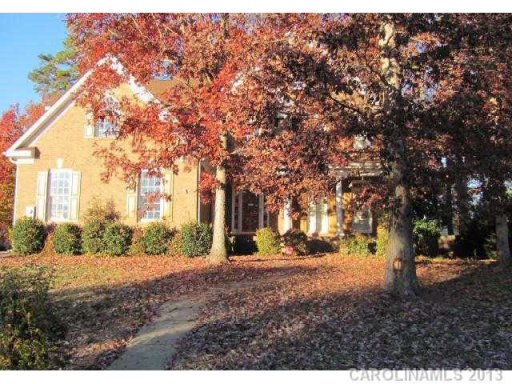
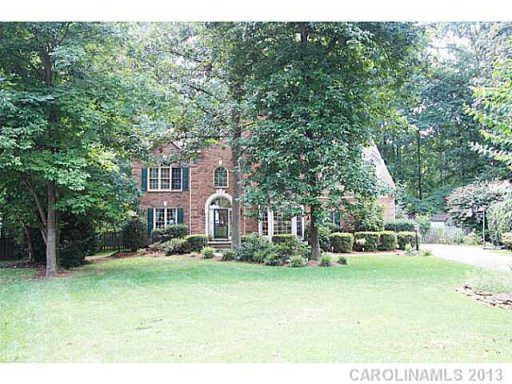
The homes are late-1990s builds, with the oldest examples from 1996 and the newest from 2000. Plans range from ranch layouts to two-story homes, and many include main-level primary suites, bonus rooms, and office space. Brick appears repeatedly, but the exterior palette is mixed rather than uniform, with brick, brick-and-vinyl, and other finishes represented across the neighborhood. Pricing spans a wide band, from the mid-$200s to about $1.15 million, while the center of the community sits in the upper-$700s.
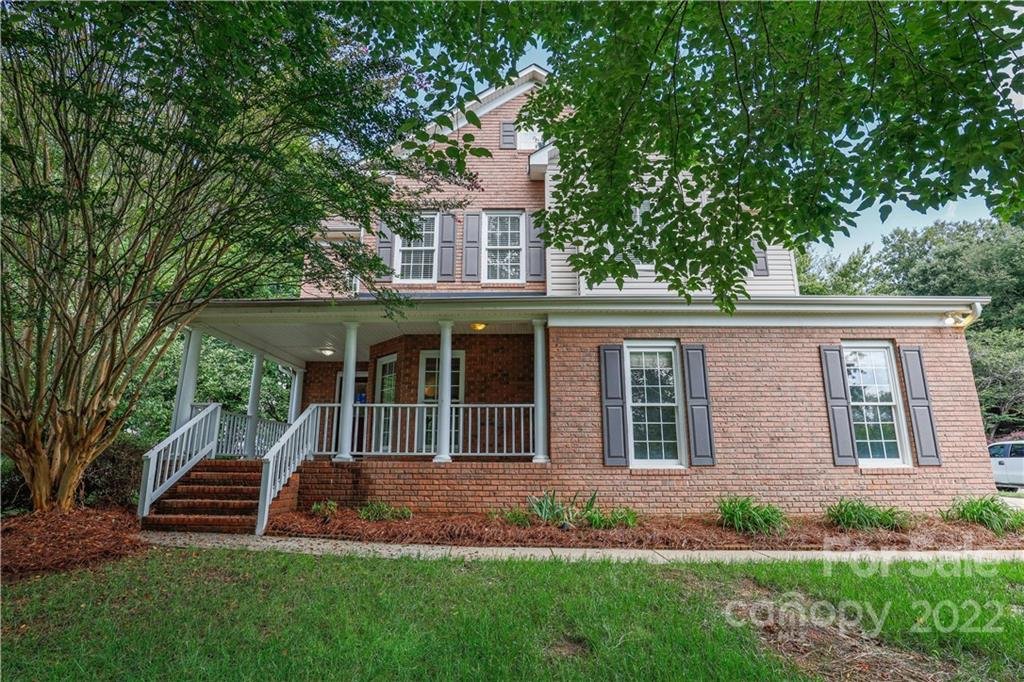
Amenities & Lifestyle
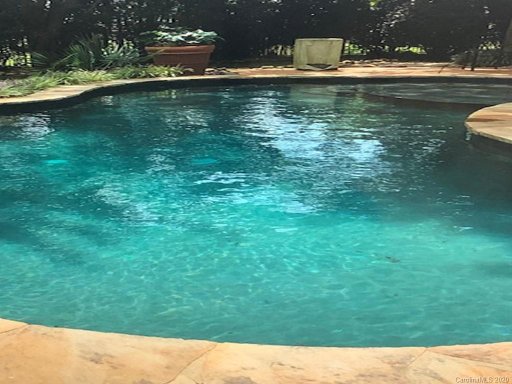
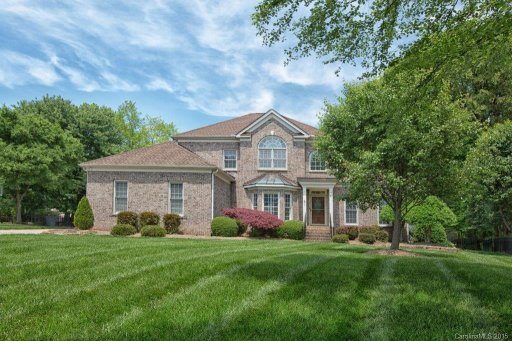
Outdoor living is a major part of the appeal. Decks are common, screened porches and sunrooms appear on several homes, and fenced yards show up often enough to be part of the community character. A community pool adds a shared amenity layer, while private pools are also common in the home mix. Garage parking is universal, and the lot profile is larger than a typical suburban tract, averaging about 0.42 acres.
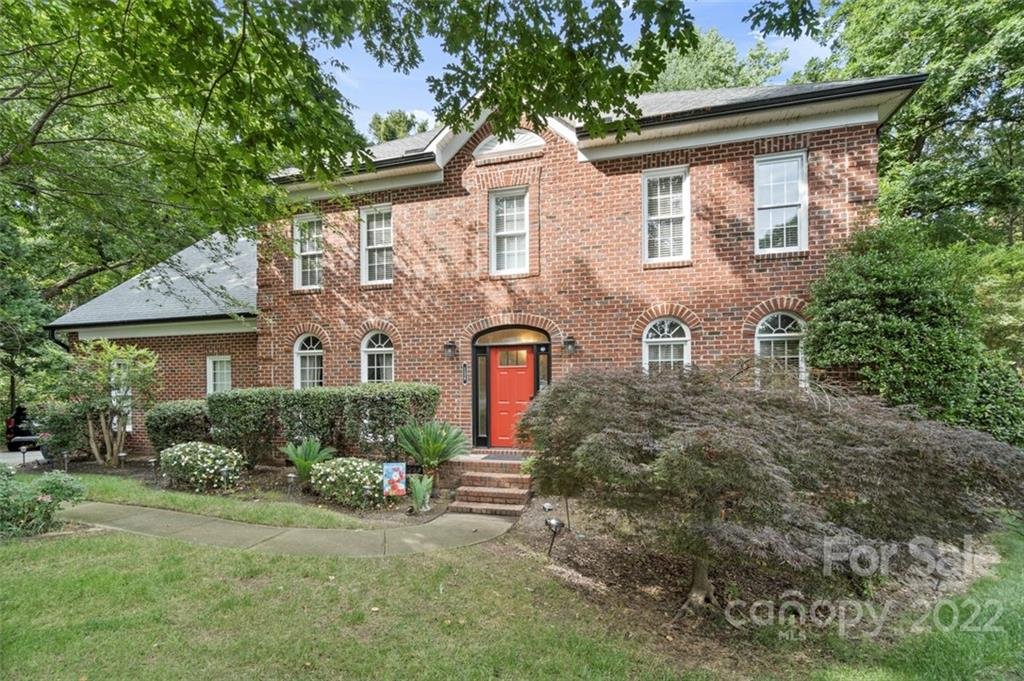
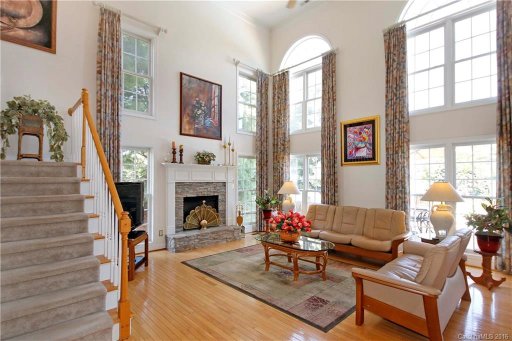
Inside, the recurring details lean practical and polished: granite kitchens, hardwood floors, fireplaces, refreshed baths, and updated paint or carpet appear often. Cul-de-sac lots and wooded parcels also help soften the street pattern, and the neighborhood keeps a strong waterfront-living feel without losing the convenience of detached suburban homes.
These insights are based on listing details and are informational only; verify details for any specific property.
Market Trends
Buyers have more negotiating power. Properties may take longer to sell.
Year-over-Year Comparison
Last 12 months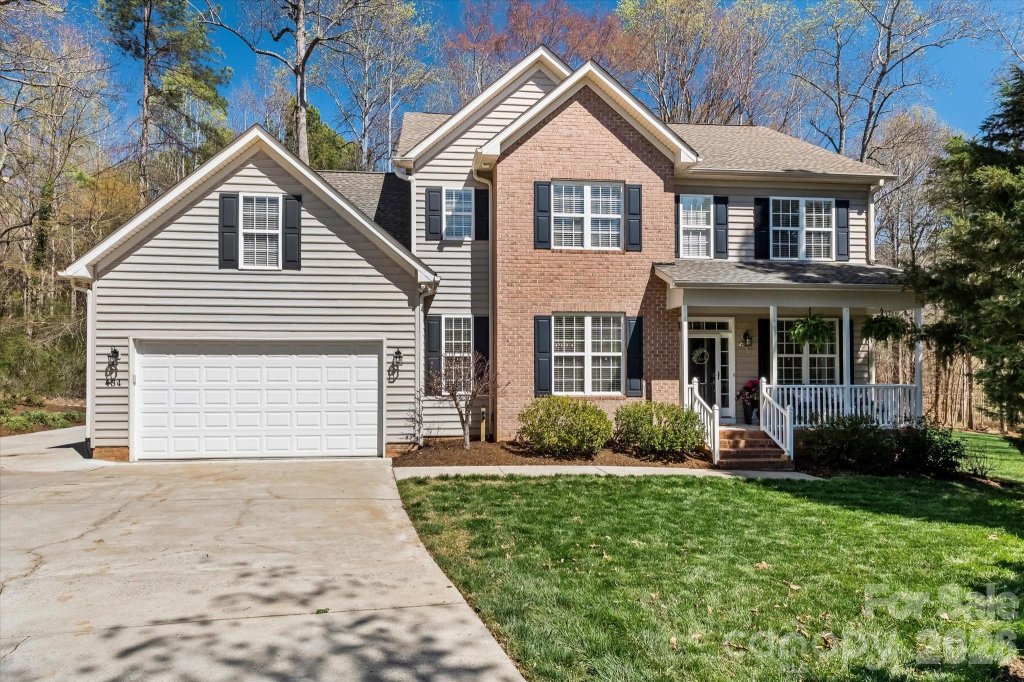

Recently Sold Properties
| Property | Sold Date▼ | Sale Price↕ | DOM↕ | LP/SP↕ | Size↕ | $/SF↕ |
|---|---|---|---|---|---|---|
 SOLD 133 Castaway Trail 4 bed2 bath | Jul 22 2025 | $739,900 | 137 | 🎯101% | 2686 sq ft | $275 |
6 month gap in market activity | ||||||
 SOLD 125 Pebble Brook Lane 4 bed3 bath | Jan 8 2025 | $879,000 | 54 | 🎯101% | 3145 sq ft | $279 |
1+ year gap in market activity | ||||||
 SOLD 103 Shadyview Lane 4 bed2 bath | Mar 22 2023 | $572,000 | 195 | 🎯100% | 2546 sq ft | $225 |
7 month gap in market activity | ||||||
 SOLD 136 Pebble Brook Lane 4 bed2 bath | Jul 29 2022 | $875,000 | 49 | 96% | 3074 sq ft | $285 |
 SOLD 108 Patton Court 4 bed3 bath | May 31 2022 | $676,000 | 32 | 🎯110% | 2814 sq ft | $240 |
 SOLD 124 Pebble Brook Lane 3 bed2 bath | Apr 25 2022 | $920,000 | 30 | 🎯108% | 2247 sq ft | $409 |
6 month gap in market activity | ||||||
 SOLD 128 Pebble Brook Lane 4 bed3 bath | Oct 21 2021 | $825,000 | 47 | 97% | 3127 sq ft | $264 |
2 month gap in market activity | ||||||
 SOLD 112 Sasserbrook Lane 5 bed3 bath | Jul 26 2021 | $685,000 | 89 | 🎯106% | 3417 sq ft | $200 |
 SOLD 103 Patton Court 4 bed3 bath | Jul 20 2021 | $580,000 | 39 | 99% | 3146 sq ft | $184 |
6 month gap in market activity | ||||||
 SOLD 117 Castaway Trail 4 bed2 bath | Jan 11 2021 | $530,000 | 48 | 99% | 3619 sq ft | $146 |
 SOLD 104 Pebble Brook Lane 23 4 bed3 bath | Dec 14 2020 | $1.15M | 36 | 🎯100% | 3553 sq ft | $324 |
2 month gap in market activity | ||||||
 SOLD 118 Castaway Trail 4 bed2 bath | Sep 24 2020 | $410,000 | 9 | 🎯100% | 3000 sq ft | $137 |
 SOLD 107 Shadyview Lane 4 bed2 bath | Aug 27 2020 | $440,000 | 47 | 🎯100% | 2646 sq ft | $166 |
 SOLD 122 Castaway Trail 3 bed2 bath | Aug 24 2020 | $376,250 | 40 | 🎯103% | 2225 sq ft | $169 |
 SOLD 137 Castaway Trail 4 bed2 bath | Aug 5 2020 | $415,000 | 208 | 99% | 2408 sq ft | $172 |
 SOLD 116 Pebble Brook Lane 4 bed3 bath | Jul 17 2020 | $875,000 | 29 | 🎯100% | 4275 sq ft | $205 |
 SOLD 108 Pebble Brook Lane 4 bed3 bath | Jul 9 2020 | $950,000 | 49 | 95% | 3274 sq ft | $290 |
4 month gap in market activity | ||||||
 SOLD 121 Castaway Trail 4 bed2 bath | Feb 21 2020 | $435,000 | 135 | 98% | 2584 sq ft | $168 |
4 month gap in market activity | ||||||
 SOLD 110 Castaway Trail 4 bed3 bath | Oct 10 2019 | $423,000 | 118 | 97% | 3260 sq ft | $130 |
1+ year gap in market activity | ||||||
 SOLD 113 Sasserbrook Lane 4 bed2 bath | Jan 9 2018 | $426,385 | 48 | 96% | 2651 sq ft | $161 |
11 month gap in market activity | ||||||
 SOLD 105 Castaway Trail 4 bed2 bath | Feb 10 2017 | $390,000 | 193 | 95% | 3209 sq ft | $122 |
 SOLD 129 Pebble Brook Lane 14 3 bed2 bath | Jan 18 2017 | $290,000 | 54 | 97% | 2006 sq ft | $145 |
8 month gap in market activity | ||||||
 SOLD 128 Pebble Brook Lane 17 4 bed3 bath | May 6 2016 | $637,600 | 47 | 98% | 3207 sq ft | $199 |
 SOLD 109 Castaway Trail 4 bed2 bath | Apr 19 2016 | $390,000 | 46 | 🎯100% | 2947 sq ft | $132 |
 SOLD 103 Patton Court 4 bed3 bath | Mar 29 2016 | $358,000 | 125 | 🎯100% | 3190 sq ft | $112 |
7 month gap in market activity | ||||||
 SOLD 107 Shadyview Lane 4 bed2 bath | Aug 31 2015 | $363,500 | 117 | 99% | 2638 sq ft | $138 |
3 month gap in market activity | ||||||
 SOLD 110 Patton Court 4 bed2 bath | May 22 2015 | $355,000 | 133 | 95% | 3310 sq ft | $107 |
10 month gap in market activity | ||||||
 SOLD 110 Castaway Trail 4 bed3 bath | Jul 22 2014 | $374,500 | 68 | 95% | 3080 sq ft | $122 |
4 month gap in market activity | ||||||
 SOLD 125 Pebble Brook Lane 3 bed2 bath | Mar 4 2014 | $320,069 | 79 | 96% | 3177 sq ft | $101 |
 SOLD 115 Sasserbrook Lane 31 4 bed2 bath | Jan 10 2014 | $395,000 | 108 | 96% | 3194 sq ft | $124 |
133 Castaway Trail
$739,900
125 Pebble Brook Lane
$879,000
103 Shadyview Lane
$572,000
136 Pebble Brook Lane
$875,000
108 Patton Court
$676,000
124 Pebble Brook Lane
$920,000
128 Pebble Brook Lane
$825,000
112 Sasserbrook Lane
$685,000
103 Patton Court
$580,000
117 Castaway Trail
$530,000
104 Pebble Brook Lane 23
$1,150,000
118 Castaway Trail
$410,000
107 Shadyview Lane
$440,000
122 Castaway Trail
$376,250
137 Castaway Trail
$415,000
116 Pebble Brook Lane
$875,000
108 Pebble Brook Lane
$950,000
121 Castaway Trail
$435,000
110 Castaway Trail
$423,000
113 Sasserbrook Lane
$426,385
105 Castaway Trail
$390,000
129 Pebble Brook Lane 14
$290,000
128 Pebble Brook Lane 17
$637,600
109 Castaway Trail
$390,000
103 Patton Court
$358,000
107 Shadyview Lane
$363,500
110 Patton Court
$355,000
110 Castaway Trail
$374,500
125 Pebble Brook Lane
$320,069
115 Sasserbrook Lane 31
$395,000
Market Statistics
The Waterside Landing real estate market shows balanced market conditions. Homes typically sell within 52 days. With 0 active listings and 1 homes sold in the past year, A healthy balance between buyers and sellers.
Pricing
Median Price:$739,900
Average Price:$748,380
Property Details
Avg Bedrooms:3.9
Avg Bathrooms:2.4
Avg Lot Size:0.42 acres
Market Activity
Active Listings:0
Sold Last Year:1
Median Days to Sell:52 days
Community Info
Median Year Built:1998
New Construction:0%