Sold
$305,000 $198/sqft
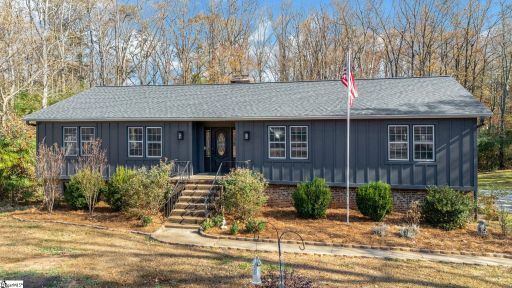
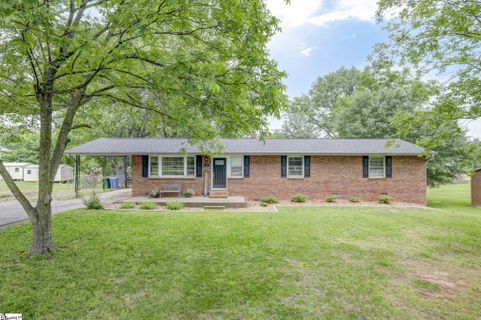
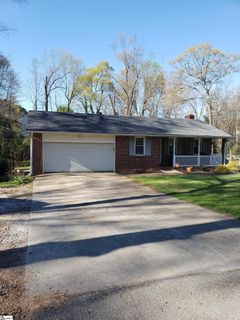
219 Drury Lane
Mauldin, SC 29662
4 bd · 2 ba · 1,539 sqft · 1967 · DOM: 66 d
Fireplace Garage
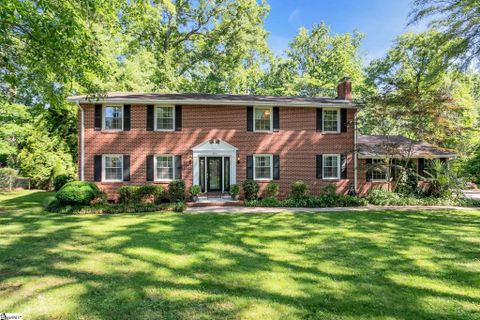
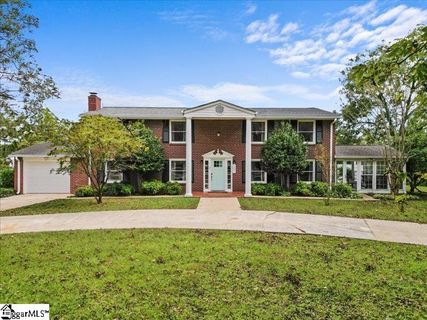
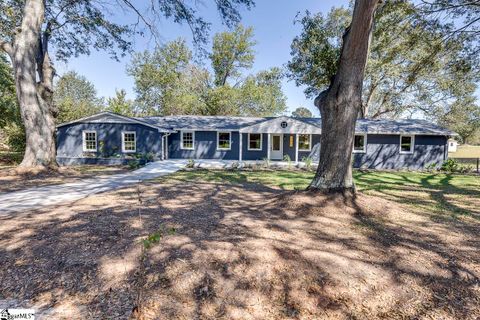
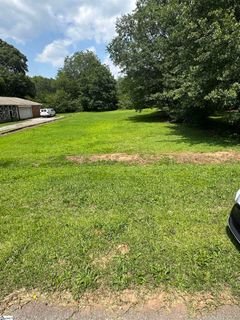
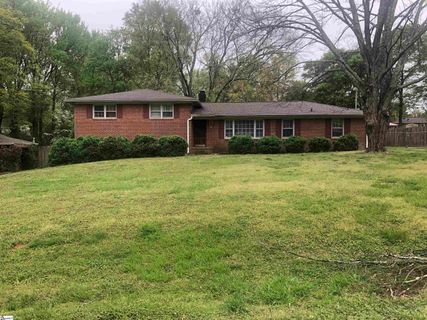
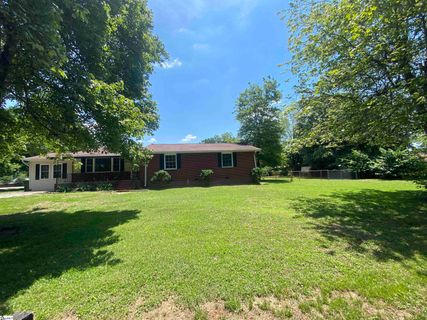
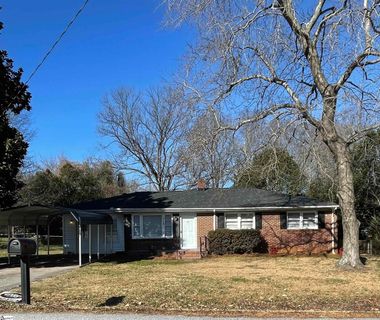
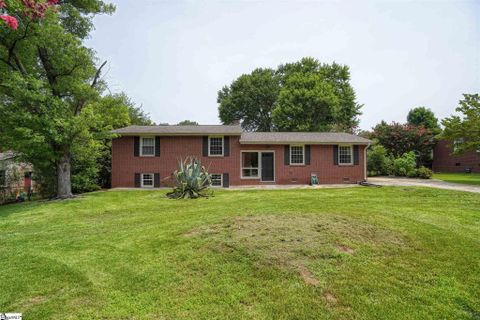
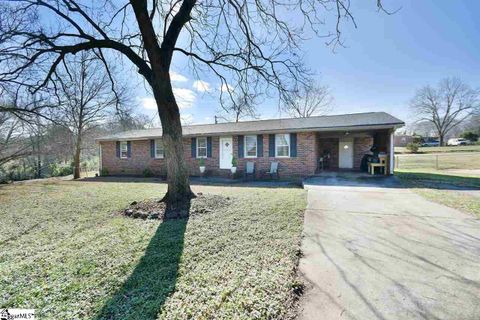
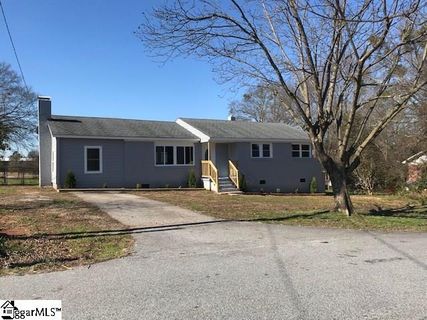
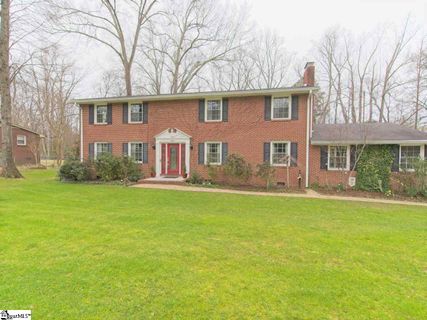
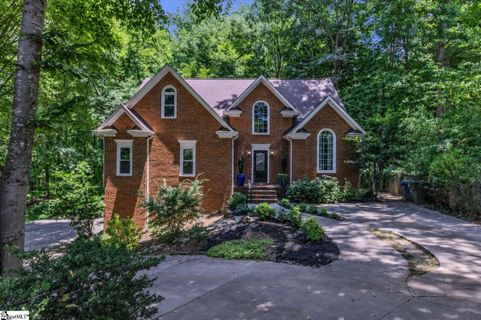
Glendale is one of Mauldin''s most recognizable established neighborhoods—a tree-lined community of largely single-story homes set on generous lots, many approaching or exceeding half an acre.
Community overview based on MLS listing data for Glendale, Mauldin
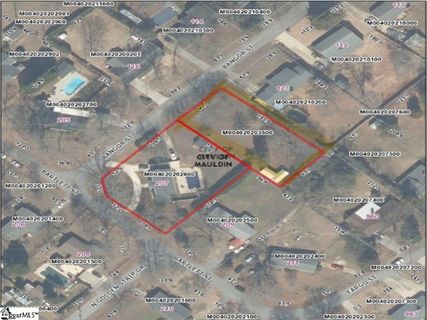
Glendale is one of Mauldin''s most recognizable established neighborhoods—a tree-lined community of largely single-story homes set on generous lots, many approaching or exceeding half an acre. Situated just off East Butler Road, it sits at the center of the rapidly growing Upstate corridor, offering quick access to major commuter routes while maintaining the feel of a settled, low-density neighborhood.
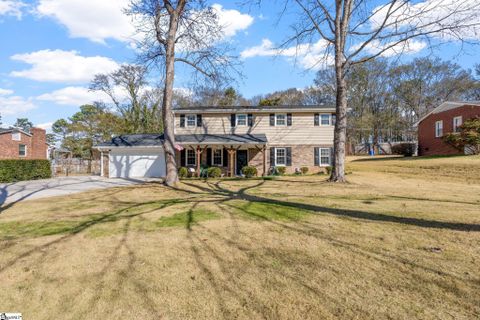
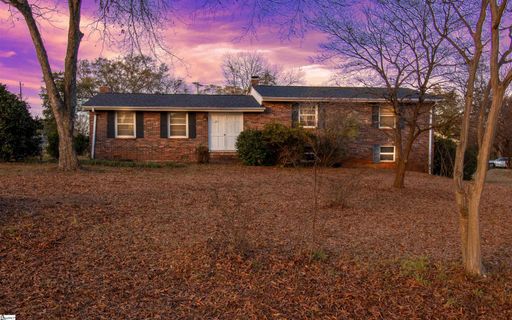
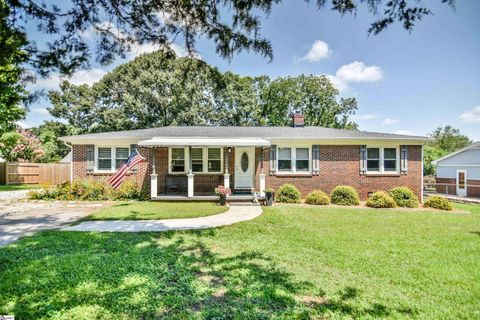
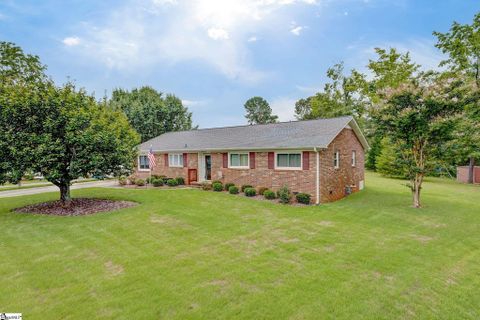
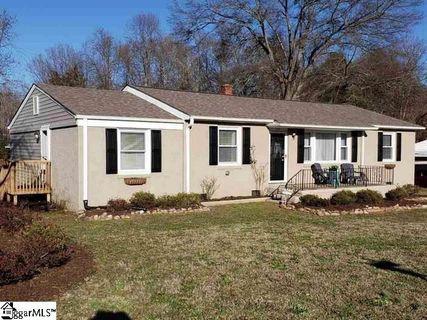
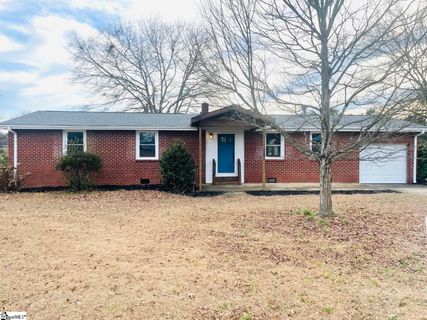
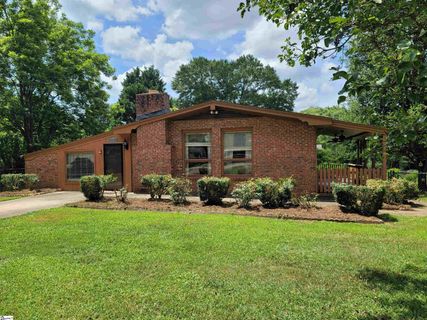
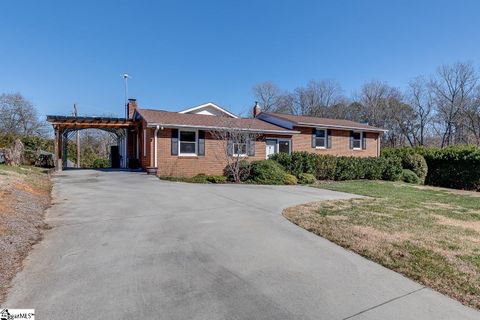
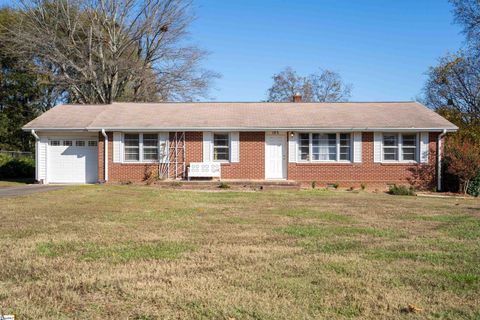
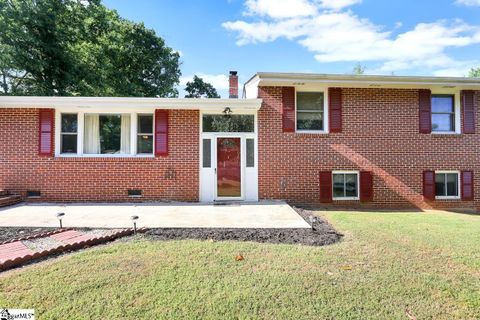
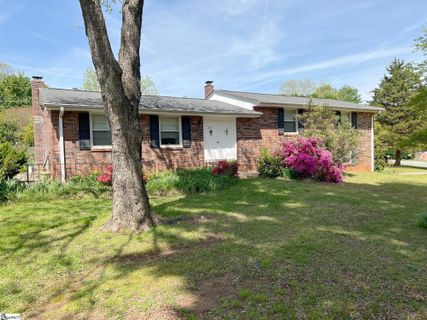
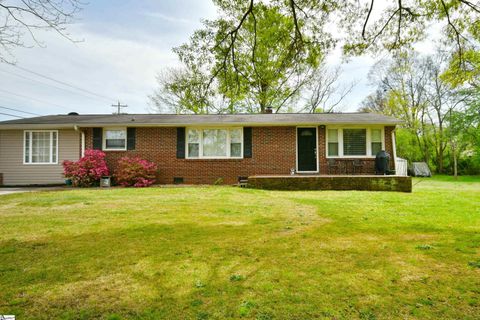
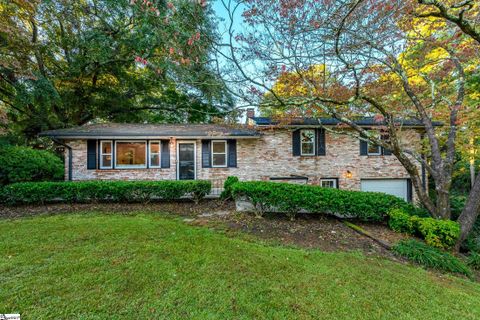
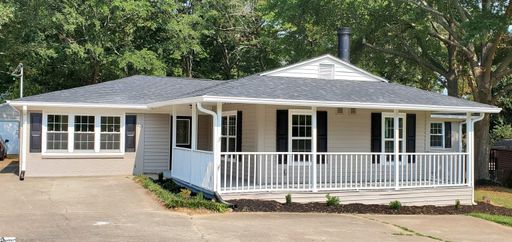
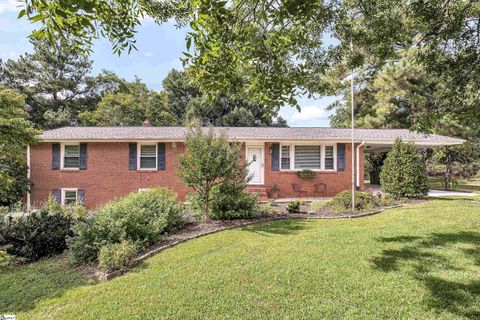
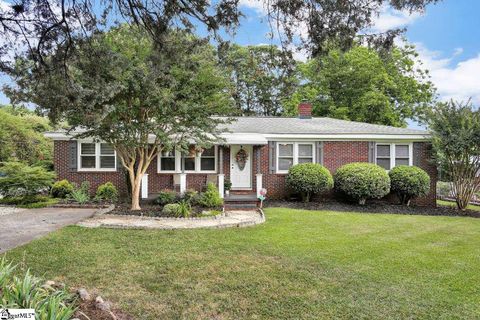
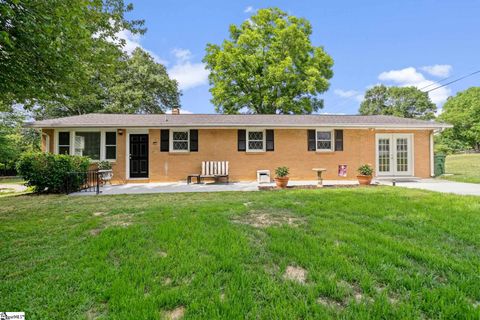
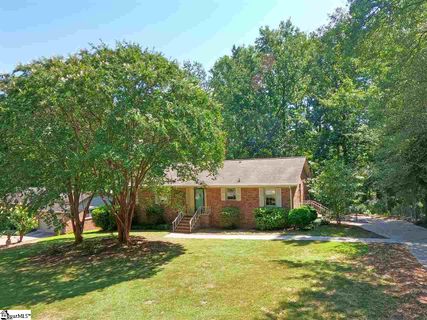
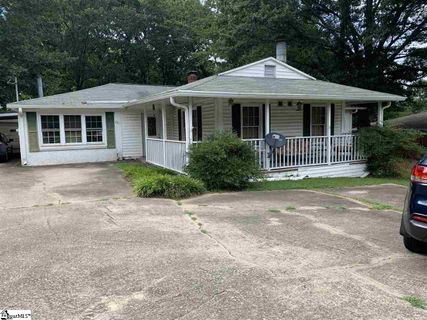
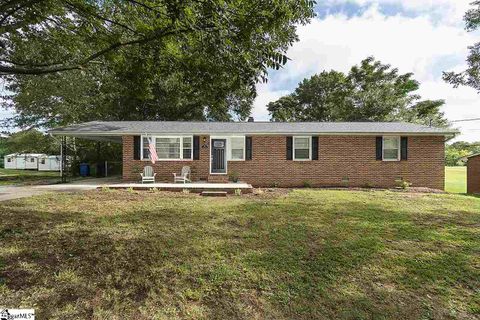
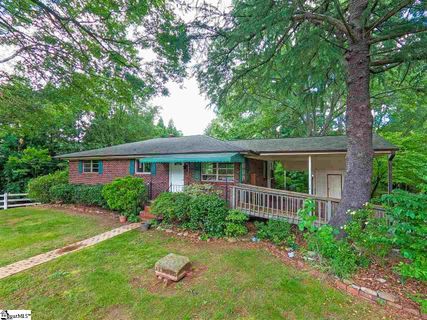
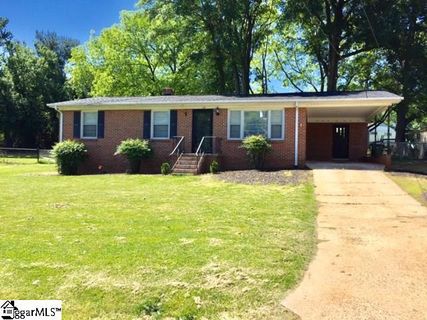
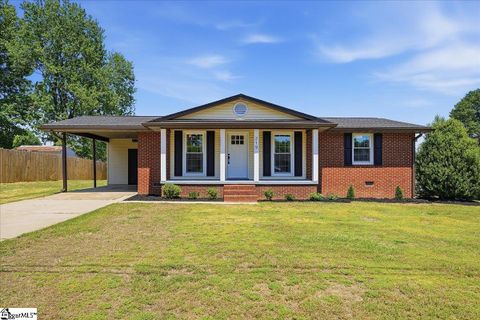
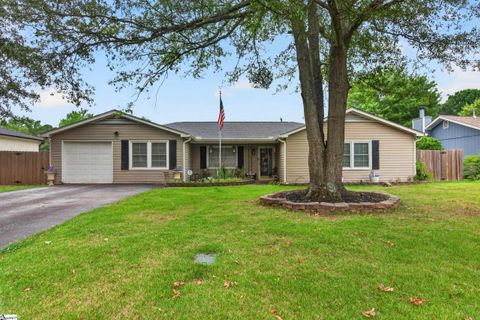
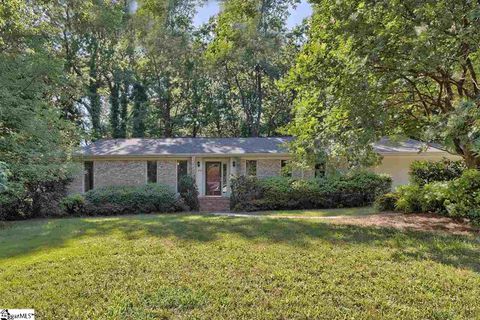
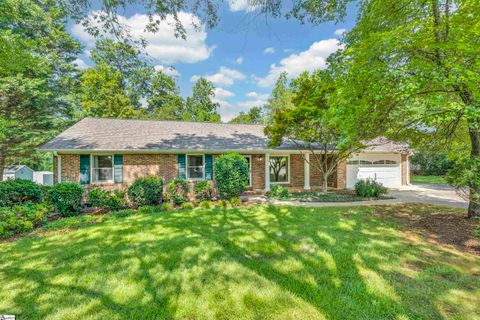
Brick construction appears throughout Glendale, with many homes built during the neighborhood''s core development era from the late 1950s through the mid-1980s. These homes share hallmarks of their era: hardwood floors (frequently refinished or preserved), wood-burning fireplaces, rocking-chair front porches, and substantial rear decks that open onto private, fenced backyards. Lot sizes typically range from about 0.4 to over an acre, with a number of properties exceeding that. Workshops, detached garages, and outbuildings are common—practical features that agents consistently highlight. The neighborhood has no HOA, a detail prominently noted in listings and clearly valued by buyers who appreciate the added flexibility it provides.
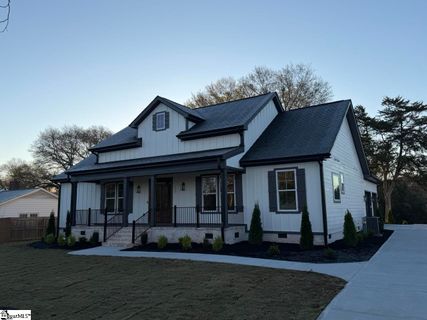
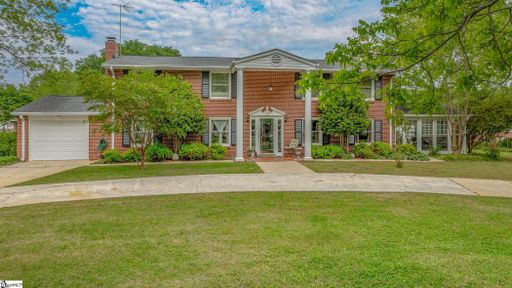
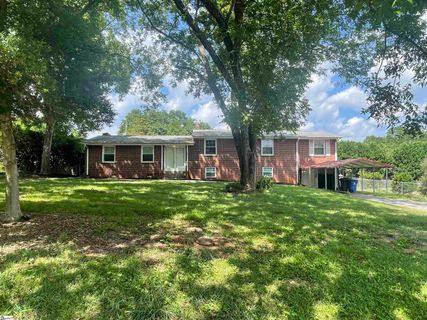
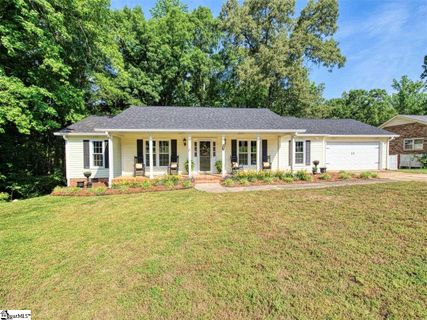
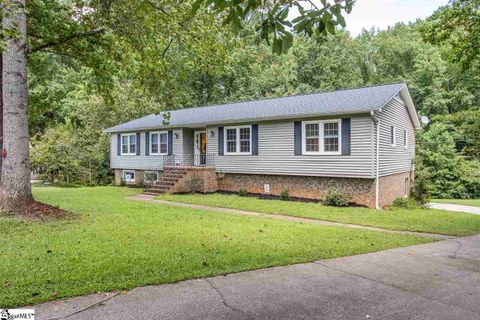
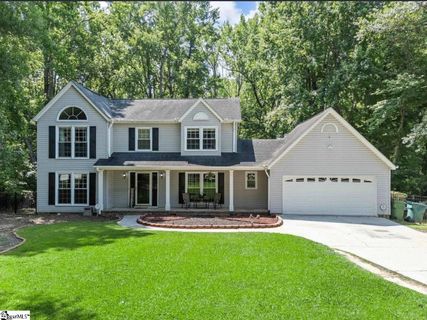
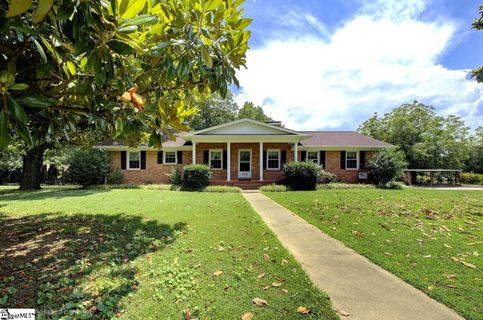
Glendale''s open layout and mature landscaping create a natural setting enhanced by Gilder Creek, which runs along the eastern edge of the neighborhood and is noted in listings for its wooded backdrop and wildlife. Homes with creek-side settings carry particular appeal for those drawn to the natural character of the area. The neighborhood accommodates a wide range of housing, from original brick ranches to recently renovated homes and new custom construction—the latter now reaching above $600,000 on the larger lots. Several properties feature detached apartments, finished basements, or flex wings suited to multi-generational arrangements. In-ground pools appear on a small number of properties, typically the larger lots on Bartlett Street and Fairfield Drive.
Nearby, BridgeWay Station is roughly 2 miles north and hosts a farmers market, year-round dining, and retail, while the Mauldin Cultural Center—home to the popular Amp''d Up Friday concert series and a fall BBQ festival—is within a few minutes'' drive.
Glendale is zoned for Bethel Elementary, Mauldin Middle, and Mauldin High School, schools that agents consistently reference as a neighborhood asset. Downtown Greenville is approximately 15 minutes away via I-385, which is accessible in multiple directions from the neighborhood. Simpsonville and the Woodruff Road corridor are equally close, giving residents efficient access to the broader Greenville metro. The upcoming Greenville Triumph soccer stadium, approximately 2 miles away, signals continued investment in the immediate area.
Glendale''s combination of established character, no-HOA flexibility, strong lot sizes, and proximity to Mauldin''s growing amenity base makes it one of the more distinctive in-town residential options in the 29662 zip code.
Palmetto Park Realty Team · Mauldin
Ask about Glendale — we answer fast
See what it's worth — your home's own sale history plus recent Glendale sales, free.
What's my home worth?Communities similar to Glendale
 0.8 mi
 Bethel Greene, Simpsonville
3 active · $365,000
 0.5 mi
 Verdin Estates, Mauldin
2 active · $265,000
 1.1 mi
 Emerald Oaks, Simpsonville
2 active · $507,500
 1.6 mi
 Forrester Woods, Greenville
6 active · $487,350
 2.9 mi
 Heritage Lakes, Simpsonville
2 active · $407,000
 1.4 mi
 Greenbrier, Simpsonville
2 active · $358,949
Closed sales from MLS history for Glendale, Mauldin
Glendale median sale price is $303,000; Mauldin is down 3.1%.
+2 outside price range.
The Glendale real estate market shows balanced market conditions. Homes typically sell within 54 days. With 0 active listings and 11 homes sold in the past year, a healthy balance exists between buyers and sellers.
Listings taken off the market in the past year in Glendale, Mauldin
These homes are no longer available, but they show recent pricing and listing activity in Glendale. Our agents can help you watch for new listings in this area.
Contact an agentFree account needed — create one to continue viewing homes.
Members see everything — free👋 Still browsing Glendale?
Full photos, price history, and every active & pending home in Glendale with a free account.
Palmetto Park Realty Team
Check your messages
We sent a code to .
Verify your number and we'll text you price drops and new Glendale listings. 1–2 texts a month, stop anytime.
Enjoy full access to this home and every home on Palmetto Park.