Active
New
$424,900 $238/sqft
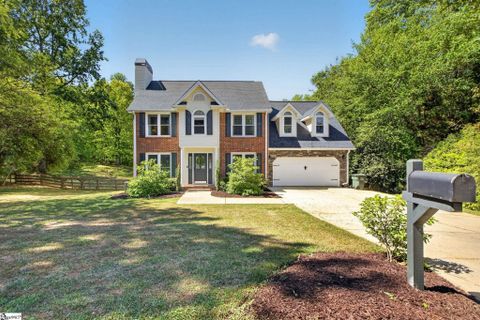
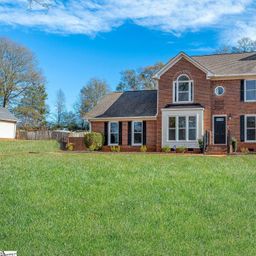
151 Tymberbrook Drive
Lyman, SC 29365
3 bd · 2 ba · 1,782 sqft · 1994 · 13 d ago
Fireplace Garage
Tymberbrook in Lyman has the feel of an established residential pocket with room to breathe.
Community overview based on MLS listing data for Tymberbrook, Lyman
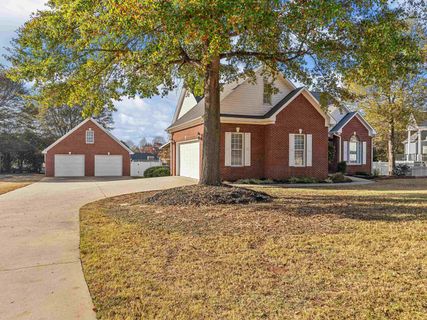
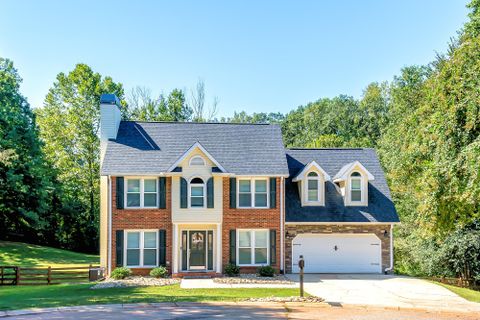
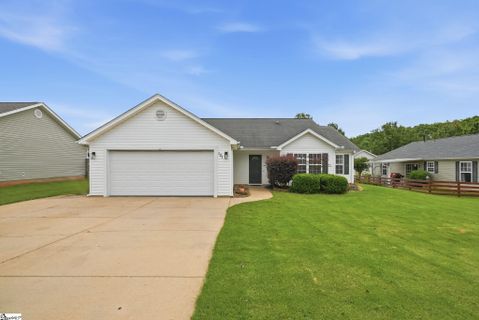
Tymberbrook in Lyman has the feel of an established residential pocket with room to breathe. Lots are generous, the setting leans wooded and river-oriented, and the neighborhood’s appeal comes through in its custom homes, cul-de-sac streets, and the way many properties open to mature trees or the Middle Tyger River. The tone is unhurried and residential, but not sleepy; homes here have been updated, expanded, and reimagined over time, giving the community a layered, lived-in character.
"A spacious river-side setting gives Tymberbrook its most memorable sense of place."
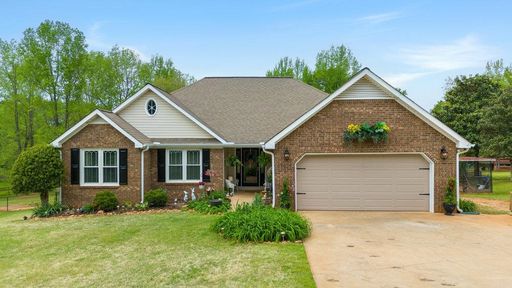
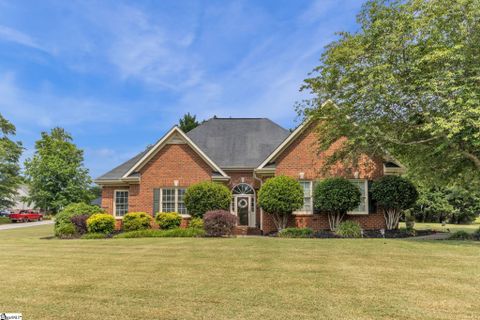
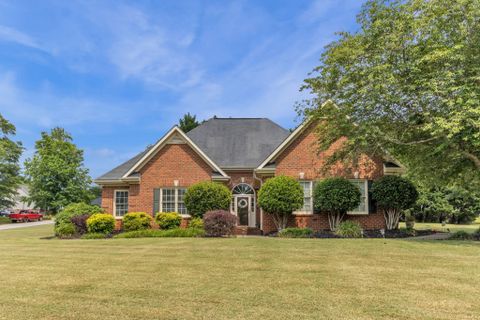
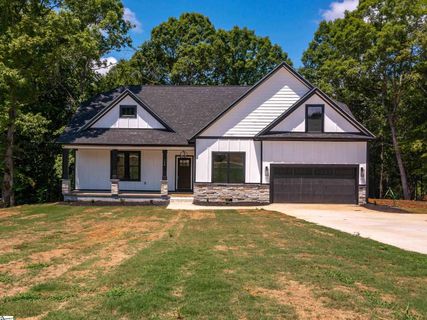
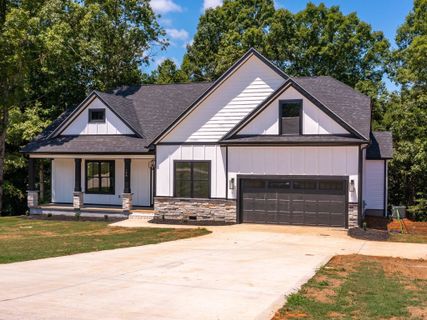
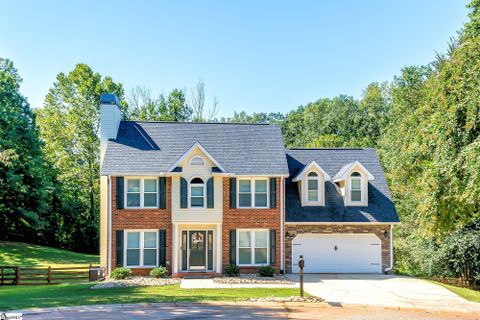
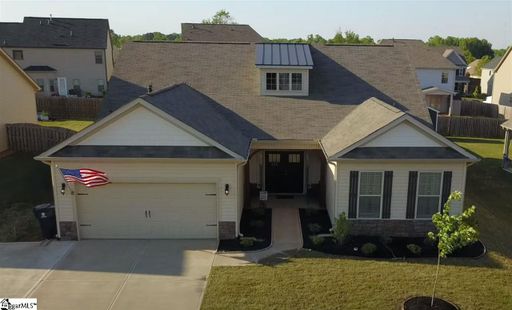
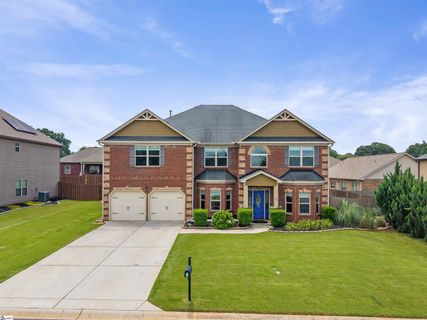
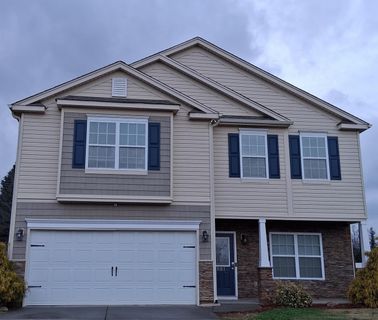
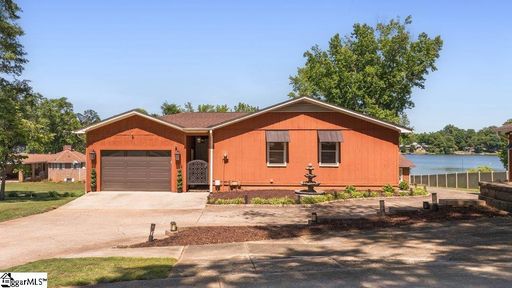
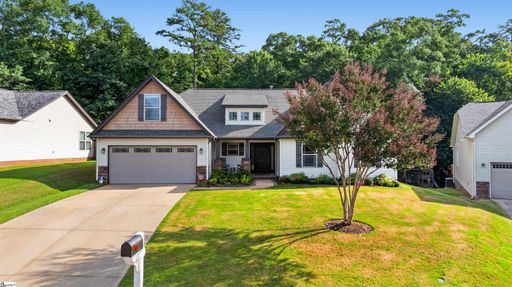
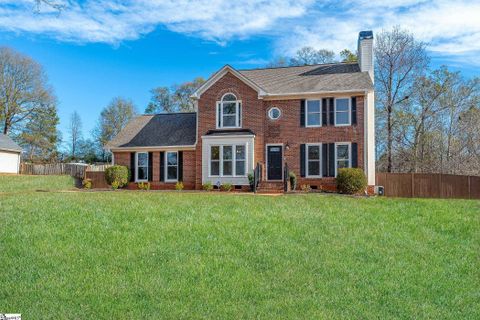
Single-family homes define the neighborhood, and the architecture ranges from classic ranches to two-story and one-and-a-half-story plans. Brick shows up often enough to shape the streetscape, especially in ranch-style homes, while other properties mix stone, vinyl, and updated exterior finishes. Interiors tend to emphasize open layouts, vaulted or cathedral ceilings, fireplaces, sunrooms, bonus rooms, and flexible spaces that work well for everyday living or entertaining. Garages are common, and larger lots are a major part of the appeal, with many homes sitting on roughly half an acre or more.
The community also has a strong outdoor component. Several homes highlight decks, fenced yards, porches, and private backdrops, while a few properties enjoy direct river frontage or river views. That blend of established landscaping and natural edge gives Tymberbrook a more spacious, less compressed feel than many newer subdivisions.
Tymberbrook’s daily rhythm is shaped more by home life and outdoor space than by a dense amenity package. Private pools appear on some properties, and outdoor living features such as screened porches, fire pits, covered decks, and large backyards are recurring themes. The neighborhood’s scale and lot sizes make it easy to imagine a slower pace at home, with plenty of room for gardening, gathering, or simply enjoying the setting.
"Large lots, river views, and flexible floor plans define the neighborhood’s everyday appeal."
Tymberbrook sits in Lyman with a practical position between Greenville and Spartanburg, and remarks also place it near downtown Greer. One listing notes it is just minutes from Highway 29, while others mention less than a 20-minute drive to the Greenville-Spartanburg Airport or BMW. Nearby destinations called out in listing remarks include downtown Greer, Lyman Lake, Greer Golf, and the Middle Tyger River. School assignments commonly point to Lyman Elementary, Dr. Hill Middle, and Byrnes High, and the community is also described as being zoned for Spartanburg District 5. That combination of regional access, recognizable nearby destinations, and established school routing helps define Tymberbrook as a well-situated residential enclave with a distinctly local feel.
Palmetto Park Realty Team · Lyman
Ask about Tymberbrook — we answer fast
See what it's worth — your home's own sale history plus recent Tymberbrook sales, free.
What's my home worth?Communities similar to Tymberbrook
Showing 1-48+ recently sold in Tymberbrook, Lyman
| Property | Sold | Sold Price | Days on Market | Size | Sold to Ask | Sold $/SF |
|---|---|---|---|---|---|---|
| | Jun 15 2026 | $485,000 | 48 | 2,610 sq ft | 100.0% | $186 |
| | Jun 13 2024 | $405,000 | 33 | 1,650 sq ft | 101.3% | $245 |
| | Jun 13 2024 | $405,000 | 34 | 1,605 sq ft | 101.3% | $252 |
| | May 7 2024 | $430,000 | 318 | 2,216 sq ft | 96.4% | $194 |
| | May 7 2024 | $430,000 | 319 | 2,130 sq ft | 96.4% | $202 |
| | Apr 15 2024 | $620,000 | 152 | 3,294 sq ft | 99.2% | $188 |
| | May 6 2023 | $482,500 | 111 | 2,900 sq ft | 96.5% | $166 |
| | May 5 2023 | $482,500 | 184 | 2,950 sq ft | 96.5% | $164 |
| | May 5 2023 | $482,500 | 111 | 2,940 sq ft | 96.5% | $164 |
| | Nov 4 2022 | $425,000 | 42 | 2,610 sq ft | 100.0% | $163 |
| | Nov 4 2022 | $425,000 | 43 | 2,230 sq ft | 100.0% | $191 |
| | May 20 2022 | $326,500 | 106 | 2,274 sq ft | 102.0% | $144 |
| | Mar 14 2022 | $385,000 | 38 | 2,335 sq ft | 101.3% | $165 |
| | Feb 18 2022 | $379,900 | 27 | 2,436 sq ft | 100.0% | $156 |
| | Feb 11 2022 | $340,000 | 114 | 1,938 sq ft | 100.0% | $175 |
| | Sep 27 2021 | $380,900 | 37 | 2,898 sq ft | 100.3% | $131 |
| | Sep 27 2021 | $380,900 | 38 | 2,898 sq ft | 100.3% | $131 |
| | Aug 16 2021 | $415,000 | 45 | 3,099 sq ft | 100.0% | $134 |
| | Aug 16 2021 | $415,000 | 46 | 3,099 sq ft | 100.0% | $134 |
| | Jul 30 2021 | $419,500 | 60 | 2,615 sq ft | 100.0% | $160 |
| | Jul 1 2021 | $468,000 | 48 | 2,485 sq ft | 106.4% | $188 |
| | Jun 9 2021 | $332,000 | 42 | 2,649 sq ft | 102.2% | $125 |
| | Jun 9 2021 | $332,000 | 43 | 2,680 sq ft | 102.2% | $124 |
| | Jun 8 2021 | $305,000 | 49 | 2,260 sq ft | 107.0% | $135 |
| | Feb 5 2021 | $270,000 | 73 | 1,901 sq ft | 98.2% | $142 |
| | Oct 29 2020 | $32,500 | 199 | — | 81.3% | — |
| | Aug 17 2020 | $339,900 | 51 | 2,647 sq ft | 100.0% | $128 |
| | Aug 17 2020 | $339,900 | 52 | 3,000 sq ft | 100.0% | $113 |
| | Aug 5 2020 | $35,000 | 114 | — | 87.5% | — |
| | Dec 3 2019 | $245,000 | 65 | 2,250 sq ft | 96.1% | $109 |
| | Feb 15 2019 | $205,000 | 73 | 1,830 sq ft | 100.0% | $112 |
| | Nov 9 2018 | $265,000 | 48 | 2,262 sq ft | 96.4% | $117 |
| | Aug 3 2018 | $38,500 | 16 | — | 96.3% | — |
| | Aug 3 2018 | $38,500 | 16 | — | 96.3% | — |
| | Apr 16 2018 | $30,000 | 85 | — | 65.2% | — |
| | Apr 16 2018 | $30,000 | 84 | — | 78.9% | — |
| | Nov 30 2017 | $284,000 | 24 | 2,900 sq ft | 99.6% | $98 |
| | Nov 17 2017 | $369,000 | 58 | 3,900 sq ft | 100.0% | $95 |
| | Nov 17 2017 | $369,000 | 59 | 3,290 sq ft | 100.0% | $112 |
| | Oct 23 2017 | $42,000 | 30 | — | 93.3% | — |
| | Sep 15 2017 | $214,900 | 86 | 2,028 sq ft | 100.0% | $106 |
| | Sep 8 2017 | $217,500 | 142 | 2,194 sq ft | 89.0% | $99 |
| | Sep 8 2017 | $196,000 | 58 | 2,168 sq ft | 100.0% | $90 |
| | Sep 8 2017 | $225,000 | 143 | 2,194 sq ft | 92.0% | $103 |
| | Sep 8 2017 | $196,000 | 59 | 2,168 sq ft | 100.0% | $90 |
| | Jun 29 2017 | $39,900 | 159 | — | 100.0% | — |
| | May 31 2017 | $180,000 | 112 | 2,010 sq ft | 98.4% | $90 |
| | Jul 6 2016 | $212,000 | 61 | 2,004 sq ft | 98.7% | $106 |
Closed sales from MLS history for Tymberbrook, Lyman
Tymberbrook median sale price is $430,000; Lyman is up 1.0%.
The Tymberbrook real estate market shows buyer's market conditions. Homes typically sell within 80 days. With 1 active listing and 1 home sold in the past year, buyers have more negotiating power and time to decide.
Free account needed — create one to continue viewing homes.
Members see everything — free👋 Still browsing Tymberbrook?
Full photos, price history, and every active & pending home in Tymberbrook with a free account.
Palmetto Park Realty Team
 $425K
$425KCheck your messages
We sent a code to .
Verify your number and we'll text you price drops and new Tymberbrook listings. 1–2 texts a month, stop anytime.
Enjoy full access to this home and every home on Palmetto Park.