Active
$899,000 $406/sqft
244 Lake View Court
Lavonia, GA 30553
3 bd · 2 ba · 2,217 sqft · 1981 · 1 mo ago
Fireplace Water Garage
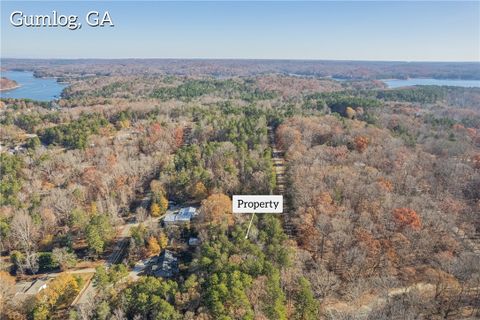
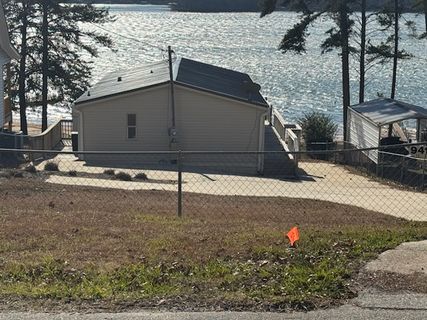
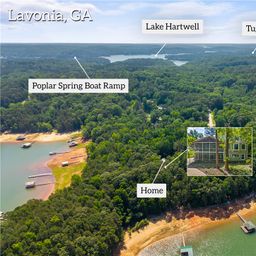
Hartwell Shores is a Lake Hartwell neighborhood in the Poplar Springs area of Lavonia where the defining draw is direct access to the water without requiring every property to carry full waterfront pricing.
Community overview based on MLS listing data for Hartwell Shores, Lavonia
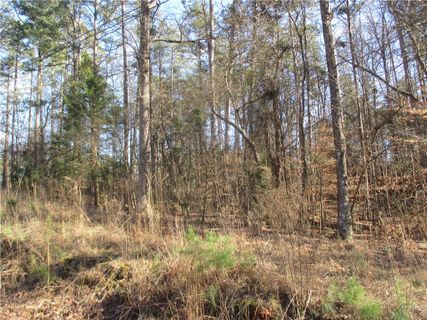
Hartwell Shores is a Lake Hartwell neighborhood in the Poplar Springs area of Lavonia where the defining draw is direct access to the water without requiring every property to carry full waterfront pricing. The subdivision mixes true lakefront homes, interior homes with slip-dock or ramp access, and a handful of homesites, creating a broad price range that stretches from entry-level lots to waterfront sales that have reached $569,000.
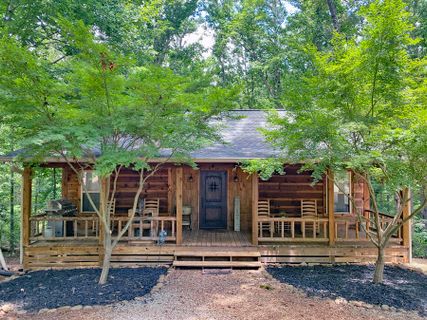
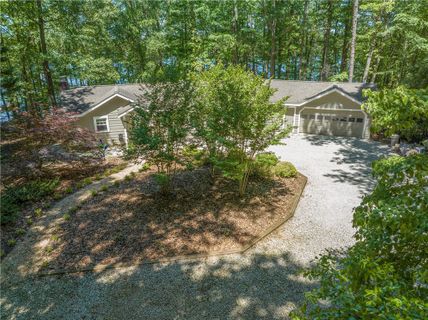
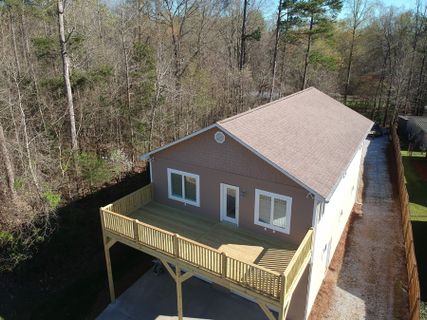
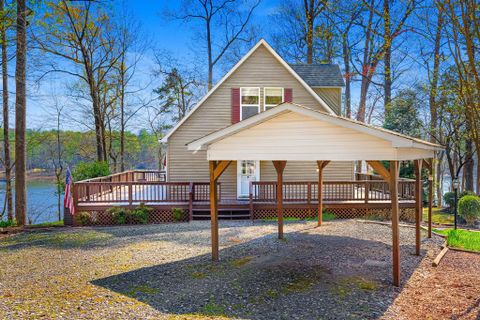
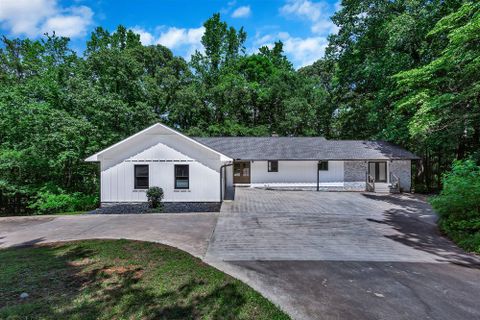
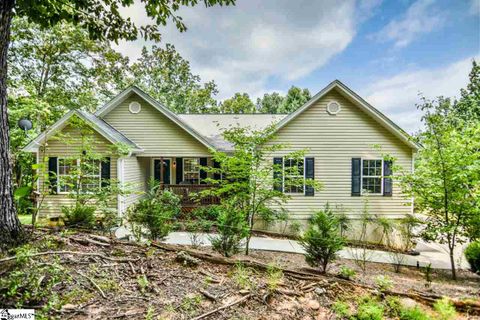
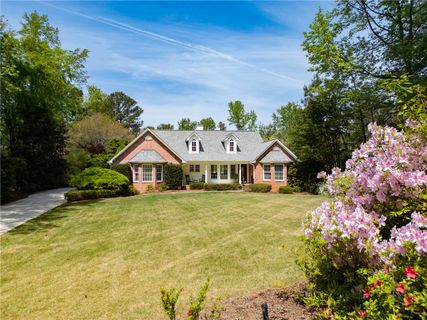
The housing stock spans from the mid-1960s to 2009 and centers on detached homes with roughly three bedrooms and just over two bathrooms on average. Architectural character is informal and lake-oriented rather than uniform, with rustic cabins, log homes, ranch-style layouts, and updated lake houses all appearing in the neighborhood. Screened porches, open living and dining areas, fireplaces, decks facing the water, and vaulted or cathedral ceilings show up repeatedly, which fits the way many properties are positioned around views, dock access, and time outdoors.
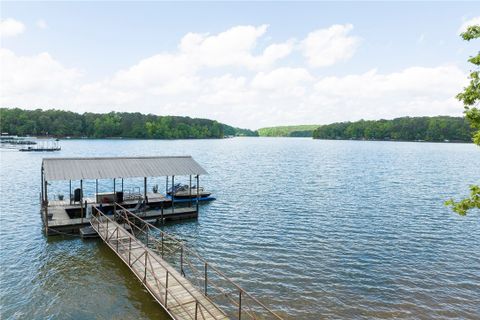
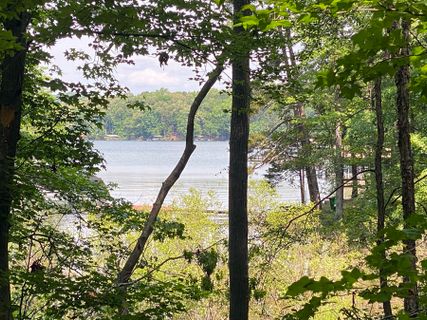
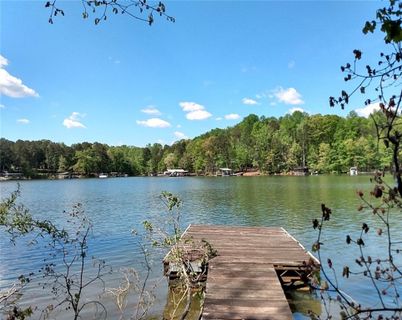
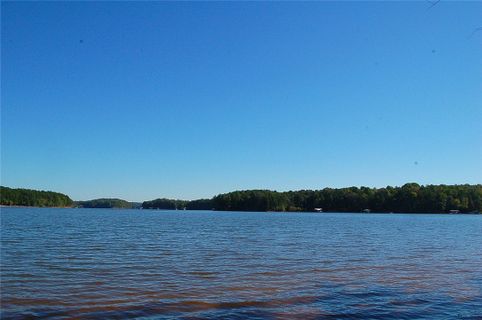
Lake access is the constant thread. Nearly three-quarters of recorded listings are waterfront, and even several non-waterfront properties are marketed around boat slips, nearby launch points, or access to the subdivision recreation area. Community amenities mentioned throughout the listing history include a boat ramp, courtesy or community dock access, picnic space, a clubhouse or gathering area, and a volleyball court. Several homes also reference gentle walks to covered slip docks, main-channel frontage, or deep-water views, which gives the neighborhood a stronger boating focus than a typical inland subdivision.
Outdoor living is a major part of the housing stock. Screened porches appear often, open decks are common, and some of the higher-priced homes add long-water views, private points, or broad shoreline frontage. Lake View Court stands out as the top-performing street by average closed price among repeat-sale streets, helped by nearly level waterfront lots and strong view corridors.
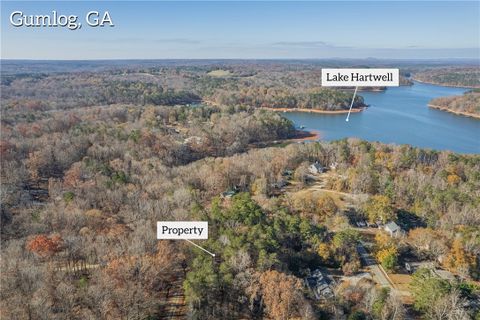
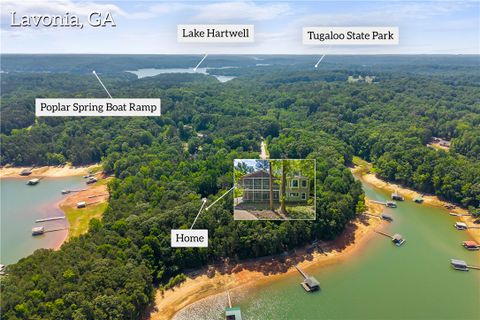
Hartwell Shores sits about 10 minutes from I-85 Exit 173, a location detail that appears throughout the listing history and supports access into Lavonia as well as regional travel toward Greenville and Atlanta. Poplar Springs boat ramp, Poplar Springs Recreation Area, Tugaloo State Park, and downtown Lavonia are all part of the neighborhood orbit. Franklin County schools serve the area.
Hartwell Shores works best for buyers who want a practical Lake Hartwell setting with real water access, flexible home styles, and a location that keeps boating close while preserving straightforward highway connectivity.
Palmetto Park Realty Team · Lavonia
Ask about Hartwell Shores — we answer fast
See what it's worth — your home's own sale history plus recent Hartwell Shores sales, free.
What's my home worth?Communities similar to Hartwell Shores
 1.7 mi
 Brittany Hbr N, Lavonia
2 active · $636,950
 2.0 mi
 Port Bass, Fair Play
7 active · $229,999
 4.3 mi
 Tugaloo Bay, Lavonia
4 active · $556,000
 2.3 mi
 Chickasaw Point, Westminster
64 active · $52,500
 3.6 mi
 Heritage Shores, Fair Play
2 active · $559,500
 5.8 mi
 Westlake, Westminster
3 active · $335,000
26 recently sold in Hartwell Shores, Lavonia
| Property | Sold | Sold Price | Days on Market | Size | Sold to Ask | Sold $/SF |
|---|---|---|---|---|---|---|
| | Aug 7 2025 | $260,820 | 27 | 2,598 sq ft | 94.8% | $100 |
| | Sep 10 2024 | $525,000 | 126 | 1,288 sq ft | 95.5% | $408 |
| | Sep 4 2024 | $14,500 | 28 | — | 90.6% | — |
| | Jun 1 2023 | $569,000 | 27 | 1,290 sq ft | 100.0% | $441 |
| | May 19 2023 | $5,500 | 154 | — | 73.3% | — |
| | May 19 2023 | $5,500 | 154 | — | 73.3% | — |
| | Feb 27 2023 | $4,350 | 20 | — | 87.1% | — |
| | Oct 29 2021 | $10,000 | 162 | — | 100.0% | — |
| | Sep 16 2021 | $105,000 | 145 | — | 91.3% | — |
| | Jun 3 2021 | $253,000 | 62 | 3,000 sq ft | 97.7% | $84 |
| | Apr 1 2021 | $52,500 | 563 | — | 60.0% | — |
| | Dec 22 2020 | $222,000 | 77 | 1,834 sq ft | 98.7% | $121 |
| | Mar 2 2020 | $412,000 | 502 | 2,875 sq ft | 93.8% | $143 |
| | Feb 28 2019 | $307,500 | 531 | 1,880 sq ft | 87.9% | $164 |
| | Nov 14 2017 | $124,900 | 115 | 1,390 sq ft | 100.0% | $90 |
| | Mar 31 2017 | $170,000 | 118 | — | 97.1% | — |
| | Oct 14 2016 | $35,000 | 361 | 1,200 sq ft | 77.8% | $29 |
| | Apr 20 2016 | $157,500 | 167 | 2,675 sq ft | 95.5% | $59 |
| | Apr 15 2016 | $313,500 | 260 | 3,412 sq ft | 99.5% | $92 |
| | Mar 31 2016 | $210,000 | 332 | 3,000 sq ft | 96.1% | $70 |
| | Nov 13 2015 | $145,000 | 245 | 1,817 sq ft | 93.5% | $80 |
| | May 12 2015 | $135,000 | 18 | 1,446 sq ft | 96.4% | $93 |
| | Mar 2 2015 | $48,000 | 277 | 1,248 sq ft | 88.1% | $38 |
| | Jan 23 2015 | $7,000 | 360 | — | 100.0% | — |
| | Nov 25 2014 | $250,000 | 161 | 1,400 sq ft | 100.0% | $179 |
| | Jun 19 2014 | $90,000 | 1131 | 932 sq ft | 90.1% | $97 |
Closed sales from MLS history for Hartwell Shores, Lavonia
Not enough recent sales in Hartwell Shores to chart a trend.
The Hartwell Shores real estate market shows buyer's market conditions. Homes typically sell within 157 days. With 1 active listing and 1 home sold in the past year, buyers have more negotiating power and time to decide.
Free account needed — create one to continue viewing homes.
Members see everything — free👋 Still browsing Hartwell Shores?
Full photos, price history, and every active & pending home in Hartwell Shores with a free account.
Palmetto Park Realty Team
 $899K
$899KCheck your messages
We sent a code to .
Verify your number and we'll text you price drops and new Hartwell Shores listings. 1–2 texts a month, stop anytime.
Enjoy full access to this home and every home on Palmetto Park.