Active
Homesite
$199,000
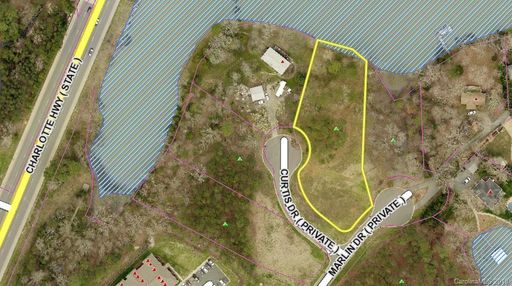
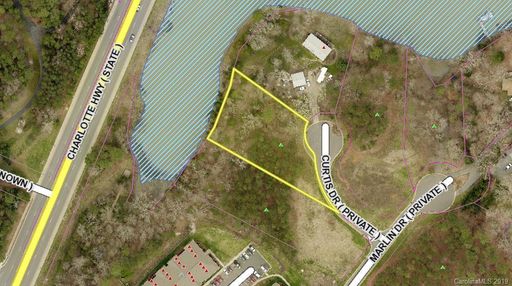
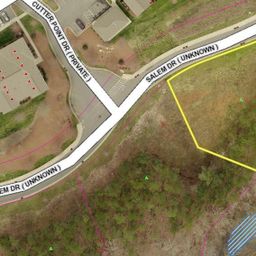
1715 Curtis Drive
Lake Wylie, SC 29710
7 yr ago
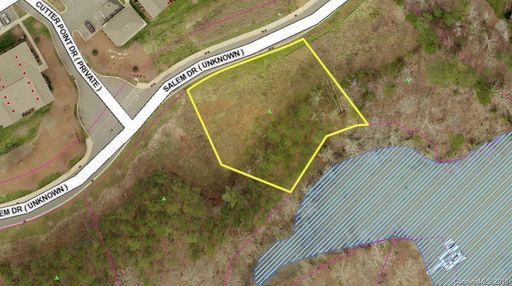
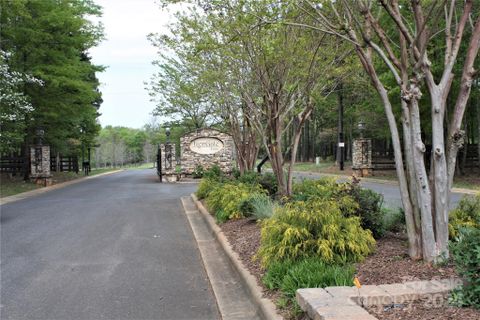
Marlin Bay in Lake Wylie reads like a lakeside lot community built around the view as much as the land itself.
Community overview based on MLS listing data for Marlin Bay, Lake Wylie
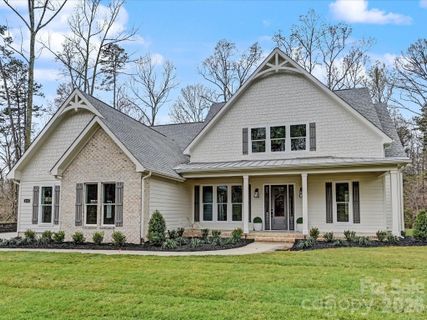
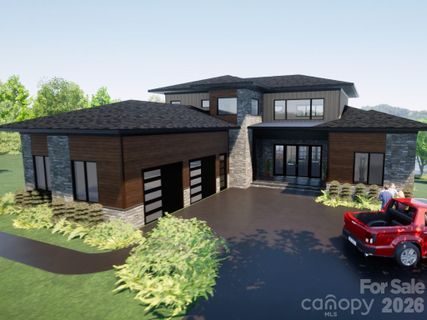
Marlin Bay in Lake Wylie reads like a lakeside lot community built around the view as much as the land itself. The setting leans into big-sky water scenery, with cove access, sunset-facing outlooks, and a strong sense of openness that comes from generous lot sizes. The homesites are ready for custom plans, so the neighborhood’s personality is shaped less by cookie-cutter construction and more by the opportunity to create something tailored to the lake.
"Marlin Bay is defined by water views, open lots, and the chance to build a true lake retreat."
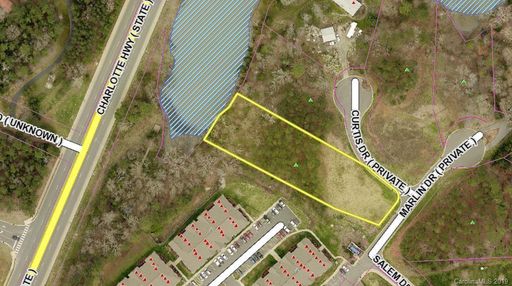
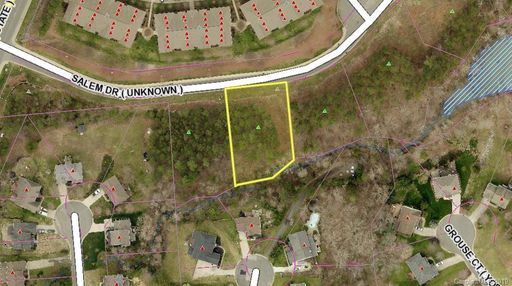
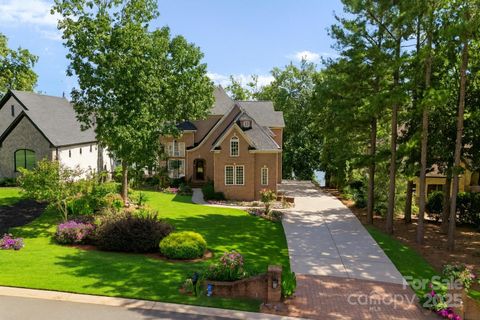
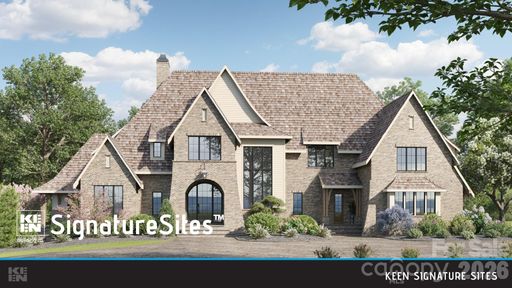
This is primarily a residential lot community rather than one with a broad mix of finished home types. The parcels are substantial, averaging just under 0.8 acres, and the street pattern includes addresses along Curtis Drive, Salem Drive, and Marlin Drive. That scale gives the neighborhood a spacious, low-density feel that suits custom construction. Public remarks point to a clear vision for future homes: at least 1,800 heated square feet and two-car garages, which suggests a more substantial build standard even though the lots themselves are the main offering today.
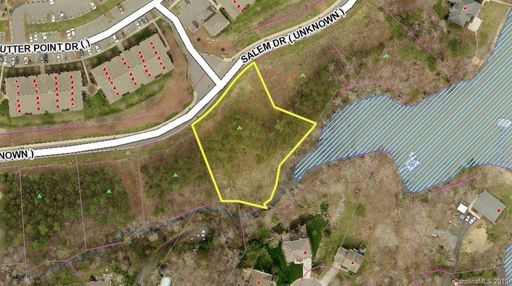
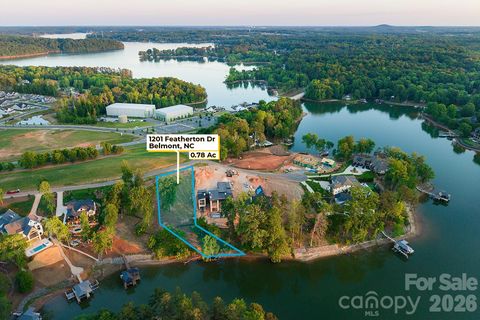
The most memorable feature here is the relationship to the lake. Several listings emphasize waterfront or waterview settings, fishing and paddling in the cove, and the ability to head out to the main channel for faster water recreation. It is the kind of place where the landscape does a lot of the work.
Marlin Bay’s daily rhythm is shaped by the water and the broad, build-ready parcels. There are no shared amenities called out in the listing details, so the appeal stays focused on private lot ownership and the surrounding lake environment. The community feels especially suited to buyers who want room, views, and a blank canvas rather than a packed amenity roster.
"Here, the lake is the amenity, and the homesites are the invitation."
Marlin Bay sits in the Lake Wylie area of York County, in the broader Charlotte metro edge of the South Carolina Piedmont. The community’s school pattern is Crowders Creek Elementary, Oakridge Middle, and Clover High, placing it within the Clover school corridor. Nearby conveniences are not spelled out in the remarks, so the strongest location cues are the local roads and the lake setting itself. For drivers, the neighborhood sits in the Lake Wylie area rather than a dense town center, which keeps the focus on a more tucked-away waterfront setting while still remaining tied to the Clover/Lake Wylie service area.
Palmetto Park Realty Team · Lake Wylie
Ask about Marlin Bay — we answer fast
See what it's worth — your home's own sale history plus recent Marlin Bay sales, free.
What's my home worth?Communities similar to Marlin Bay
 2.7 mi
 Southern Pine Lake, Clover
6 active · $172,400
 3.6 mi
 McLean - South Shore, Clover
4 active · $1,370,000
 6.6 mi
 Irongate Farm, Clover
3 active · $139,900
 5.0 mi
 Reflection Pointe, Belmont
38 active · $139,950
 3.8 mi
 McLean Hunts Point, Belmont
2 active · $604,500
 4.0 mi
 The Sanctuary, Charlotte
11 active · $1,795,000
6 recently sold in Marlin Bay, Lake Wylie
| Property | Sold | Sold Price | Days on Market | Size | Sold to Ask | Sold $/SF |
|---|---|---|---|---|---|---|
| | Apr 14 2025 | $185,000 | 2029 | — | 93.0% | — |
| | Dec 29 2023 | $90,000 | 1557 | — | 91.8% | — |
| | Aug 29 2022 | $90,000 | 1070 | — | 90.9% | — |
| | Aug 29 2022 | $218,000 | 1070 | — | 96.9% | — |
| | Oct 15 2021 | $300,000 | 739 | — | 83.4% | — |
| | Oct 27 2020 | $270,000 | 399 | — | 90.3% | — |
Closed sales from MLS history for Marlin Bay, Lake Wylie
Below trend-line threshold — city median shown for context
The Marlin Bay real estate market shows buyer's market conditions. Homes typically sell within 1070 days. With 3 active listings and 0 homes sold in the past year, buyers have more negotiating power and time to decide.
Free account needed — create one to continue viewing homes.
Members see everything — free👋 Still browsing Marlin Bay?
Full photos, price history, and every active & pending home in Marlin Bay with a free account.
Palmetto Park Realty Team
 $219K
$219K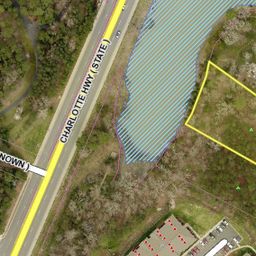 $199K
$199K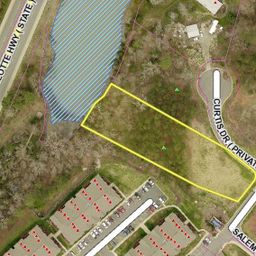 $189K
$189KCheck your messages
We sent a code to .
Verify your number and we'll text you price drops and new Marlin Bay listings. 1–2 texts a month, stop anytime.
Enjoy full access to this home and every home on Palmetto Park.