Pending
$250,000 $226/sqft
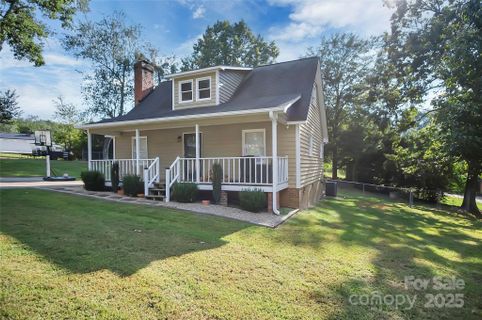
203 Williams Road
Kings Mountain, NC 28086
3 bd · 1 ba · 1,104 sqft · 1985 · 5 mo ago
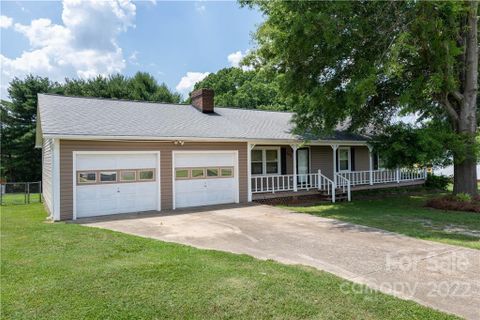
Fireplace Garage
Williamsburg Acres has the feel of a small Kings Mountain pocket where larger lots, simple ranch plans, and practical updates set the tone.
Community overview based on MLS listing data for Williamsburg Acres, Kings Mountain
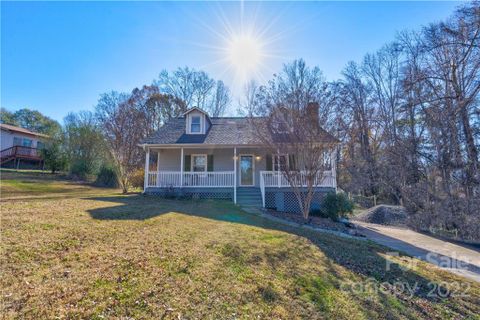
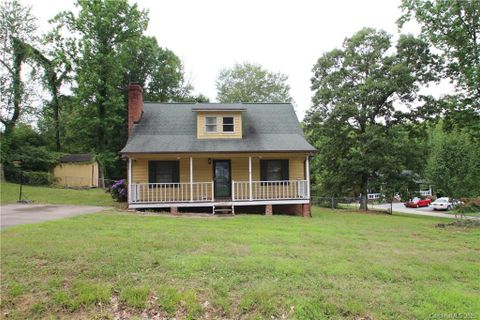
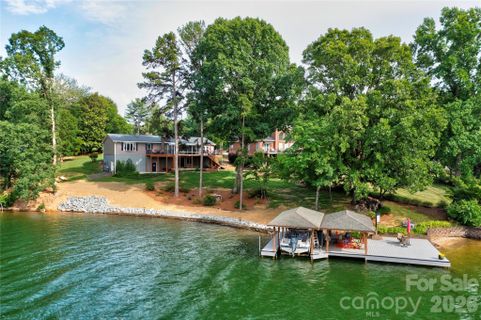
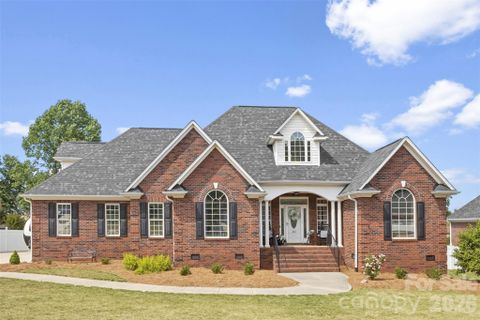
Williamsburg Acres has the feel of a small Kings Mountain pocket where larger lots, simple ranch plans, and practical updates set the tone. Homes here were built mostly in the mid-to-late 1980s, and the streets show a comfortable, lived-in character rather than a polished new-build look. Front porches, fenced backyards, and generous outdoor space come up again and again, giving the neighborhood an easy residential rhythm.
"This is a place where everyday comfort and usable outdoor space carry the day."
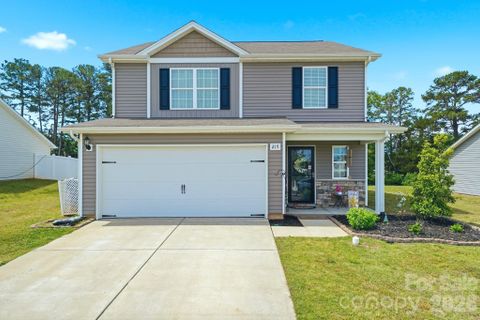
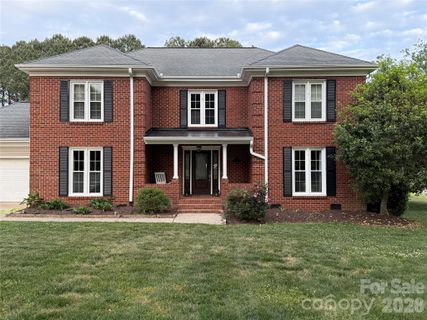
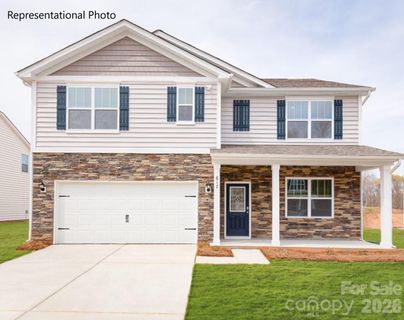
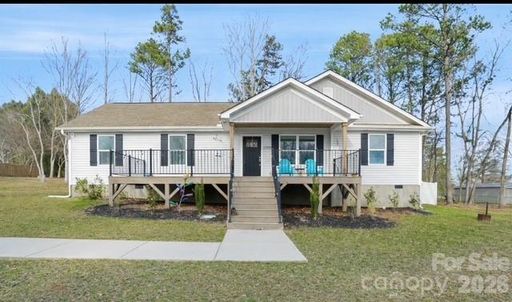
The housing stock is centered on single-family homes, often with three bedrooms and one or two baths, and many of the interiors have been refreshed with granite counters, stainless appliances, updated flooring, or newer mechanicals. Some homes lean traditional with fireplaces, crown molding, and rocking-chair porches, while others bring a more straightforward ranch layout with practical storage and attached garages. Lot sizes are notably spacious for the area, which helps the homes feel set apart from one another and gives yards room to breathe. Brick appears in some listings, but the overall picture is more varied than uniform.
The neighborhood’s appeal is in its mix of usable space and straightforward house plans. A few properties include outbuildings, decks, or even a pool, while others focus on fenced yards and easy indoor-outdoor flow. It is the kind of community where owners can personalize without needing to start from scratch.
Daily life in Williamsburg Acres revolves around the home itself: covered porches, back decks, patios, and backyard gathering space. Several homes offer fenced yards, and garage space appears often enough to be a meaningful part of the neighborhood’s character. The setting feels residential and practical, with enough yard area to support gardening, storage, or simple outdoor living. One of the strongest themes is flexibility—some homes are move-in ready, while others invite cosmetic updating without requiring major reconstruction.
"Spacious lots and functional homes give the neighborhood a relaxed, grounded pace."
Williamsburg Acres sits in Kings Mountain with direct access to the Hwy 74 corridor, and several listings note quick reach to I-85 as well. That makes the neighborhood especially well placed for commuting toward surrounding cities, including Shelby and Gastonia, while still keeping everyday errands within the Kings Mountain area. The community is associated with Bethlehem Elementary, Kings Mountain Middle, and Kings Mountain High, placing it within the local school network that serves the city. For buyers who want a straightforward residential setting with road access that keeps regional travel simple, Williamsburg Acres is an easy place to understand and navigate.
Palmetto Park Realty Team · Kings Mountain
Ask about Williamsburg Acres — we answer fast
See what it's worth — your home's own sale history plus recent Williamsburg Acres sales, free.
What's my home worth?Communities similar to Williamsburg Acres
 2.3 mi
 Woodbridge, Kings Mountain
5 active · $550,000
 3.3 mi
 Beason Creek, Kings Mountain
8 active · $304,950
 4.1 mi
 Gold Run, Kings Mountain
2 active · $634,950
 3.8 mi
 Brinkley Ridge, Kings Mountain
15 active · $349,000
 4.4 mi
 Hall Crossing, Kings Mountain
2 active · $532,450
 3.1 mi
 Clinestead, Shelby
2 active · $369,500
5 recently sold in Williamsburg Acres, Kings Mountain
| Property | Sold | Sold Price | Days on Market | Size | Sold to Ask | Sold $/SF |
|---|---|---|---|---|---|---|
| | Dec 23 2025 | $295,000 | 95 | 1,682 sq ft | 99.3% | $175 |
| | Dec 18 2025 | $276,000 | 91 | 1,438 sq ft | 98.6% | $192 |
| | Jan 18 2023 | $255,000 | 57 | 1,700 sq ft | 100.0% | $150 |
| | Aug 8 2022 | $169,900 | 67 | 1,125 sq ft | 100.0% | $151 |
| | Aug 14 2020 | $114,000 | 52 | 1,682 sq ft | 96.6% | $68 |
Closed sales from MLS history for Williamsburg Acres, Kings Mountain
Below trend-line threshold — city median shown for context
The Williamsburg Acres real estate market shows buyer's market conditions. Homes typically sell within 62 days. With 1 active listing and 2 homes sold in the past year, buyers have more negotiating power and time to decide.
Free account needed — create one to continue viewing homes.
Members see everything — free👋 Still browsing Williamsburg Acres?
Full photos, price history, and every active & pending home in Williamsburg Acres with a free account.
Palmetto Park Realty Team
 $250K
$250KCheck your messages
We sent a code to .
Verify your number and we'll text you price drops and new Williamsburg Acres listings. 1–2 texts a month, stop anytime.
Enjoy full access to this home and every home on Palmetto Park.