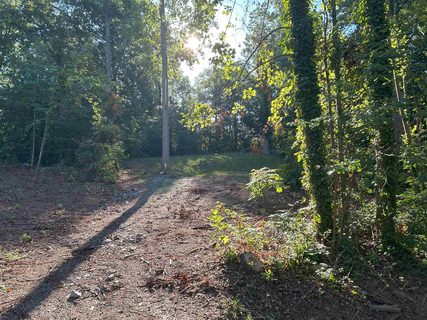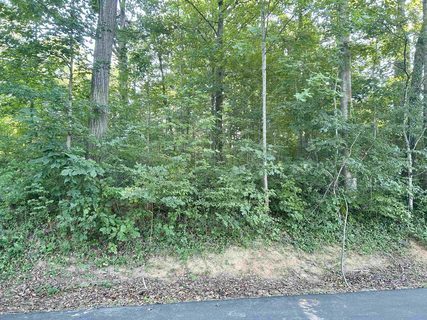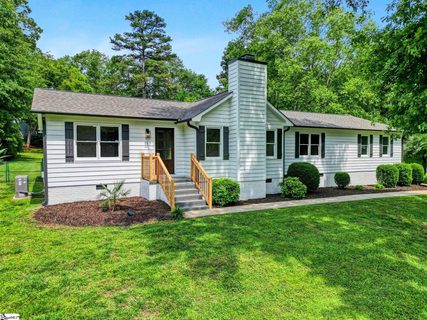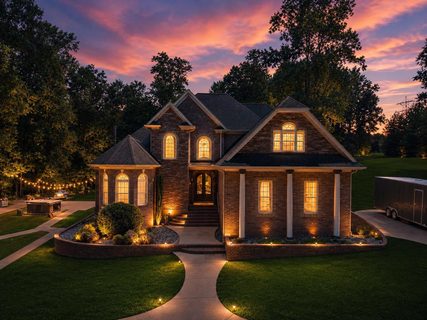
Active
New
$335,000 $188/sqft
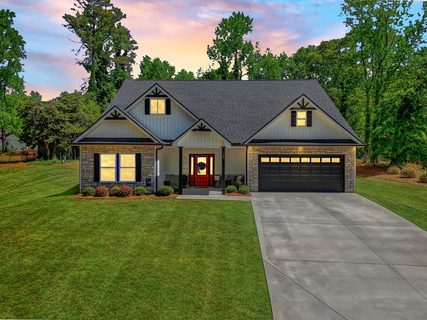
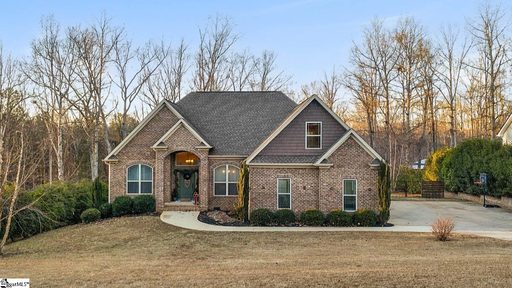
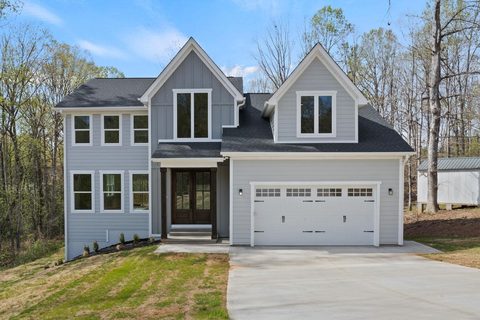
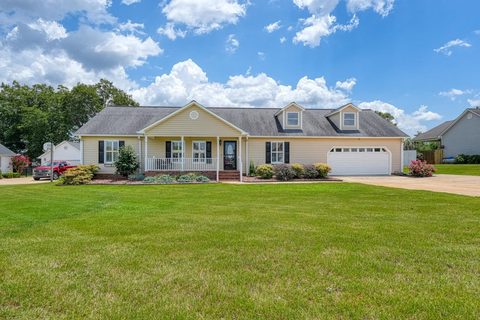
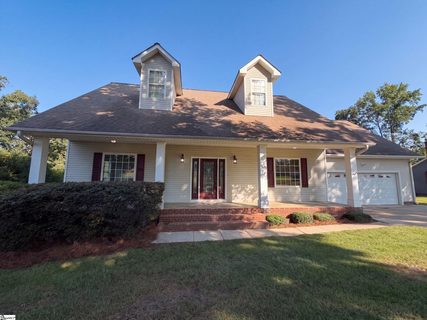
189 Victoria Drive
Inman, SC 29349
3 bd · 2 ba · 1,781 sqft · 7 d ago
Fireplace Garage
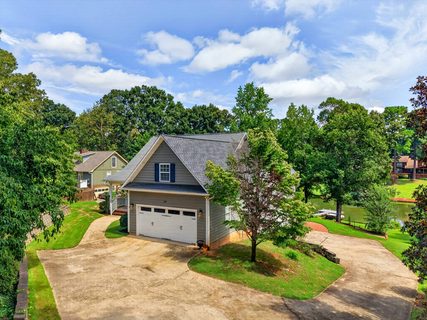
Clark Estates sits in Inman's Lake Bowen pocket, where the neighborhood's highest-value addresses line Lake Bowen Drive and the broader subdivision offers roomy residential lots just minutes from the landing and Boiling Springs conveniences.
Community overview based on MLS listing data for Clark Estates, Inman
Clark Estates sits in Inman's Lake Bowen pocket, where the neighborhood's highest-value addresses line Lake Bowen Drive and the broader subdivision offers roomy residential lots just minutes from the landing and Boiling Springs conveniences. Homes here span a long arc from 1970s originals to recent construction in 2025, so the streetscape feels varied rather than uniform, with interior lots and waterfront addresses sharing the same low-density setting.
Clark Estates is best known for its Lake Bowen connection. Waterfront and water-view homes on Lake Bowen Drive and nearby coves reach the top of the neighborhood's price range, with closed sales climbing to $1.46 million and repeatedly highlighting private docks, covered docks, open-water views, and mountain backdrops. Even away from the shoreline, the community's home sites are generous: lots begin around half an acre, the median lot is about 28,314 square feet, and the overall average is roughly 0.78 acres.
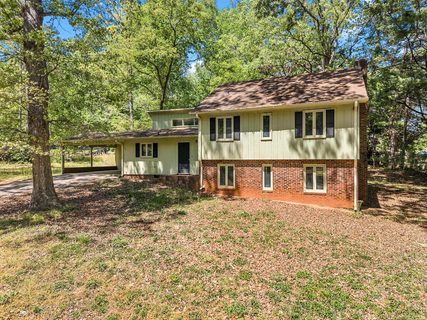
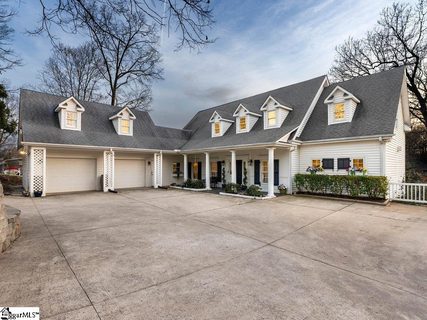
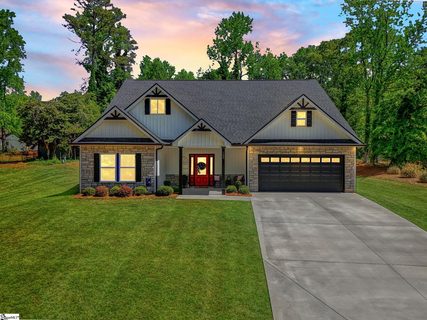
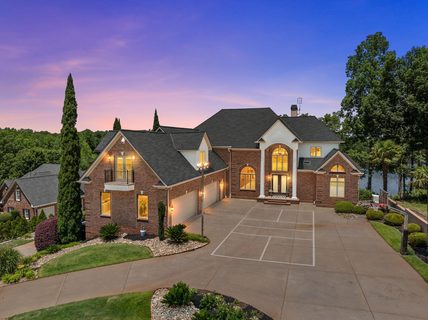
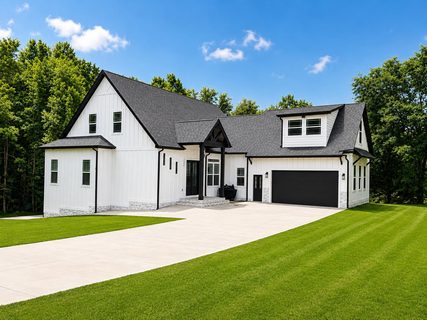
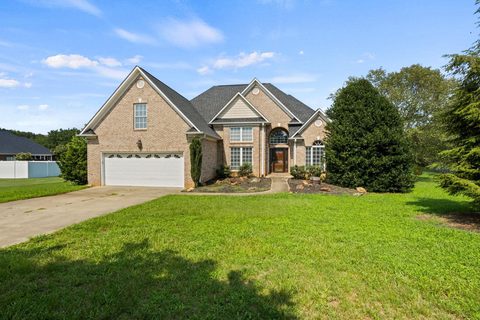
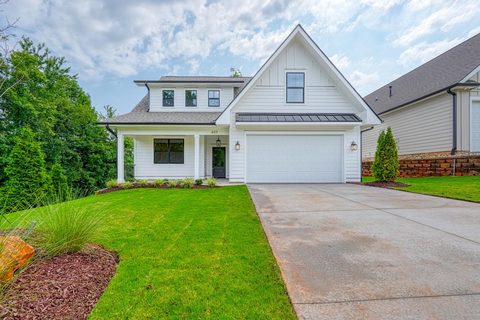
The architectural mix is equally broad. The neighborhood's core dates to the 1970s, but later infill and new construction extend into the 2000s, 2010s, and 2020s. Exteriors are mixed, with siding, stone, and some brick appearing across listings rather than one dominant material. Inside, recurring features include open living areas, fireplaces, vaulted ceilings, updated kitchens with granite or quartz surfaces, and attached garages. Basements are also a meaningful part of the housing stock, especially in homes that step toward the lake.
Clark Estates does not read like a pool-and-clubhouse subdivision; its appeal is more property-driven. The standout recreational feature is direct Lake Bowen access, whether that means a private dock, room for boat parking, or a house positioned for water and mountain views. Pools do appear, but as individual backyard amenities rather than a neighborhood complex, and several listings emphasize decks, screened porches, covered back porches, and fenced yards designed around outdoor use.
Interior streets such as Pine Cove Drive, Wild Azalea Drive, and Lake Bowen Court add another layer to the community, with cul-de-sac lots, mature trees, occasional streams, and larger yards creating a more tucked-back residential setting behind the waterfront edge. Recent sales on Wild Azalea show that newer construction and larger interior parcels can still command strong prices even without direct shoreline frontage.
The neighborhood sits in the Lake Bowen area of northern Spartanburg County, with repeated references to Lake Bowen Landing, the Boiling Springs retail corridor, and quick access to I-26. Oakland Elementary, Boiling Springs Middle, and Boiling Springs High are the most common school assignments attached to the community. Overall, Clark Estates offers a flexible mix of lakefront opportunity, larger lots, and established residential character close to everyday shopping and regional routes.
Palmetto Park Realty Team · Inman
Ask about Clark Estates — we answer fast
See what it's worth — your home's own sale history plus recent Clark Estates sales, free.
What's my home worth?Communities similar to Clark Estates
Showing 1-48+ recently sold in Clark Estates, Inman
| Property | Sold | Sold Price | Days on Market | Size | Sold to Ask | Sold $/SF |
|---|---|---|---|---|---|---|
 102 Clark Hill Dr 4 bd · 2 ba 102 Clark Hill Dr 4 bd · 2 ba | Aug 4 2026 | $228,500 | 107 | 2,067 sq ft | 97.2% | $111 |
 158 Lake Bowen Drive 5 bd · 4 ba 158 Lake Bowen Drive 5 bd · 4 ba | Jun 29 2026 | $875,000 | 112 | 4,585 sq ft | 100.0% | $191 |
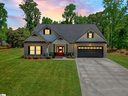 165 Lake Bowen Drive 4 bd · 3 ba 165 Lake Bowen Drive 4 bd · 3 ba | Jun 22 2026 | $510,000 | 60 | 2,491 sq ft | 94.5% | $205 |
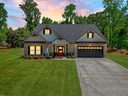 165 Lake Bowen Drive 4 bd · 3 ba 165 Lake Bowen Drive 4 bd · 3 ba | Jun 22 2026 | $510,000 | 54 | 2,491 sq ft | 94.5% | $205 |
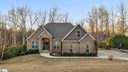 185 Victoria Drive 3 bd · 2 ba 185 Victoria Drive 3 bd · 2 ba | Apr 1 2026 | $475,000 | 99 | 2,555 sq ft | 95.0% | $186 |
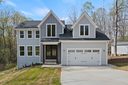 342 Wild Azalea Drive 4 bd · 3 ba 342 Wild Azalea Drive 4 bd · 3 ba | Nov 10 2025 | $575,000 | 83 | 2,830 sq ft | 97.5% | $203 |
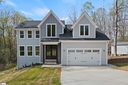 342 Wild Azalea Drive 4 bd · 3 ba 342 Wild Azalea Drive 4 bd · 3 ba | Nov 7 2025 | $570,000 | 210 | 2,830 sq ft | 96.6% | $201 |
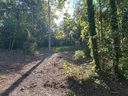 147 Lake Bowen Drive 147 Lake Bowen Drive | Aug 15 2025 | $59,000 | 21 | — | 95.2% | — |
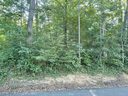 151 Lake Bowen Drive 151 Lake Bowen Drive | Aug 15 2025 | $59,000 | 21 | — | 95.2% | — |
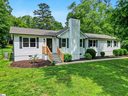 167 Lake Bowen Drive 3 bd · 2 ba 167 Lake Bowen Drive 3 bd · 2 ba | Jun 27 2025 | $450,000 | 40 | 1,808 sq ft | 98.0% | $249 |
 108 Lake Bowen Drive 4 bd · 2 ba 108 Lake Bowen Drive 4 bd · 2 ba | Mar 7 2025 | $870,000 | 140 | 2,680 sq ft | 97.8% | $325 |
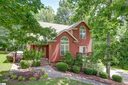 337 Wild Azalea Drive 4 bd · 3 ba 337 Wild Azalea Drive 4 bd · 3 ba | Jun 26 2024 | $355,000 | 25 | 2,139 sq ft | 101.5% | $166 |
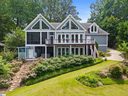 136 Lake Bowen Drive 4 bd · 4 ba 136 Lake Bowen Drive 4 bd · 4 ba | Sep 29 2023 | $1,460,000 | 36 | 4,296 sq ft | 97.3% | $340 |
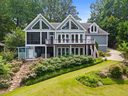 136 Lake Bowen Drive 4 bd · 4 ba 136 Lake Bowen Drive 4 bd · 4 ba | Sep 29 2023 | $1,460,000 | 37 | 2,624 sq ft | 97.3% | $556 |
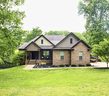 162 Lake Bowen Drive 4 bd · 2 ba 162 Lake Bowen Drive 4 bd · 2 ba | Aug 31 2023 | $765,000 | 128 | 1,847 sq ft | 95.6% | $414 |
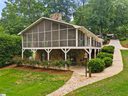 120 Lake Bowen Drive 4 bd · 3 ba 120 Lake Bowen Drive 4 bd · 3 ba | Jul 18 2023 | $749,900 | 38 | 2,550 sq ft | 100.0% | $294 |
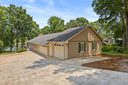 120 Lake Bowen Drive 4 bd · 3 ba 120 Lake Bowen Drive 4 bd · 3 ba | Jul 18 2023 | $749,900 | 39 | 1,300 sq ft | 100.0% | $577 |
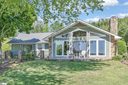 218 Pine Cove Drive 3 bd · 3 ba 218 Pine Cove Drive 3 bd · 3 ba | May 31 2023 | $412,500 | 26 | 2,210 sq ft | 99.4% | $187 |
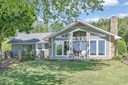 218 Pine Cove Drive 3 bd · 3 ba 218 Pine Cove Drive 3 bd · 3 ba | May 31 2023 | $412,500 | 27 | 2,210 sq ft | 99.4% | $187 |
 122 Lake Bowen Dr 4 bd · 3 ba 122 Lake Bowen Dr 4 bd · 3 ba | May 1 2023 | $485,000 | 41 | 1,536 sq ft | 88.2% | $316 |
 131 Lake Bowen Drive 4 bd · 3 ba 131 Lake Bowen Drive 4 bd · 3 ba | Apr 14 2023 | $425,000 | 246 | 3,780 sq ft | 96.7% | $112 |
 165 Lake Bowen Drive 4 bd · 3 ba 165 Lake Bowen Drive 4 bd · 3 ba | Sep 30 2022 | $444,900 | 73 | 2,505 sq ft | 100.0% | $178 |
 165 Lake Bowen Dr 4 bd · 3 ba 165 Lake Bowen Dr 4 bd · 3 ba | Sep 30 2022 | $444,900 | 76 | 2,550 sq ft | 100.0% | $174 |
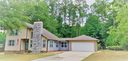 107 Lake Bowen Ct 4 bd · 3 ba 107 Lake Bowen Ct 4 bd · 3 ba | Aug 15 2022 | $479,000 | 43 | 2,400 sq ft | 99.8% | $200 |
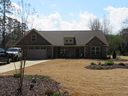 107 Clark Hill Dr 3 bd · 2 ba 107 Clark Hill Dr 3 bd · 2 ba | May 6 2022 | $337,000 | 48 | 1,758 sq ft | 100.0% | $192 |
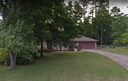 107 Lake Bowen Ct 4 bd · 2 ba 107 Lake Bowen Ct 4 bd · 2 ba | Jan 31 2022 | $220,000 | 41 | 2,266 sq ft | 95.7% | $97 |
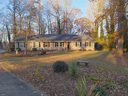 104 Clark Ct 3 bd · 2 ba 104 Clark Ct 3 bd · 2 ba | Dec 22 2021 | $245,000 | 21 | 1,779 sq ft | 104.3% | $138 |
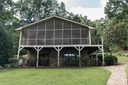 120 Lake Bowen Drive 4 bd · 3 ba 120 Lake Bowen Drive 4 bd · 3 ba | Oct 29 2020 | $515,000 | 48 | 1,300 sq ft | 103.0% | $396 |
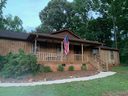 100 Lake Bowen Ct. 4 bd · 2 ba 100 Lake Bowen Ct. 4 bd · 2 ba | Oct 20 2020 | $245,000 | 86 | 1,876 sq ft | 98.0% | $131 |
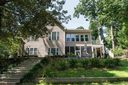 110 Lake Bowen Drive 4 bd · 3 ba 110 Lake Bowen Drive 4 bd · 3 ba | Aug 31 2020 | $580,000 | 63 | 3,674 sq ft | 96.7% | $158 |
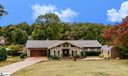 205 Pine Cove Drive 4 bd · 3 ba 205 Pine Cove Drive 4 bd · 3 ba | Jun 8 2020 | $589,900 | 227 | 2,731 sq ft | 100.0% | $216 |
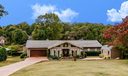 205 Pine Cove Drive 4 bd · 3 ba 205 Pine Cove Drive 4 bd · 3 ba | Jun 8 2020 | $589,900 | 227 | 2,815 sq ft | 100.0% | $210 |
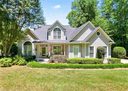 108 Lake Bowen Dr 4 bd · 2 ba 108 Lake Bowen Dr 4 bd · 2 ba | Aug 30 2019 | $525,000 | 84 | 2,550 sq ft | 98.1% | $206 |
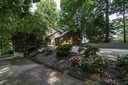 144 Lake Bowen Dr 3 bd · 3 ba 144 Lake Bowen Dr 3 bd · 3 ba | Jul 11 2019 | $430,000 | 27 | 2,732 sq ft | 100.0% | $157 |
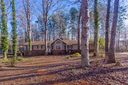 103 Clark Hill Dr 3 bd · 2 ba 103 Clark Hill Dr 3 bd · 2 ba | Feb 22 2019 | $186,500 | 17 | 2,004 sq ft | 98.2% | $93 |
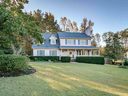 106 Lake Bowen Ct 4 bd · 2 ba 106 Lake Bowen Ct 4 bd · 2 ba | Jan 15 2019 | $204,000 | 72 | 2,335 sq ft | 102.1% | $87 |
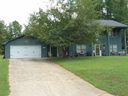 212 Pine Cove Drive 4 bd · 3 ba 212 Pine Cove Drive 4 bd · 3 ba | Sep 20 2018 | $197,000 | 61 | 2,166 sq ft | 103.7% | $91 |
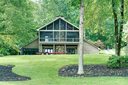 124 Lake Bowen Drive 4 bd · 2 ba 124 Lake Bowen Drive 4 bd · 2 ba | Sep 14 2018 | $450,000 | 396 | 1,229 sq ft | 91.8% | $366 |
 100 Clark Court 3 bd · 2 ba 100 Clark Court 3 bd · 2 ba | Aug 10 2018 | $158,900 | 35 | 1,600 sq ft | 99.4% | $99 |
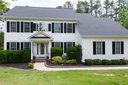 101 Loblolly Court 5 bd · 2 ba 101 Loblolly Court 5 bd · 2 ba | Jun 30 2017 | $279,900 | 57 | 2,641 sq ft | 100.0% | $106 |
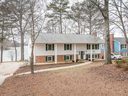 215 Pine Cove Drive 4 bd · 3 ba 215 Pine Cove Drive 4 bd · 3 ba | May 10 2017 | $377,500 | 126 | 1,540 sq ft | 94.6% | $245 |
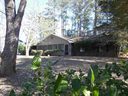 210 Pine Cove Drive 3 bd · 2 ba 210 Pine Cove Drive 3 bd · 2 ba | Mar 2 2017 | $150,000 | 164 | 2,204 sq ft | 93.8% | $68 |
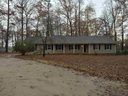 104 Clark Court 3 bd · 2 ba 104 Clark Court 3 bd · 2 ba | Jan 25 2017 | $158,000 | 56 | 1,779 sq ft | 98.8% | $89 |
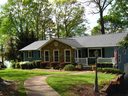 138 Lake Bowen Drive 5 bd · 4 ba 138 Lake Bowen Drive 5 bd · 4 ba | Sep 22 2016 | $486,000 | 133 | 2,808 sq ft | 97.2% | $173 |
 136 Lake Bowen Drive 3 bd · 2 ba 136 Lake Bowen Drive 3 bd · 2 ba | May 26 2016 | $185,000 | 196 | 1,832 sq ft | 88.1% | $101 |
 106 Clark Woods Drive 3 bd · 2 ba 106 Clark Woods Drive 3 bd · 2 ba | Jan 13 2015 | $199,500 | 279 | 2,180 sq ft | 100.0% | $92 |
 302 Wild Azalea 3 bd · 3 ba 302 Wild Azalea 3 bd · 3 ba | Aug 26 2014 | $173,000 | 327 | 1,812 sq ft | 97.3% | $95 |
 101 Clark Court 3 bd · 2 ba 101 Clark Court 3 bd · 2 ba | Jan 3 2014 | $116,300 | 72 | 2,152 sq ft | 95.8% | $54 |
Closed sales from MLS history for Clark Estates, Inman
Clark Estates median sale price is $510,000; Inman is up 1.2%.
+4 outside price range.
The Clark Estates real estate market shows buyer's market conditions. Homes typically sell within 75 days. With 2 active listings and 8 homes sold in the past year, buyers have more negotiating power and time to decide.