
Active
$793,520 $224/sqft
1441 Yellow Springs Drive
Huntersville, NC 28078
5 bd · 4 ba · 3,543 sqft · 2026 · 4 d ago
Fireplace Garage
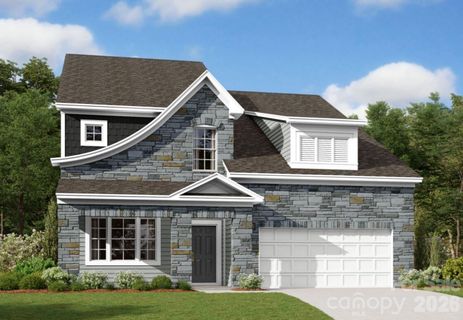
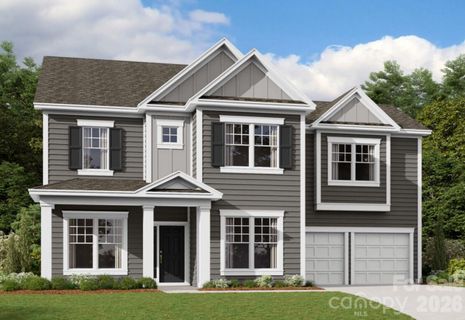
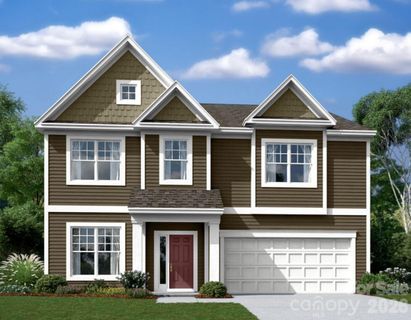
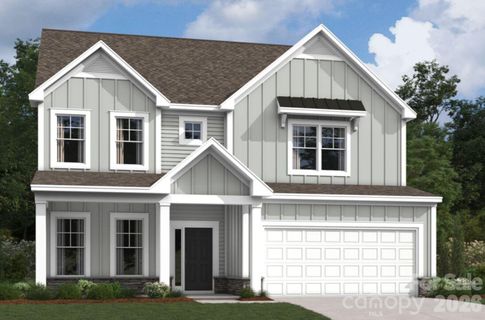
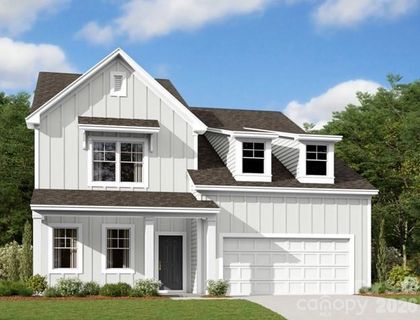
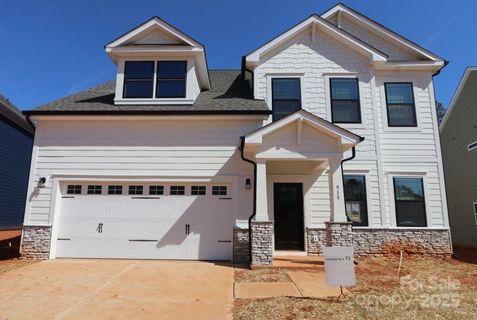
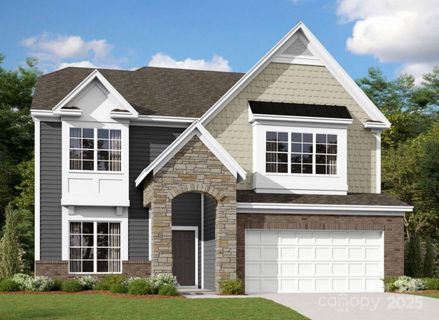
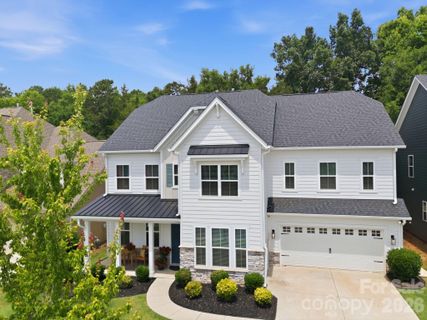
Spring Grove reads like a polished new-home enclave, with nearly every address reflecting recent construction and a consistent streetscape of modern two-story homes.
Listing summary: 4 Active3 Pending23 Recently Sold
$793,520 $224/sqft
Huntersville, NC 28078
5 bd · 4 ba · 3,543 sqft · 2026 · 4 d ago
$709,990 $209/sqft
Huntersville, NC 28078
5 bd · 4 ba · 3,393 sqft · 2026 · 4 d ago
$756,000 $218/sqft
Huntersville, NC 28078
5 bd · 4 ba · 3,471 sqft · 2026 · 4 d ago
$732,000 $170/sqft
Huntersville, NC 28078
5 bd · 4 ba · 4,297 sqft · 2026 · 4 mo ago
$627,990 $246/sqft
Huntersville, NC 28078
4 bd · 3 ba · 2,552 sqft · 2026 · 27 d ago
$769,990 $232/sqft
Huntersville, NC 28078
5 bd · 4 ba · 3,314 sqft · 2026 · 4 mo ago
$799,990 $206/sqft
Huntersville, NC 28078
6 bd · 5 ba · 3,889 sqft · 2024 · 1 yr ago
$770,000 $202/sqft
Huntersville, NC 28078
6 bd · 5 ba · 3,805 sqft · 2026 · DOM: 205 d
$777,675 $220/sqft
Huntersville, NC 28078
5 bd · 4 ba · 3,536 sqft · 2025 · DOM: 168 d
Northern Charlotte metro, Mecklenburg County, North Carolina
$781,015 $220/sqft
Huntersville, NC 28078
5 bd · 4 ba · 3,543 sqft · 2025 · DOM: 120 d
$615,000 $260/sqft
Huntersville, NC 28078
4 bd · 3 ba · 2,364 sqft · 2025 · DOM: 175 d
$623,990 $229/sqft
Huntersville, NC 28078
4 bd · 3 ba · 2,730 sqft · 2025 · DOM: 70 d
Community overview based on MLS listing data for Spring Grove, Huntersville
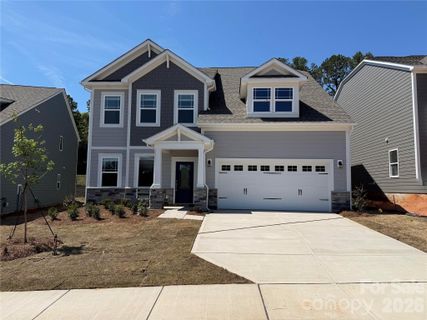
Spring Grove reads like a polished new-home enclave, with nearly every address reflecting recent construction and a consistent streetscape of modern two-story homes. The setting feels intentionally designed: covered front porches, clean rooflines, and generous garages create a crisp first impression, while the price point places the neighborhood firmly in Huntersville’s upper-middle range.
"New construction, refined finishes, and a cohesive streetscape define the everyday appeal here."
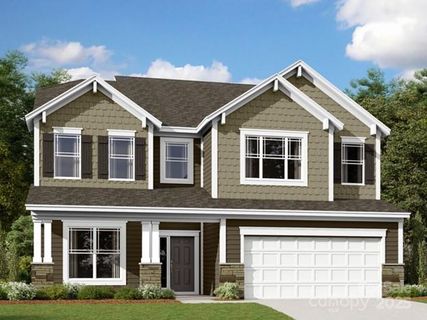
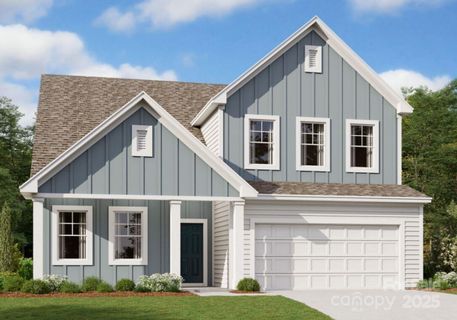
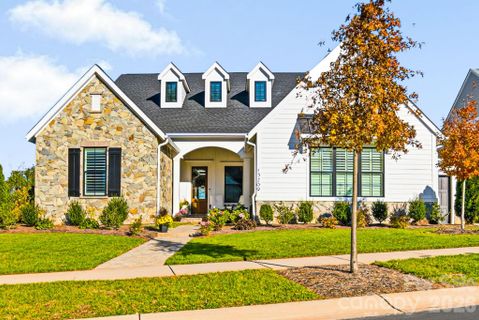
The community is made up of single-family homes, and that focus shows in the way the floor plans are laid out. Most homes offer four to six bedrooms, open main living areas, and flexible spaces such as lofts, studies, and main-level guest suites. Kitchens tend to be a centerpiece, with quartz or granite counters, gas cooktops, islands, stainless steel appliances, and walk-in pantries appearing often. Interior finishes lean toward a more elevated look, with crown molding, tray ceilings, EVP flooring, and spa-style primary baths. Garages are a constant, and that practical detail reinforces the neighborhood’s suburban, car-oriented rhythm. A small number of homes include basements, but the overall feel is more about streamlined, low-fuss new construction than extensive customization.
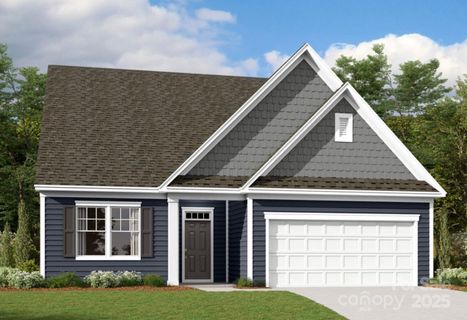
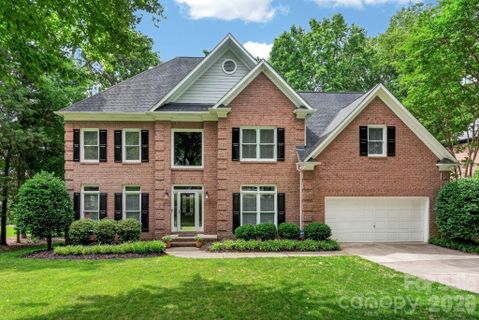
Spring Grove’s daily rhythm is shaped by the homes themselves and the neighborhood’s clean, modern presentation rather than a long list of shared amenities. Covered porches, extended patios, decks, and covered rear porches give the community a pleasant indoor-outdoor flow, and the consistent garage presence supports an easy in-and-out lifestyle. The neighborhood also carries the feel of a newer builder community, with repeat plan names and a cohesive architectural language that keeps the streetscape visually tidy. Association coverage is present across the current listings, which helps explain the orderly, well-managed impression.
"This is a place where the homes do most of the talking, with comfort and finish taking center stage."
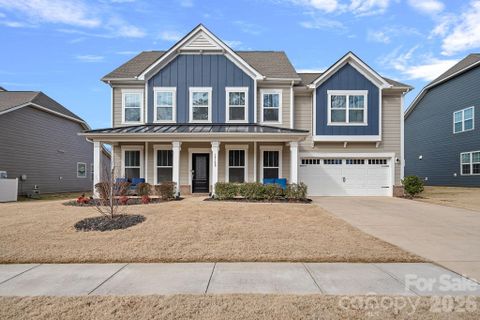
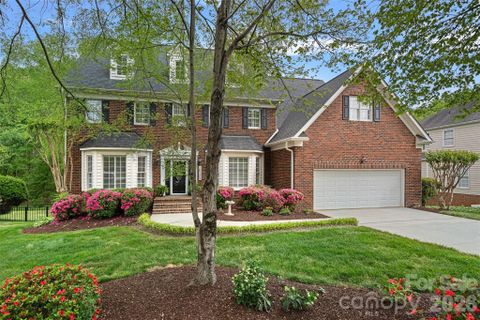
Spring Grove sits in Huntersville, in the northern Charlotte metro, with the community center around Hackney Street, Yellow Springs Drive, Mankey Drive, and Fountaindale Street. The school pattern is consistent: Huntersville Elementary, Bailey Middle, and William Amos Hough High. Public remarks do not spell out commute times to specific highways or downtowns, so the clearest story here is the neighborhood’s Huntersville setting and its established school assignment pattern. For buyers who want a newer-home pocket with a cohesive look and a straightforward suburban location, Spring Grove delivers that in a very recognizable way.
Talk to a local agent about homes in Spring Grove, Huntersville
Communities similar to Spring Grove
 0.6 mi
 Northbrook, Huntersville
3 active · $699,999
 1.5 mi
 Walden, Huntersville
6 active · $802,500
 1.0 mi
 Oak Farm, Huntersville
3 active · $1,650,000
 0.6 mi
 Northstone, Huntersville
18 active · $724,950
 1.1 mi
 The Hamptons, Huntersville
6 active · $939,950
 1.6 mi
 Belleterre, Huntersville
3 active · $249,500
23 recently sold in Spring Grove, Huntersville
| Property | Sold | List Price | DOM | Size | List $/SF |
|---|---|---|---|---|---|
| | Apr 24 2026 | $770,000 | 205 | 3,805 sq ft | $202 |
| | Apr 21 2026 | $777,675 | 168 | 3,536 sq ft | $220 |
| | Apr 16 2026 | $781,015 | 120 | 3,543 sq ft | $220 |
| | Apr 14 2026 | $615,000 | 175 | 2,364 sq ft | $260 |
| | Mar 17 2026 | $623,990 | 70 | 2,730 sq ft | $229 |
| | Dec 31 2025 | $731,255 | 166 | 3,524 sq ft | $208 |
| | Nov 20 2025 | $639,999 | 210 | 2,618 sq ft | $244 |
| | Oct 29 2025 | $682,000 | 35 | 3,029 sq ft | $225 |
| | Oct 28 2025 | $683,380 | 91 | 3,010 sq ft | $227 |
| | Oct 16 2025 | $679,950 | 90 | 3,400 sq ft | $200 |
| | Sep 23 2025 | $639,905 | 39 | 2,854 sq ft | $224 |
| | Sep 17 2025 | $769,875 | 135 | 3,543 sq ft | $217 |
| | Aug 28 2025 | $628,990 | 234 | 2,854 sq ft | $220 |
| | Aug 27 2025 | $694,990 | 139 | 3,393 sq ft | $205 |
| | Aug 27 2025 | $669,990 | 125 | 2,972 sq ft | $225 |
| | Jul 24 2025 | $738,395 | 208 | 3,405 sq ft | $217 |
| | Apr 29 2025 | $699,950 | 286 | 2,854 sq ft | $245 |
| | Apr 17 2025 | $728,895 | 189 | 3,314 sq ft | $220 |
| | Apr 17 2025 | $684,000 | 192 | 2,854 sq ft | $240 |
| | Apr 15 2025 | $784,760 | 251 | 3,528 sq ft | $222 |
| | Apr 10 2025 | $729,390 | 267 | 3,411 sq ft | $214 |
| | Mar 20 2025 | $791,945 | 235 | 3,609 sq ft | $219 |
| | Mar 18 2025 | $736,010 | 243 | 3,010 sq ft | $245 |
Aggregated from MLS listing history for Spring Grove, Huntersville
The Spring Grove real estate market shows buyer's market conditions. Homes typically sell within 175 days. With 7 active listings and 16 homes sold in the past year, buyers have more negotiating power and time to decide.