Active
$325,000 $148/sqft
1968 8th Street Lane
Hickory, NC 28602
4 bd · 2 ba · 2,200 sqft · 2001 · 22 d ago
Garage
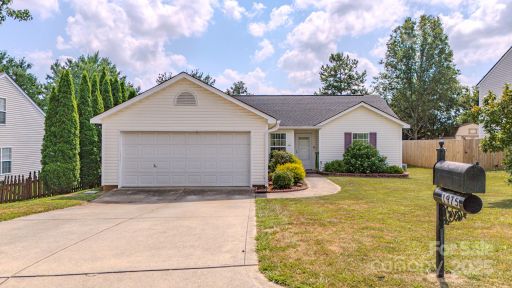
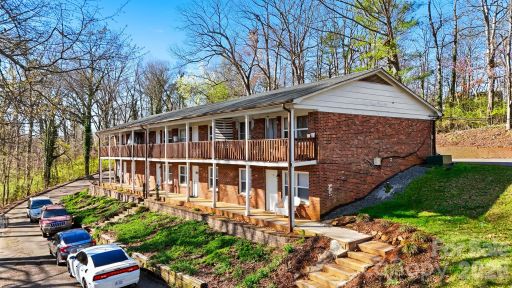
Windsong Village has the feel of an established Hickory neighborhood that has kept evolving without losing its easygoing residential character.
Community overview based on MLS listing data for Windsong Village, Hickory
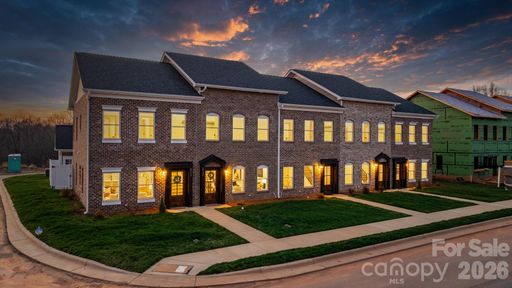
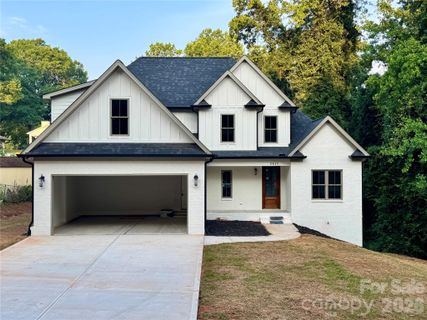
Windsong Village has the feel of an established Hickory neighborhood that has kept evolving without losing its easygoing residential character. The streets are lined with mostly single-family homes, and the setting is defined by practical curb appeal, level homesites, and a clear emphasis on everyday livability. New construction is still appearing alongside early-2000s homes, so the neighborhood has a layered look that feels current without being overbuilt.
"A well-kept Hickory neighborhood where classic layouts and newer builds meet everyday convenience."
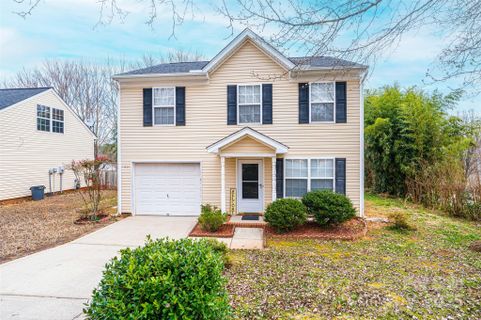
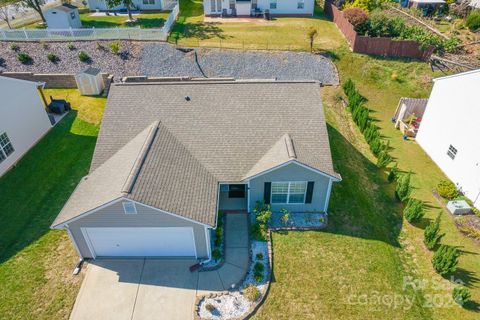
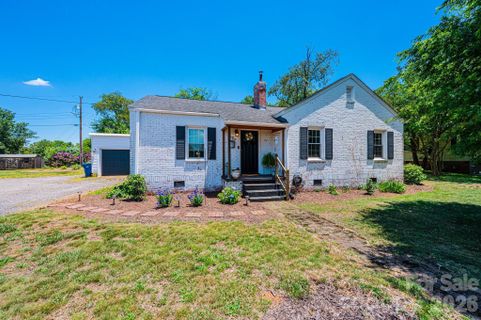
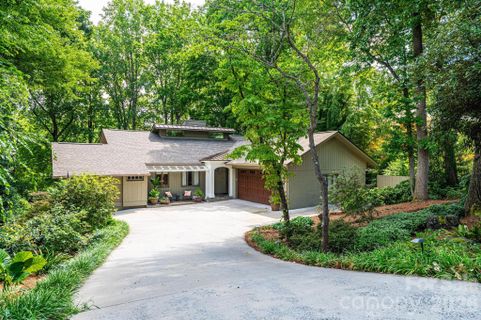
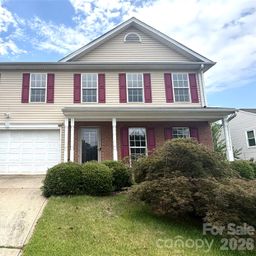
Most homes here are detached residences, and the dominant floor plans lean toward comfortable two-story layouts with a few ranch-style options mixed in. Garage parking is nearly universal, and that detail says a lot about how the neighborhood functions: storage, convenience, and low-fuss living matter here. Inside, buyers can expect open main-level spaces, gas fireplaces, primary suites with walk-in closets, and updates such as granite counters, stainless appliances, and vinyl plank or laminate flooring. Outdoor spaces also play a noticeable role, with fenced yards, decks, patios, pergolas, and occasional sheds or outbuildings adding useful square footage to the lifestyle.
The overall feel is polished but not flashy. Homes tend to sit on modest lots, which keeps maintenance manageable and gives the community a tidy, settled appearance. Recent construction at the upper end of the price range adds a fresh option for buyers who want something newly completed, while the earlier homes offer the more familiar rhythm of an established subdivision.
Daily life in Windsong Village revolves around convenience. Nearby remarks consistently point to shopping, dining, schools, and major routes in Hickory, and several listings call out quick access to I-40, US-321, and Hwy 70. That makes errands straightforward and gives the neighborhood a practical location for commuting across the city or beyond. Hickory Regional Airport is also mentioned as being about 5 minutes away, while Charlotte International Airport is cited at roughly 40 minutes or about 40 miles from the area.
"Close to major routes and everyday services, it keeps the routine simple from morning to evening."
Residents also benefit from proximity to major retail and entertainment destinations, including Target, Valley Hills Mall, Hickory Ridge Shopping Center, AMC Movie Theatre, and Defy trampoline park. The nearby mix of grocery, dining, and recreation gives the community a very usable, well-connected rhythm.
Windsong Village sits in Hickory’s established west-side residential fabric, with easy reach to I-40, US-321, and Hwy 70. The neighborhood is associated with Southwest Elementary, Grandview Middle, and Hickory High, and the school pattern is mentioned consistently across the listing history. For buyers who want a familiar Hickory address with direct access to shopping corridors, airport connections, and the city’s main travel routes, this location is especially practical. The combination of central convenience, established streets, and steady home styles gives Windsong Village a strong sense of place.
Palmetto Park Realty Team · Hickory
Ask about Windsong Village — we answer fast
See what it's worth — your home's own sale history plus recent Windsong Village sales, free.
What's my home worth?Communities similar to Windsong Village
Showing 1-48+ recently sold in Windsong Village, Hickory
| Property | Sold | Sold Price | Days on Market | Size | Sold to Ask | Sold $/SF |
|---|---|---|---|---|---|---|
| | Nov 5 2025 | $320,000 | 125 | 2,103 sq ft | 97.0% | $152 |
| | Oct 16 2025 | $280,000 | 102 | 1,128 sq ft | 96.6% | $248 |
| | Oct 16 2025 | $275,000 | 28 | 1,448 sq ft | 100.0% | $190 |
| | Jun 25 2025 | $249,750 | 29 | 1,114 sq ft | 98.0% | $224 |
| | Jun 13 2025 | $20,000 | 220 | — | 72.7% | — |
| | May 6 2025 | $274,000 | 55 | 1,434 sq ft | 105.4% | $191 |
| | Dec 18 2024 | $292,500 | 64 | 1,204 sq ft | 99.2% | $243 |
| | Aug 23 2024 | $358,000 | 146 | 2,225 sq ft | 98.1% | $161 |
| | Jun 13 2024 | $262,000 | 102 | 1,579 sq ft | 95.3% | $166 |
| | May 9 2024 | $295,000 | 56 | 1,305 sq ft | 101.8% | $226 |
| | Mar 4 2024 | $319,083 | 62 | 1,584 sq ft | 98.2% | $201 |
| | Mar 1 2024 | $237,500 | 76 | 1,132 sq ft | 89.6% | $210 |
| | Aug 1 2023 | $290,000 | 46 | 1,714 sq ft | 101.8% | $169 |
| | Jul 28 2022 | $215,000 | 73 | 1,113 sq ft | 95.6% | $193 |
| | Jul 19 2022 | $300,000 | 110 | 1,752 sq ft | 92.3% | $171 |
| | Jul 6 2022 | $294,000 | 33 | 1,728 sq ft | 105.0% | $170 |
| | Nov 16 2021 | $235,000 | 49 | 1,402 sq ft | 94.4% | $168 |
| | Aug 12 2021 | $225,000 | 30 | 1,456 sq ft | 102.3% | $155 |
| | Jul 14 2021 | $248,000 | 46 | 1,566 sq ft | 107.9% | $158 |
| | Jun 11 2021 | $279,900 | 45 | 2,043 sq ft | 103.7% | $137 |
| | Feb 22 2021 | $245,000 | 42 | 1,705 sq ft | 98.0% | $144 |
| | Aug 17 2020 | $194,900 | 32 | 1,729 sq ft | 100.0% | $113 |
| | Jun 30 2020 | $192,000 | 85 | 1,690 sq ft | 101.1% | $114 |
| | Jun 24 2020 | $170,000 | 32 | 1,402 sq ft | 94.5% | $121 |
| | Jun 12 2020 | $204,500 | 39 | 1,683 sq ft | 102.3% | $122 |
| | May 8 2020 | $195,000 | 74 | 1,861 sq ft | 97.5% | $105 |
| | Mar 10 2020 | $162,000 | 49 | 1,579 sq ft | 98.2% | $103 |
| | Jan 24 2020 | $160,000 | 56 | 1,114 sq ft | 94.2% | $144 |
| | Nov 13 2019 | $170,000 | 66 | 1,550 sq ft | 92.4% | $110 |
| | Oct 17 2019 | $157,000 | 52 | 1,445 sq ft | 92.4% | $109 |
| | May 16 2019 | $153,000 | 41 | 1,315 sq ft | 102.1% | $116 |
| | Feb 25 2019 | $174,500 | 55 | 1,572 sq ft | 101.2% | $111 |
| | Feb 14 2019 | $167,000 | 63 | 1,727 sq ft | 92.8% | $97 |
| | Dec 11 2018 | $171,000 | 83 | 1,697 sq ft | 101.8% | $101 |
| | Dec 11 2018 | $171,000 | 84 | 1,697 sq ft | 101.8% | $101 |
| | Nov 16 2018 | $187,000 | 23 | 2,100 sq ft | 101.1% | $89 |
| | Oct 10 2018 | $179,000 | 50 | 1,695 sq ft | 98.1% | $106 |
| | Sep 28 2018 | $165,000 | 44 | 1,317 sq ft | 100.1% | $125 |
| | Sep 28 2018 | $165,000 | 44 | 1,317 sq ft | 100.1% | $125 |
| | May 25 2018 | $164,000 | 87 | 1,576 sq ft | 99.5% | $104 |
| | Mar 28 2018 | $158,900 | 37 | 1,697 sq ft | 102.6% | $94 |
| | Dec 15 2017 | $157,500 | 51 | 1,272 sq ft | 95.5% | $124 |
| | Dec 1 2017 | $144,000 | 67 | 1,440 sq ft | 97.4% | $100 |
| | Sep 26 2017 | $180,000 | 60 | 2,012 sq ft | 102.9% | $89 |
| | Sep 25 2017 | $180,000 | 59 | 2,012 sq ft | 102.9% | $89 |
| | Apr 13 2017 | $135,000 | 65 | 1,248 sq ft | 100.0% | $108 |
| | Apr 13 2017 | $135,000 | 65 | 1,248 sq ft | 100.0% | $108 |
| | Aug 24 2016 | $145,000 | 65 | 1,779 sq ft | 93.5% | $82 |
Closed sales from MLS history for Windsong Village, Hickory
Windsong Village median sale price is $275,000; Hickory is up 4.4%.
+1 outside price range.
The Windsong Village real estate market shows balanced market conditions. Homes typically sell within 57 days. With 2 active listings and 3 homes sold in the past year, a healthy balance exists between buyers and sellers.
Listings taken off the market in the past year in Windsong Village, Hickory
Hickory, NC 28602
3 bd · 2 ba · 1,590 sqft
Hickory, NC 28602
4 bd · 2 ba · 1,750 sqft
These homes are no longer available, but they show recent pricing and listing activity in Windsong Village. Our agents can help you watch for new listings in this area.
Contact an agentFree account needed — create one to continue viewing homes.
Members see everything — free👋 Still browsing Windsong Village?
Full photos, price history, and every active & pending home in Windsong Village with a free account.
Palmetto Park Realty Team
 $325K
$325K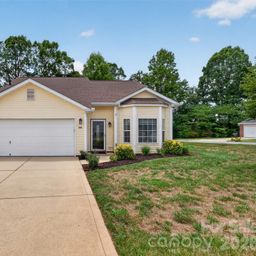 $280K
$280KCheck your messages
We sent a code to .
Verify your number and we'll text you price drops and new Windsong Village listings. 1–2 texts a month, stop anytime.
Enjoy full access to this home and every home on Palmetto Park.