Buyers have more negotiating power. Properties may take longer to sell.
| Property | Sold Date▼ | Sale Price↕ | DOM↕ | LP/SP↕ | Size↕ | $/SF↕ |
|---|---|---|---|---|---|---|
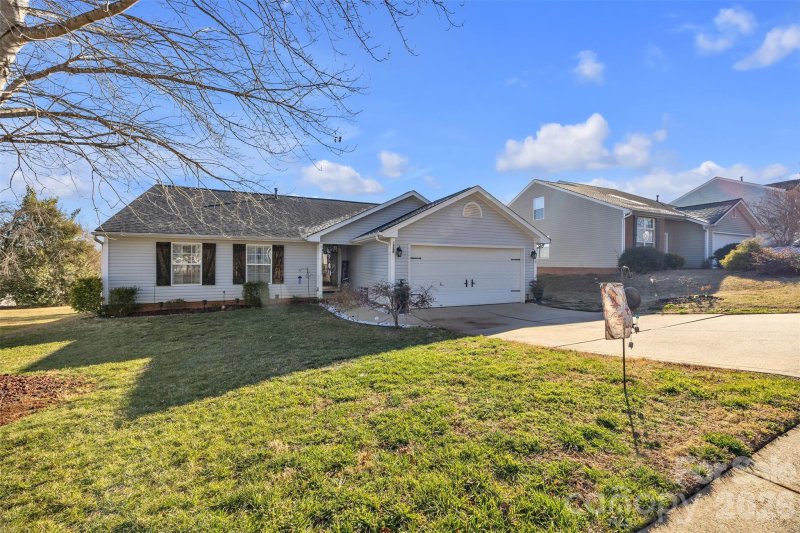
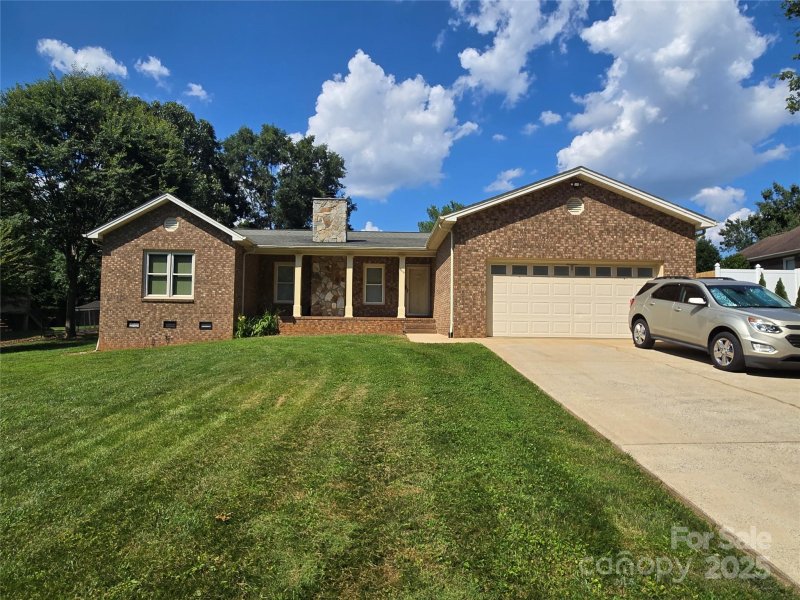
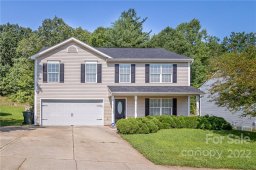
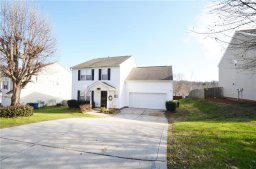
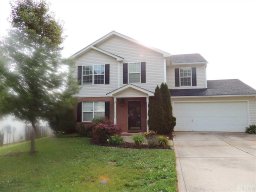
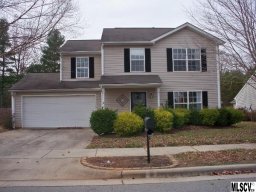
 SOLD 1912 8th Street 3 bed2 bath | Sep 18 2025 | $320,000 | 68 | 99% | 1738 sq ft | $184 |
1+ year gap in market activity | ||||||
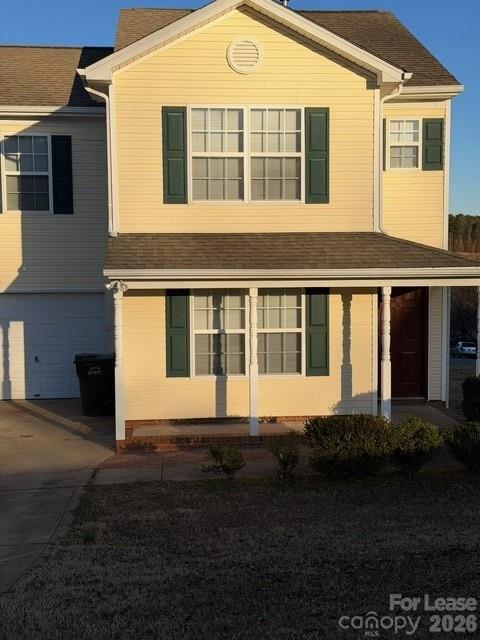
 SOLD 1963 8th Street Lane 3 bed2 bath | Jul 5 2024 | $1,950 | 17 | 🎯100% | 0 sq ft | $Infinity |
1+ year gap in market activity | ||||||
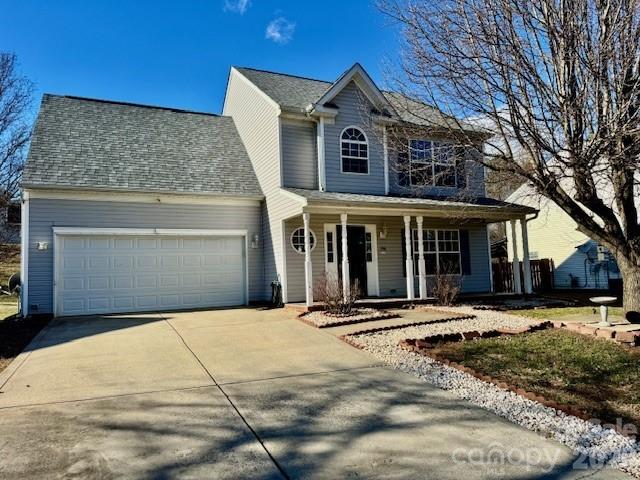
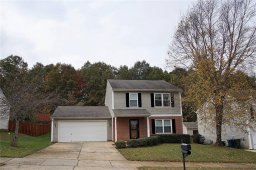
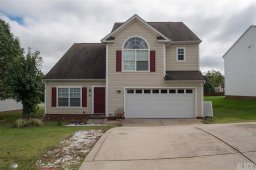
 SOLD 1948 8th Street 4 bed2 bath | Sep 19 2022 | $340,000 | 42 | 🎯110% | 2225 sq ft | $153 |
9 month gap in market activity | ||||||
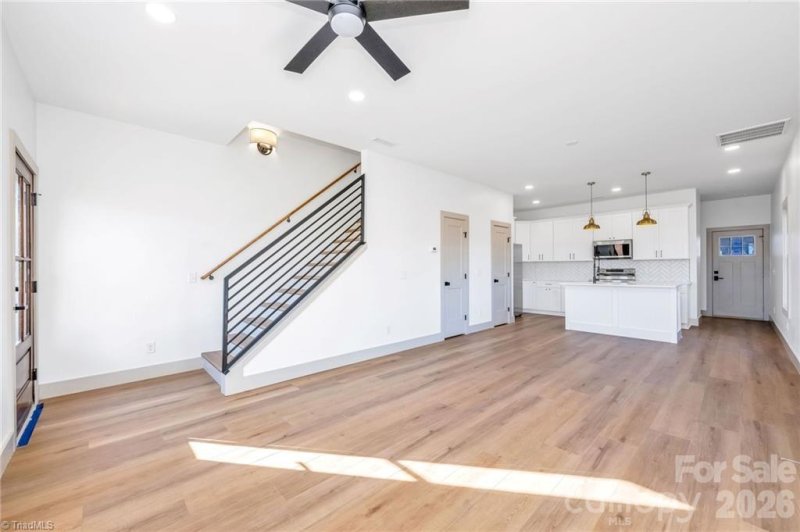
 SOLD 1941 8th Street 3 bed2 bath | Dec 20 2021 | $1,650 | 28 | 99% | 1695 sq ft | $1 |
3 month gap in market activity | ||||||
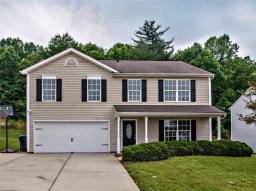
 SOLD 1972 8th Street 3 bed2 bath | Sep 15 2021 | $230,000 | 52 | 96% | 1813 sq ft | $127 |
9 month gap in market activity | ||||||
 SOLD 1941 8th Street 3 bed2 bath | Dec 19 2020 | $1,275 | 5 | 🎯100% | 1700 sq ft | $1 |
9 month gap in market activity | ||||||
 SOLD 1955 9th Street Place 3 bed2 bath | Feb 28 2020 | $185,000 | 30 | 🎯100% | 1655 sq ft | $112 |
1+ year gap in market activity | ||||||
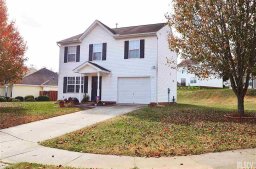
 SOLD 1954 8th Street 3 bed2 bath | Dec 17 2018 | $152,000 | 38 | 99% | 1344 sq ft | $113 |
4 month gap in market activity | ||||||
 SOLD 1948 8th Street 4 bed2 bath | Aug 14 2018 | $197,200 | 81 | 🎯101% | 2221 sq ft | $89 |
5 month gap in market activity | ||||||
 SOLD 1908 9th Street Drive 3 bed2 bath | Feb 20 2018 | $141,000 | 94 | 94% | 1443 sq ft | $98 |
1+ year gap in market activity | ||||||
 SOLD 1935 8th Street 4 bed2 bath | Jun 2 2016 | $141,000 | 54 | 🎯100% | 1544 sq ft | $91 |
 SOLD 1923 9th Street Drive 3 bed2 bath | May 13 2016 | $124,900 | 67 | 🎯100% | 1272 sq ft | $98 |
5 month gap in market activity | ||||||
 SOLD 1949 9th Street Place 4 bed2 bath | Nov 30 2015 | $153,500 | 55 | 99% | 2100 sq ft | $73 |
4 month gap in market activity | ||||||
 SOLD 812 20th Avenue Place 3 bed2 bath | Jul 7 2015 | $129,500 | 172 | 97% | 1440 sq ft | $90 |
3 month gap in market activity | ||||||
 SOLD 1984 8th Street 4 bed2 bath | Mar 26 2015 | $101,000 | 98 | 98% | 1544 sq ft | $65 |
6 month gap in market activity | ||||||
 SOLD 1916 9th Street Drive 3 bed2 bath | Aug 30 2014 | $95,900 | 89 | 75% | 1958 sq ft | $49 |
1+ year gap in market activity | ||||||
 SOLD 1936 Se 8th Street 3 bed2 bath | Mar 27 2013 | $1,100 | 37 | 🎯100% | 1695 sq ft | $1 |
1912 8th Street
$320,000
1963 8th Street Lane
$1,950
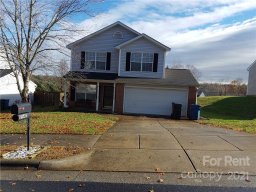
1948 8th Street
$340,000
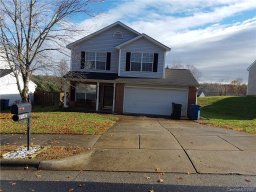
1941 8th Street
$1,650
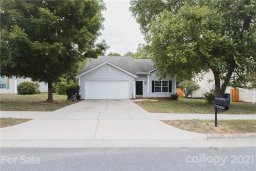
1972 8th Street
$230,000
1941 8th Street
$1,275
1955 9th Street Place
$185,000
1954 8th Street
$152,000
1948 8th Street
$197,200
1908 9th Street Drive
$141,000
1935 8th Street
$141,000
1923 9th Street Drive
$124,900
1949 9th Street Place
$153,500
812 20th Avenue Place
$129,500
1984 8th Street
$101,000
1916 9th Street Drive
$95,900
1936 Se 8th Street
$1,100
The Windsong real estate market shows buyer's market conditions. Homes typically sell within 2804 days. With 3 active listings and 1 homes sold in the past year, Buyers have more negotiating power and time to decide.
Median Price:$300,000
Average Price:$205,500
Avg Bedrooms:3.3
Avg Bathrooms:2.0
Avg Lot Size:0.19 acres
Active Listings:3
Sold Last Year:1
Median Days to Sell:2804 days
Has HOA:No
Median Year Built:2000
New Construction:0%