Active
New
$230,000 $156/sqft
5 Dewberry Drive
Hendersonville, NC 28792
2 bd · 1 ba · 1,479 sqft · 1976 · 4 d ago
Fireplace
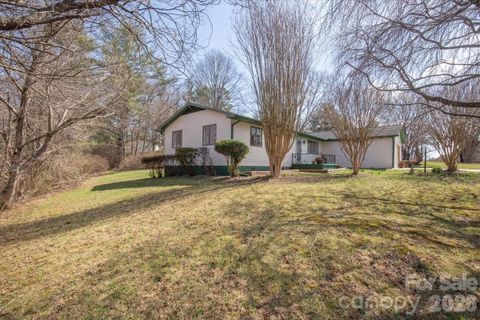
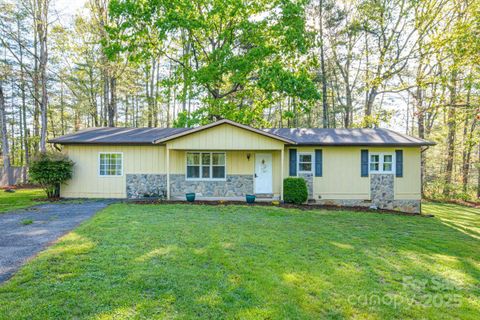
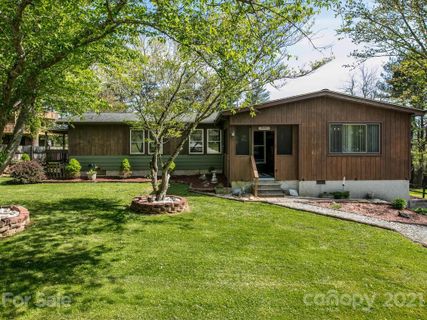
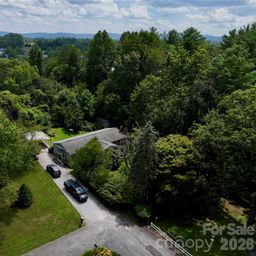
Woodland Trace has the feel of an established Hendersonville pocket where the lots are a little roomier, the streets stay residential, and the homes show years of steady care.
Community overview based on MLS listing data for Woodland Trace, Hendersonville
Woodland Trace has the feel of an established Hendersonville pocket where the lots are a little roomier, the streets stay residential, and the homes show years of steady care. The neighborhood’s setting near downtown gives it an easygoing, close-in character without losing that tucked-away suburban feel. Many homes here have been updated over time, so the overall impression is one of practical comfort with just enough personality to stand out.
"Close-in convenience and lived-in character define Woodland Trace."
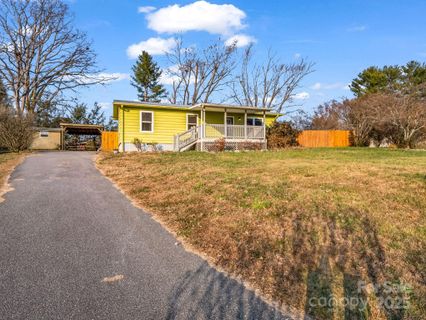
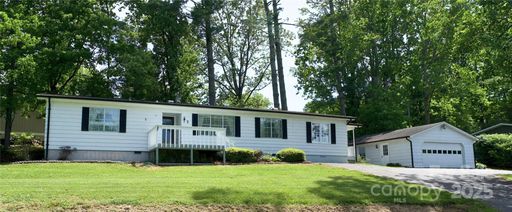
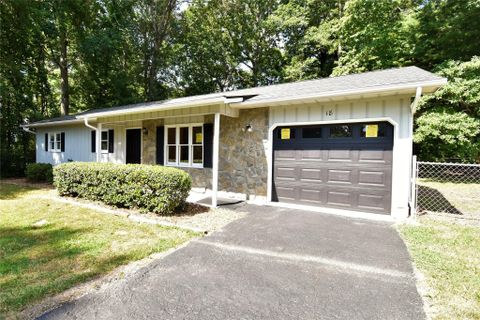
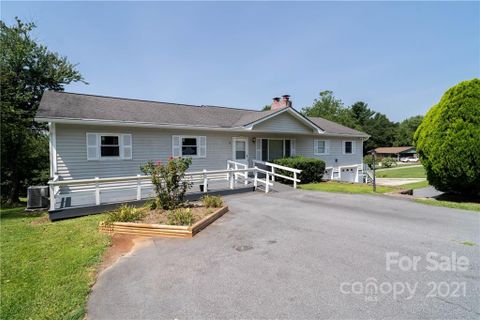
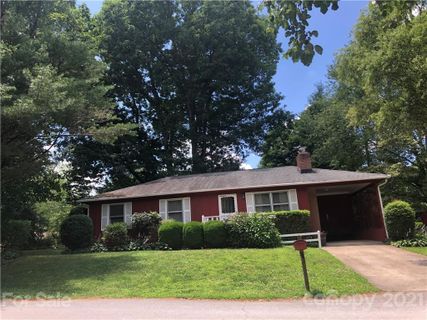
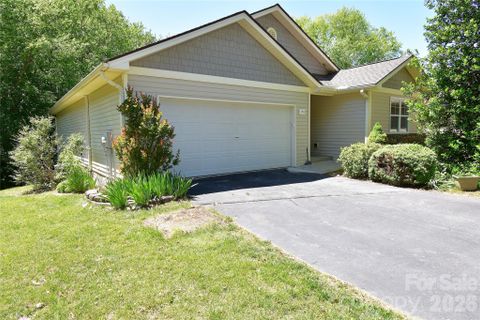
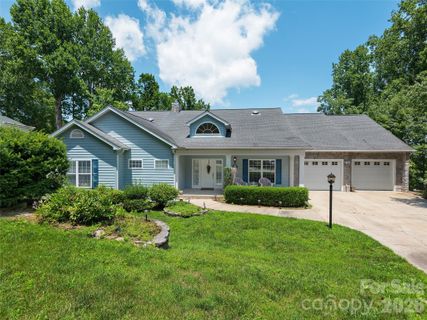
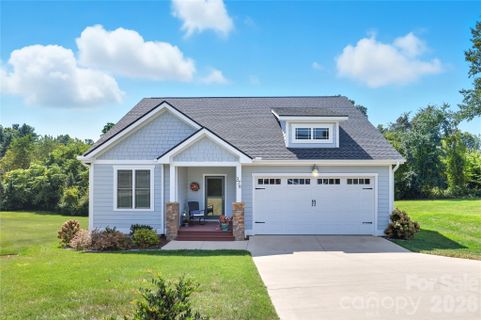
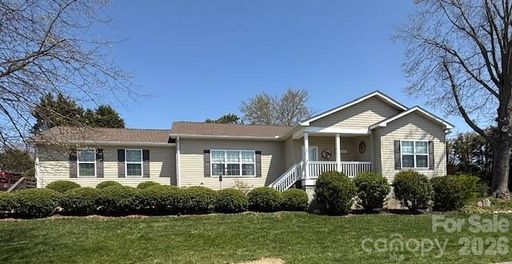
This is a single-family neighborhood with a mix of ranches, Cape-style homes, and Arts and Crafts influences, with construction spanning from the mid-1950s through 1990. Many homes feature brick exteriors, and several properties include thoughtful upgrades such as hardwood floors, remodeled kitchens, screened porches, sunrooms, and fenced backyards. Garage parking is common, and basement space appears often enough to add flexibility for storage, workshop use, or extra living areas. Lot sizes are generally modestly spacious, which helps the homes feel settled and gives yards room for landscaping, decks, and outdoor gathering spaces.
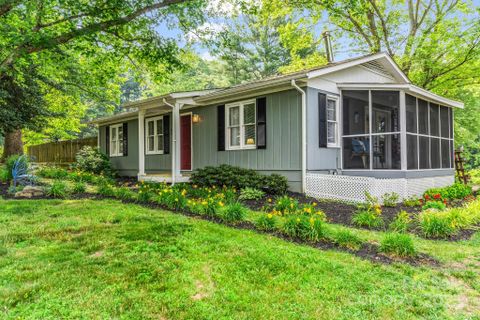
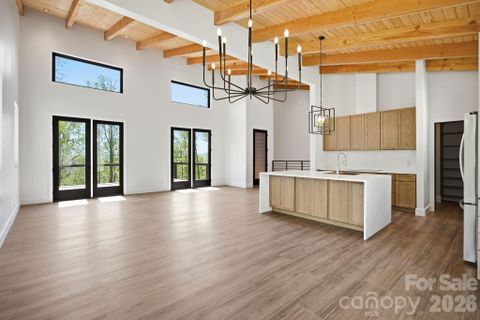
The overall mood is practical and well-kept rather than flashy. Some homes lean into classic charm with fireplaces, original wood details, or vintage layouts, while others have been refreshed with granite counters, new flooring, and updated systems. It is the kind of place where the curb appeal comes from mature plantings, level lots, and homes that have been maintained over time.
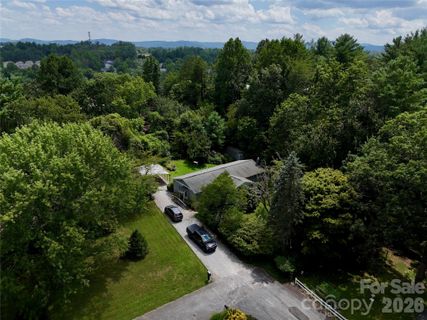
Woodland Trace’s daily rhythm is shaped by convenience. Residents are close to shopping, restaurants, grocery options, and medical services, and the Ecusta Trail adds a recreation draw nearby for walking and biking. Outdoor living is a recurring theme here: screened porches, back decks, fenced yards, fire pits, and even pool-centered entertaining spaces show up in the neighborhood’s homes. The setting supports an easy routine, whether that means a quick run to errands or an afternoon spent at home in the yard.
"It is a neighborhood that balances everyday convenience with real outdoor living space."
Woodland Trace sits in a close-in Hendersonville location, with public remarks pointing to quick access to I-26, downtown Hendersonville, and a short drive to Asheville. One listing notes about 10 minutes to downtown Hendersonville and 30 minutes to Asheville, while another places the community just minutes from downtown and shopping. The neighborhood is also described as about 0.8 miles from Walmart, 3.6 miles from downtown Hendersonville, and 12 miles from Asheville Regional Airport. Nearby destinations called out in remarks include shopping centers, medical facilities, restaurants, and the Ecusta Trail. School assignments commonly associated with the community are Sugarloaf Elementary, Apple Valley Middle, and North Henderson High, with the area fitting into the Henderson County school district context.
Palmetto Park Realty Team · Hendersonville
Ask about Woodland Trace — we answer fast
See what it's worth — your home's own sale history plus recent Woodland Trace sales, free.
What's my home worth?Communities similar to Woodland Trace
 0.3 mi
 Clear Creek Landing, Hendersonville
2 active · $394,900
 1.5 mi
 Chestnut Ridge, Hendersonville
4 active · $449,950
 1.4 mi
 The Cottages At Windy Knoll, Hendersonville
2 active · $559,450
 1.0 mi
 White Oak Village, Hendersonville
2 active · $351,625
 2.7 mi
 Beechwood Lakes, Hendersonville
4 active · $442,000
 2.7 mi
 Sherman Estates, Hendersonville
2 active · $692,250
25 recently sold in Woodland Trace, Hendersonville
| Property | Sold | Sold Price | Days on Market | Size | Sold to Ask | Sold $/SF |
|---|---|---|---|---|---|---|
| | May 1 2026 | $370,000 | 53 | 1,342 sq ft | 98.7% | $276 |
| | Feb 20 2026 | $290,000 | 96 | 1,008 sq ft | 98.3% | $288 |
| | Dec 2 2025 | $415,000 | 148 | 1,733 sq ft | 95.4% | $239 |
| | Dec 1 2025 | $275,000 | 205 | 1,496 sq ft | 92.0% | $184 |
| | Jul 31 2025 | $345,000 | 54 | 1,156 sq ft | 98.6% | $298 |
| | Jun 19 2025 | $290,000 | 55 | 1,455 sq ft | 93.9% | $199 |
| | Oct 13 2023 | $327,500 | 74 | 1,131 sq ft | 97.8% | $290 |
| | Jun 29 2022 | $275,000 | 32 | 1,432 sq ft | 102.6% | $192 |
| | Jan 28 2022 | $345,900 | 189 | 2,298 sq ft | 94.8% | $151 |
| | Sep 16 2021 | $292,555 | 79 | 1,096 sq ft | 104.9% | $267 |
| | Aug 11 2021 | $294,500 | 105 | 2,159 sq ft | 98.2% | $136 |
| | Mar 12 2021 | $261,446 | 50 | 1,420 sq ft | 100.6% | $184 |
| | Nov 13 2020 | $245,000 | 73 | 1,034 sq ft | 98.0% | $237 |
| | May 27 2020 | $28,350 | 107 | — | 72.9% | — |
| | Feb 4 2020 | $236,000 | 74 | 1,092 sq ft | 102.7% | $216 |
| | Sep 6 2019 | $227,000 | 57 | 1,156 sq ft | 99.1% | $196 |
| | May 23 2019 | $170,000 | 41 | 1,008 sq ft | 100.1% | $169 |
| | Aug 21 2017 | $141,000 | 78 | 1,272 sq ft | 102.5% | $111 |
| | Jul 8 2015 | $127,000 | 103 | 1,548 sq ft | 97.8% | $82 |
| | Mar 20 2015 | $173,000 | 63 | 2,378 sq ft | 98.9% | $73 |
| | Jan 27 2014 | $122,500 | 125 | 1,636 sq ft | 94.3% | $75 |
| | Nov 15 2013 | $120,500 | 53 | 1,440 sq ft | 101.7% | $84 |
| | Jun 18 2013 | $154,500 | 48 | 2,378 sq ft | 103.0% | $65 |
| | May 7 2013 | $126,500 | 170 | 1,220 sq ft | 101.2% | $104 |
| | Feb 15 2013 | $106,000 | 266 | 1,084 sq ft | 96.4% | $98 |
Closed sales from MLS history for Woodland Trace, Hendersonville
Woodland Trace median sale price is $345,000; Hendersonville is down 1.3%.
Below trend-line threshold — city median shown for context
The Woodland Trace real estate market shows buyer's market conditions. Homes typically sell within 76 days. With 1 active listing and 6 homes sold in the past year, buyers have more negotiating power and time to decide.
Free account needed — create one to continue viewing homes.
Members see everything — free👋 Still browsing Woodland Trace?
Full photos, price history, and every active & pending home in Woodland Trace with a free account.
Palmetto Park Realty Team
 $230K
$230KCheck your messages
We sent a code to .
Verify your number and we'll text you price drops and new Woodland Trace listings. 1–2 texts a month, stop anytime.
Enjoy full access to this home and every home on Palmetto Park.