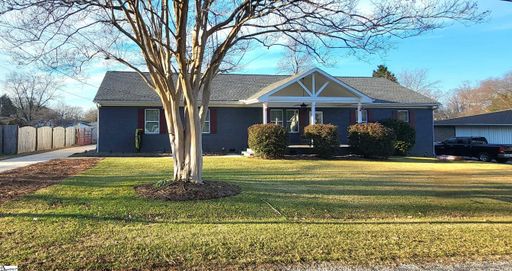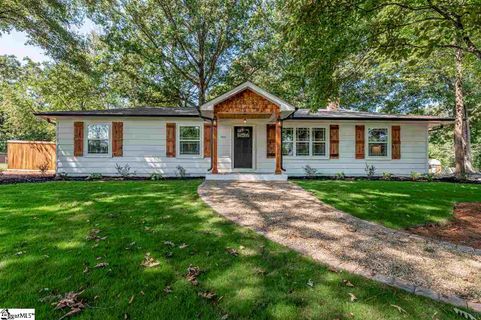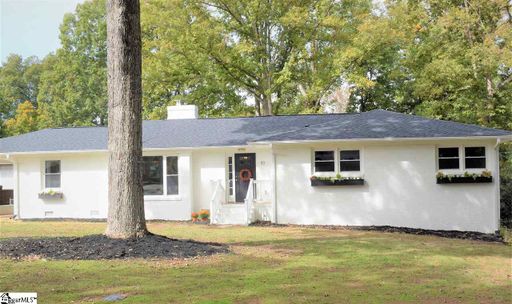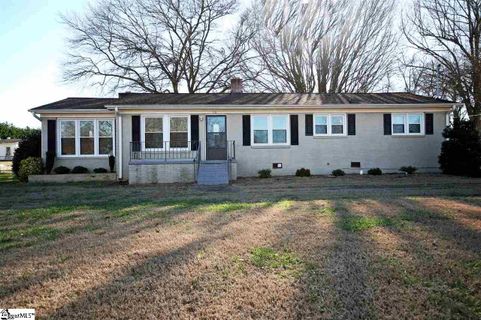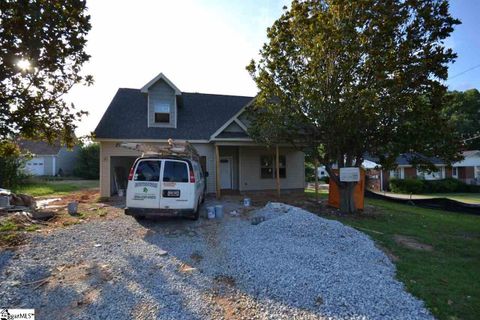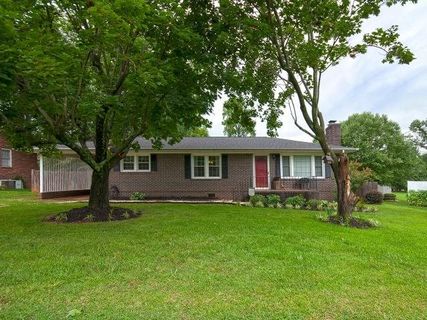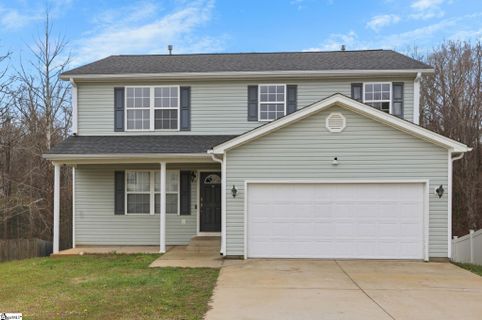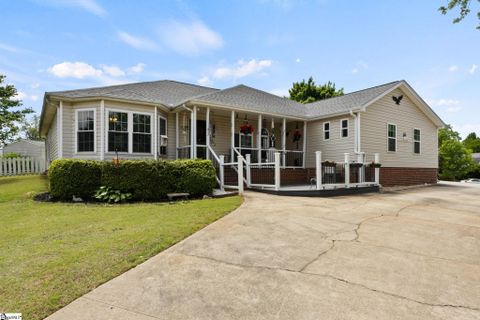
Sold
$325,000 $206/sqft
113 Buddy Avenue
Greer, SC 29651
3 bd · 2 ba · 1,575 sqft · 1960 · DOM: 49 d
Fireplace Garage
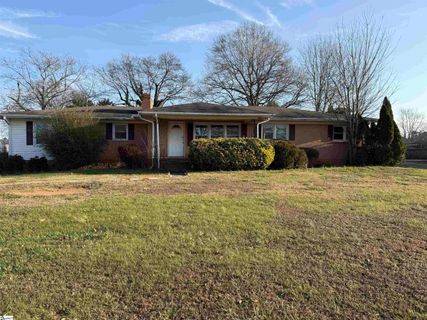
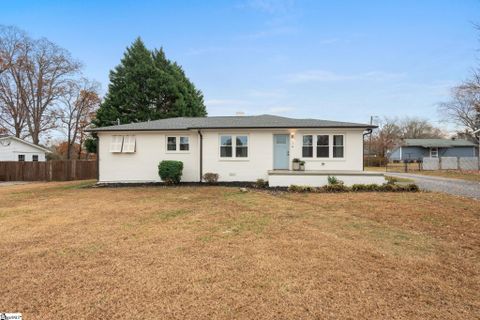
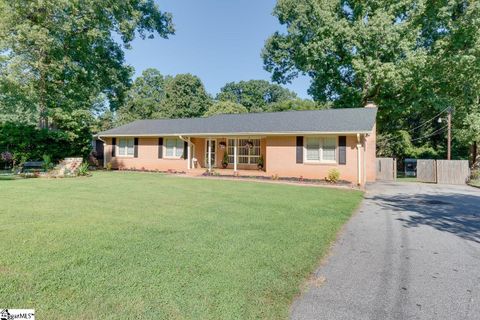
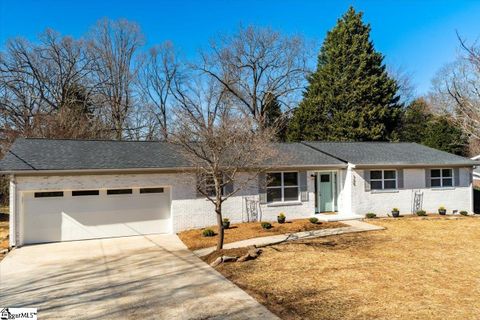
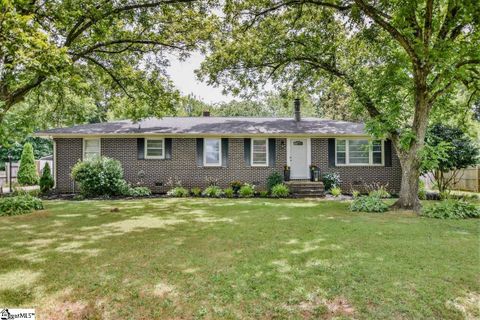
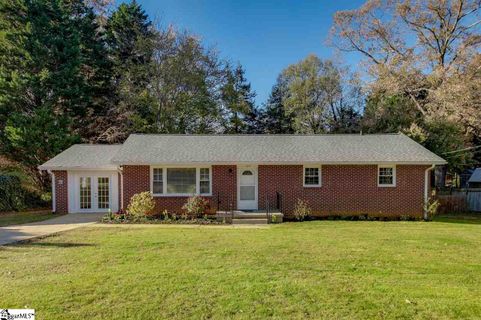
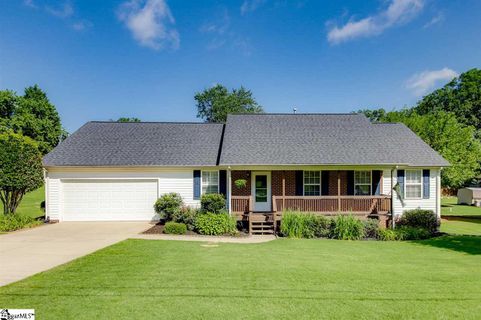
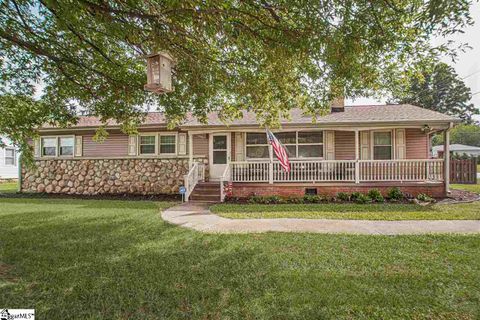
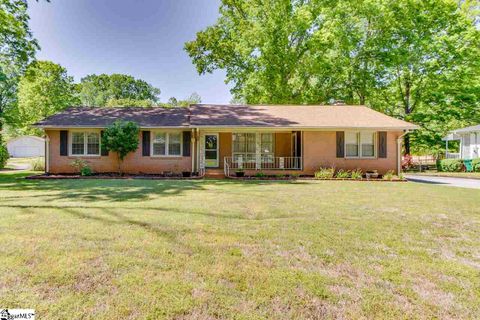
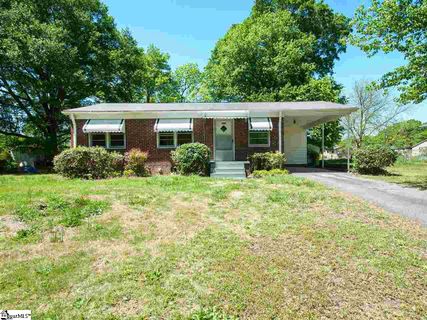
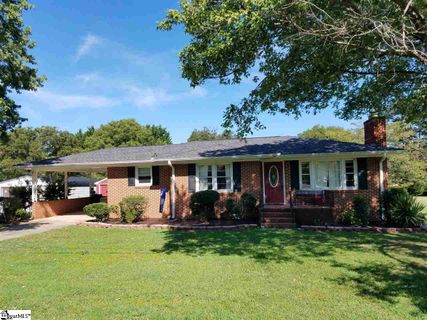
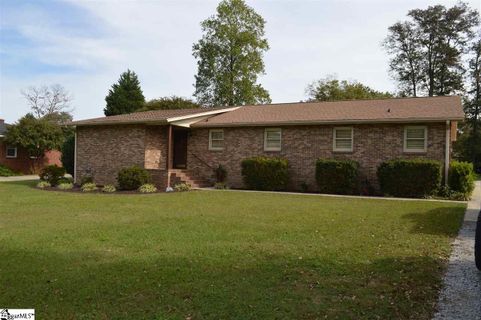
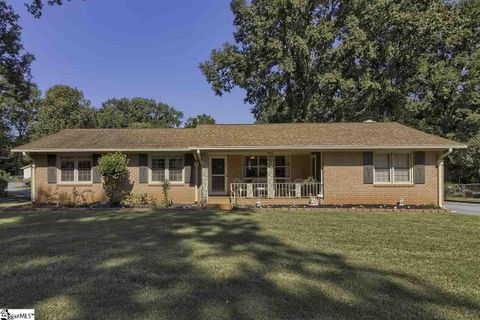
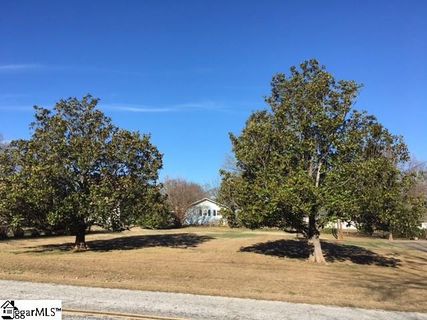
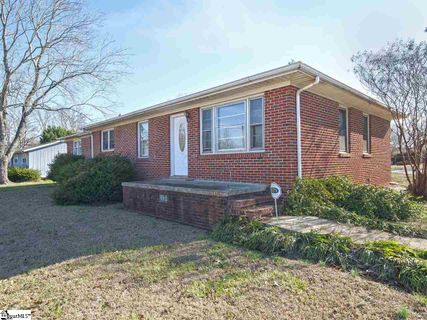
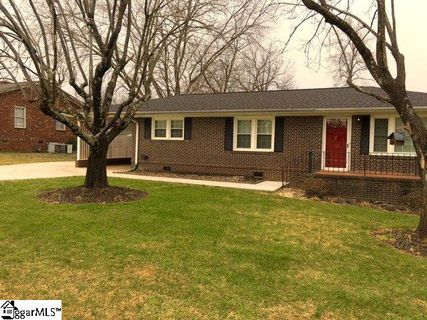
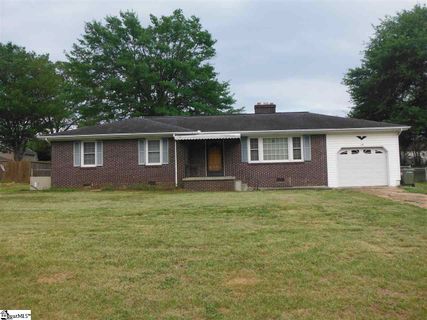
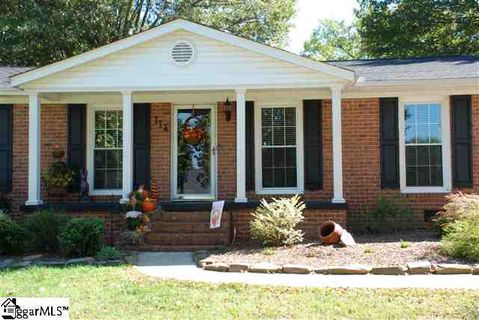
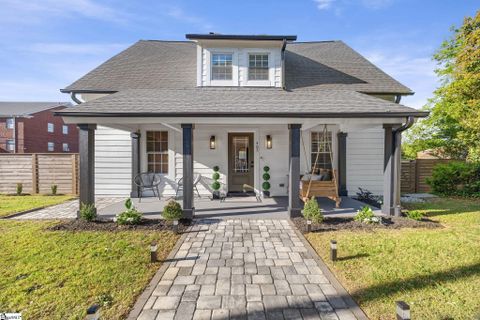
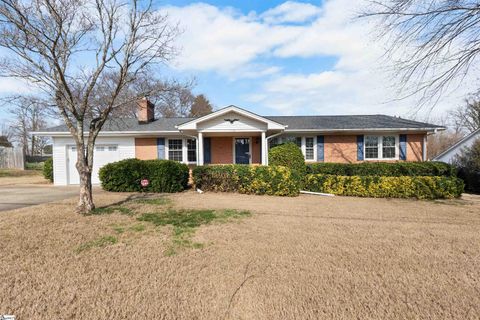
Woodland Heights is an established, no-HOA neighborhood in Greer, South Carolina, where generously sized lots — most approaching a half acre — and single-story ranch architecture define the streetscape.
Community overview based on MLS listing data for Woodland Heights, Greer
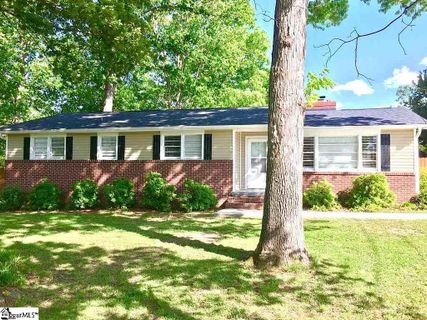
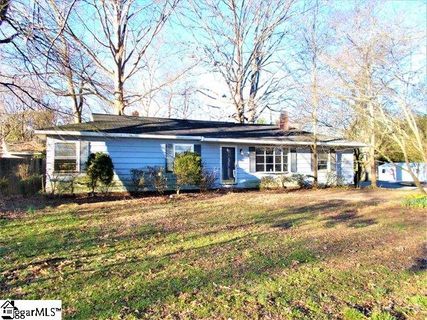
Woodland Heights is an established, no-HOA neighborhood in Greer, South Carolina, where generously sized lots — most approaching a half acre — and single-story ranch architecture define the streetscape. Homes were built primarily through the 1960s and 1970s, and many have undergone thoughtful renovations over the years, blending mid-century character with contemporary kitchens, updated baths, and fresh flooring. Brick construction appears frequently throughout the neighborhood, lending a durable, classic look to many of the homes.
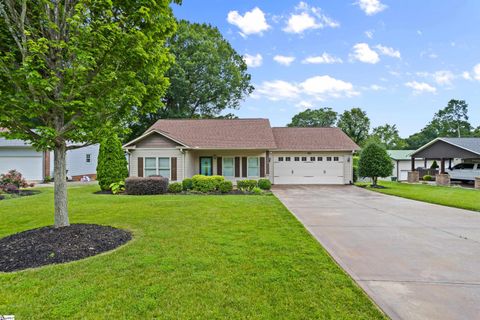
Lot sizes are a consistent draw, with the majority of properties sitting on roughly 19,000 square feet of level, fenced ground. Backyards here have room for decks, patios, fire pits, and the kind of outdoor living that compact lots elsewhere rarely allow. Mature shade trees add canopy and privacy, and detached workshops or storage buildings appear alongside a number of homes — a practical bonus for hobbyists, small contractors, and anyone needing extra storage. Wood-burning and gas fireplaces are common interior features, and hardwood floors run through most of the main living areas.
Woodland Heights carries no HOA, giving owners flexibility on improvements, parking, and use of their property without monthly dues or association oversight. A significant new amenity is taking shape just steps from the neighborhood: the $60 million Greer Sports and Events Center, scheduled to open in 2027, is expected to include an indoor/outdoor walking track, basketball and volleyball courts, a fitness center, community rooms, and sports simulators. This publicly accessible facility will bring recreational infrastructure directly to the neighborhood's doorstep and is already influencing how agents position the area.
Position is one of Woodland Heights' strongest attributes. GSP International Airport sits within roughly nine minutes, I-85 is accessible in under five, and Historic Downtown Greer — with its shops, restaurants, and events — is a short drive away. Downtown Greenville is reachable in approximately 20 minutes, and the BMW Manufacturing plant and Michelin facilities are both nearby, supporting demand from employees of major regional employers. Woodland Elementary, Greer Middle School, and Greer High School serve the neighborhood.
Woodland Heights offers a straightforward value: established single-story homes on substantial lots, in a location that connects quickly to the region's major employment centers, services, and recreation — all without the constraints or costs of an HOA.
Palmetto Park Realty Team · Greer
Ask about Woodland Heights — we answer fast
See what it's worth — your home's own sale history plus recent Woodland Heights sales, free.
What's my home worth?Communities similar to Woodland Heights
Closed sales from MLS history for Woodland Heights, Greer
Below trend-line threshold — city median shown for context
The Woodland Heights real estate market shows balanced market conditions. Homes typically sell within 44 days. With 0 active listings and 4 homes sold in the past year, a healthy balance exists between buyers and sellers.
Free account needed — create one to continue viewing homes.
Members see everything — free👋 Still browsing Woodland Heights?
Full photos, price history, and every active & pending home in Woodland Heights with a free account.
Palmetto Park Realty Team
Check your messages
We sent a code to .
Verify your number and we'll text you price drops and new Woodland Heights listings. 1–2 texts a month, stop anytime.
Enjoy full access to this home and every home on Palmetto Park.