Pelham Estates Homes in Eastside Greenville
No homes
Community Highlights
- Large Eastside lots that average just under 0.88 acre
- Close-in access to downtown Greenville and the Patewood medical corridor
- Strong renovation ceiling with closed sales ranging above $800k and reaching $1.22M
* Based on what we noticed in listing details.
Optional P M P Pool Membership Off Hudson Road
* Based on what we noticed in listing details.


Architecture & Style
- Hardwood Floors
- Fireplaces
- Sunrooms
- Covered Porches
- Patios
- Built Ins
- Home Office Or Flex Space
* Based on what we noticed in listing details.

Location & Proximity
close-in suburban corridor near Pelham Road and Patewood
- Patewood medical campus
- Pelham Road retail and dining corridor
- Haywood Road and Haywood Mall
- Woodruff Road shopping district
- Downtown Greenville
* Based on what we noticed in listing details.

Claudia Hinsdale
Operations Director & REALTOR®
Greenville

Questions about Pelham Estates?
Call Us(864) 757-4000
Overview
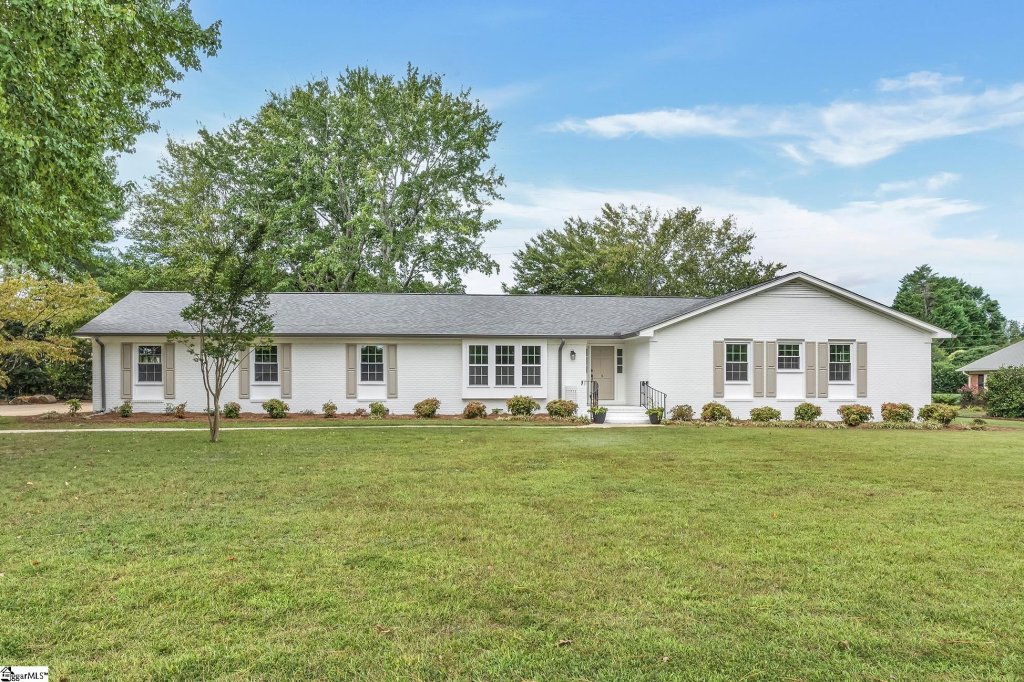
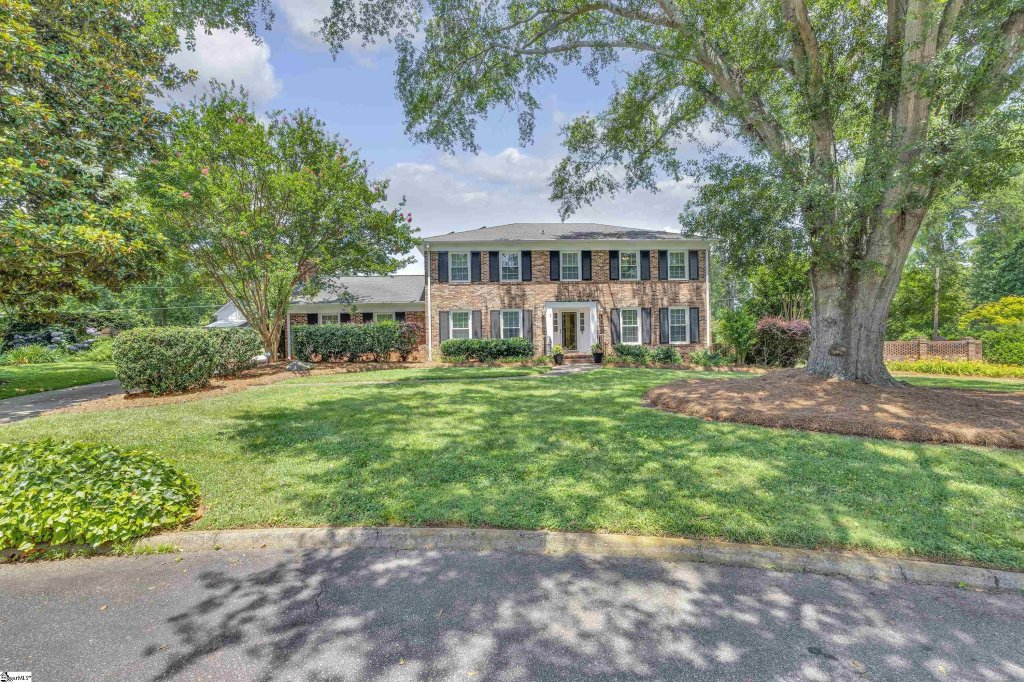
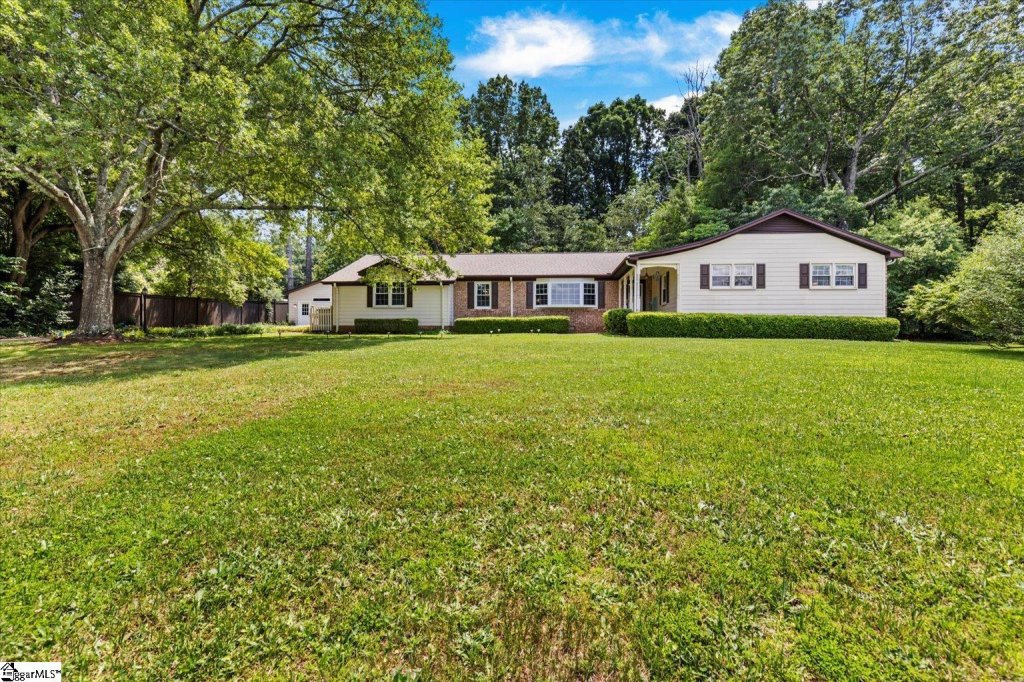
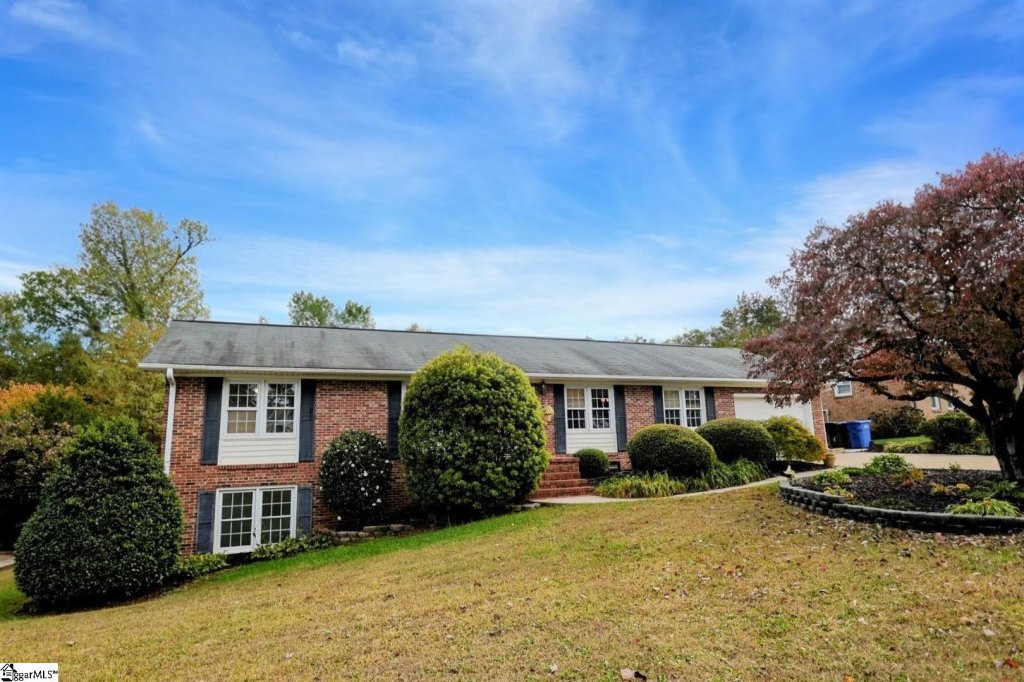
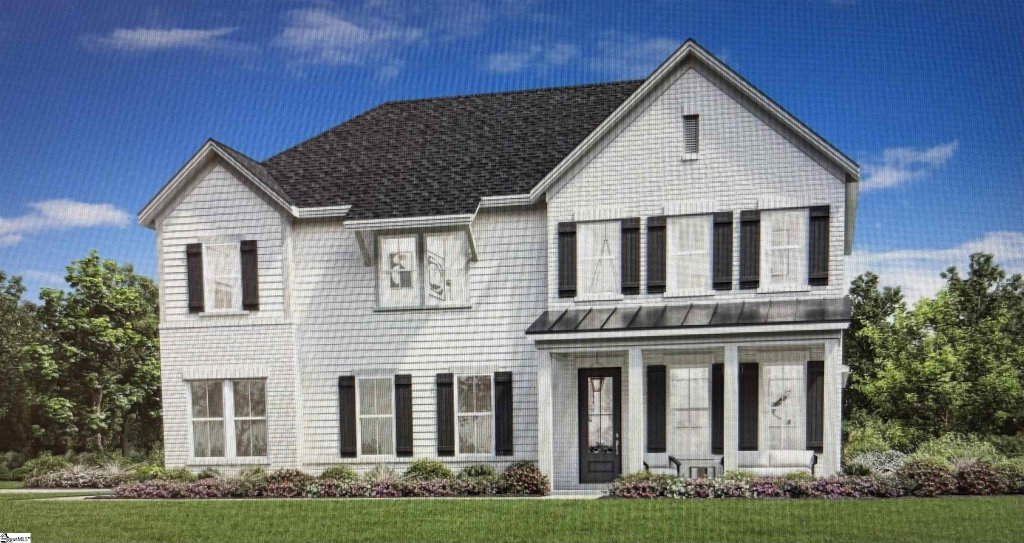
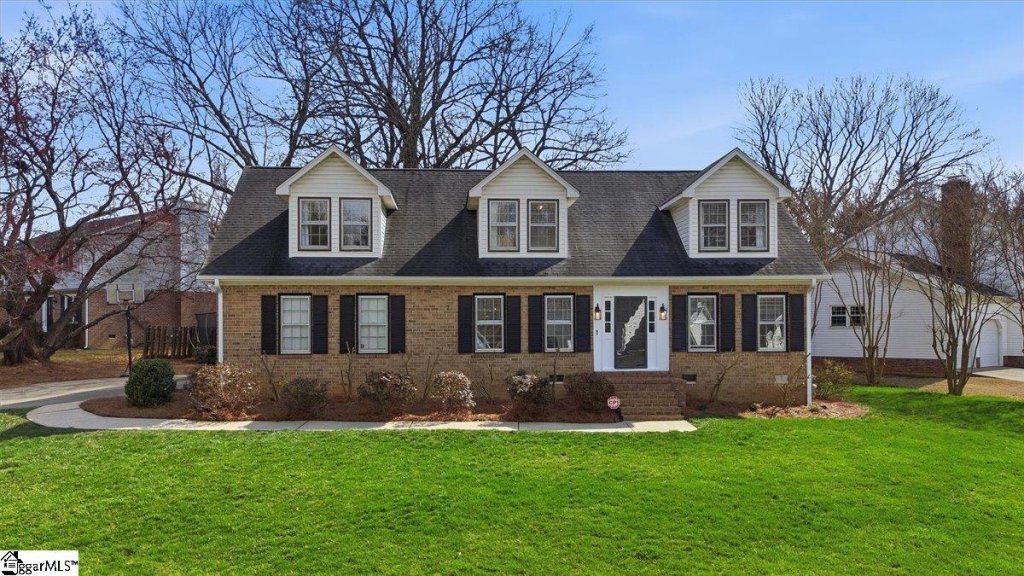
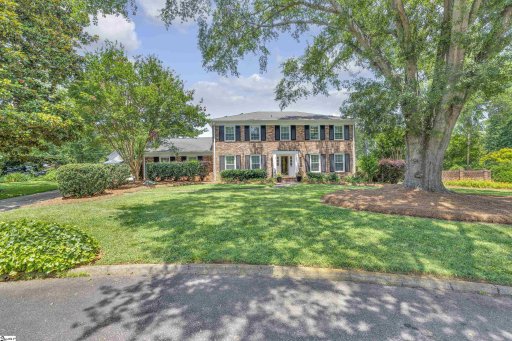
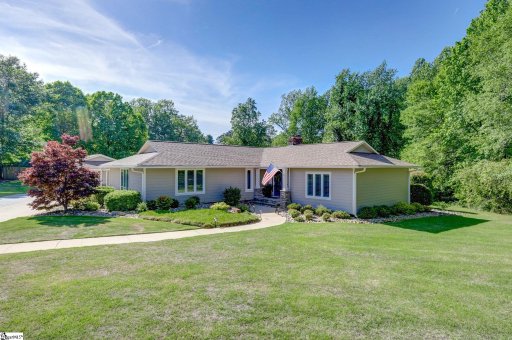
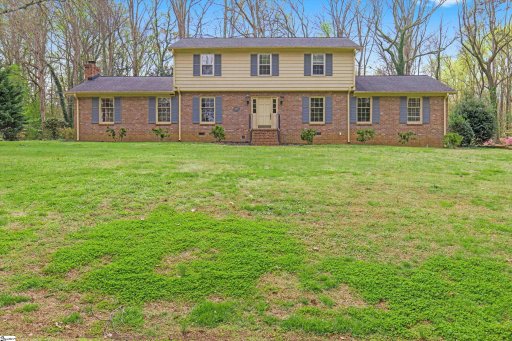
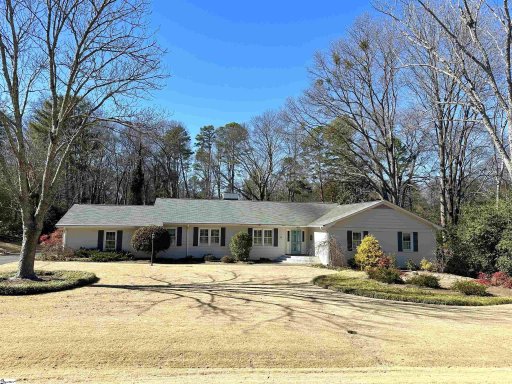
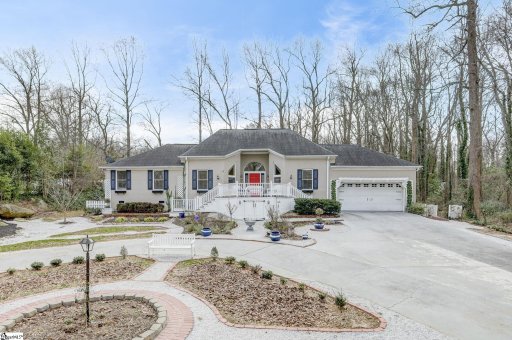
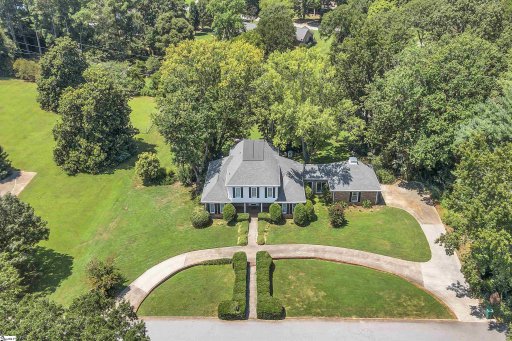
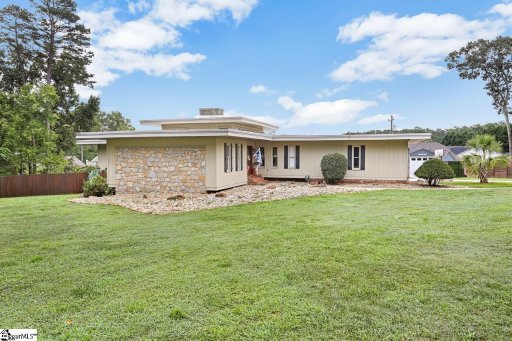
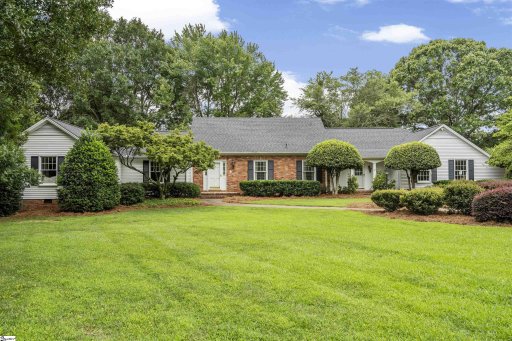
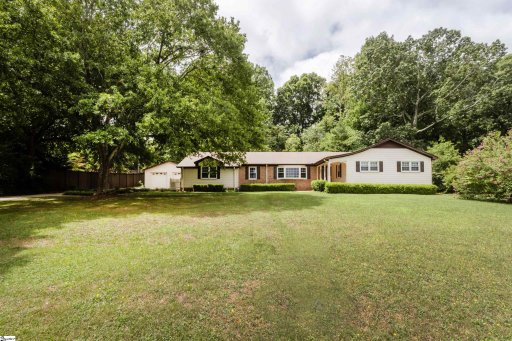
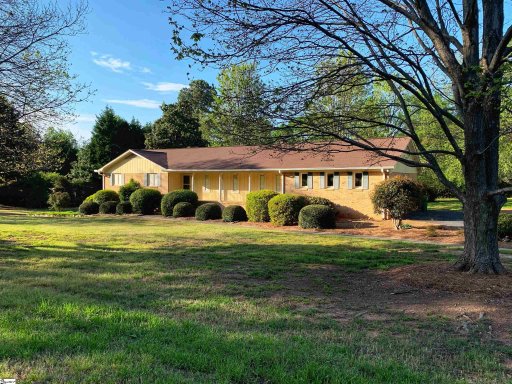
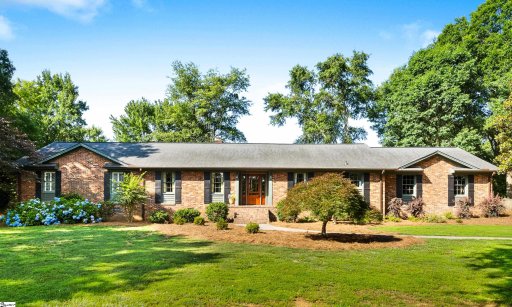
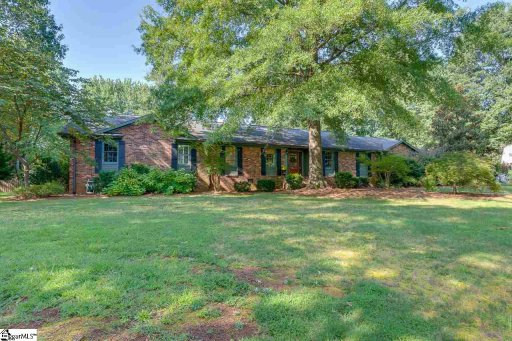
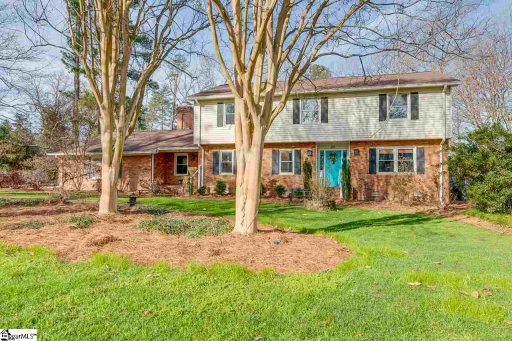
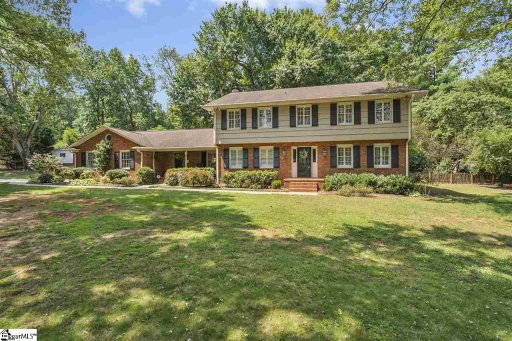
Pelham Estates is one of Greenville's close-in Eastside neighborhoods where the defining feature is space. Lots average just under 0.88 acre, many homes sit on three-quarter-acre to one-acre parcels, and the housing stock spans 1965 to 1996 with the late 1960s and early 1970s forming the core of the neighborhood.
Community Highlights
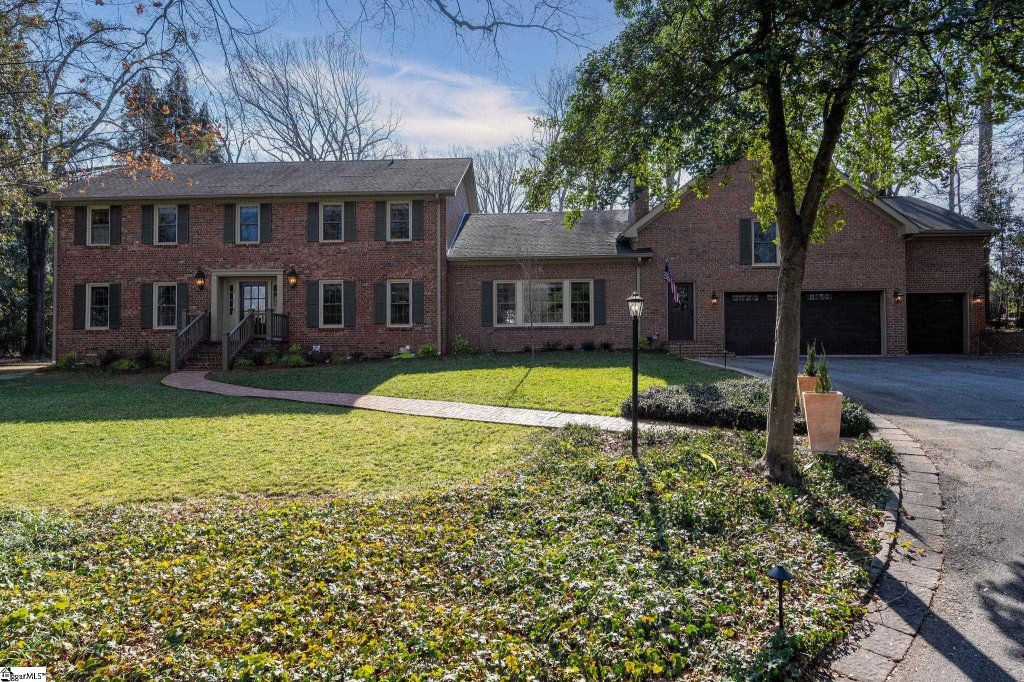
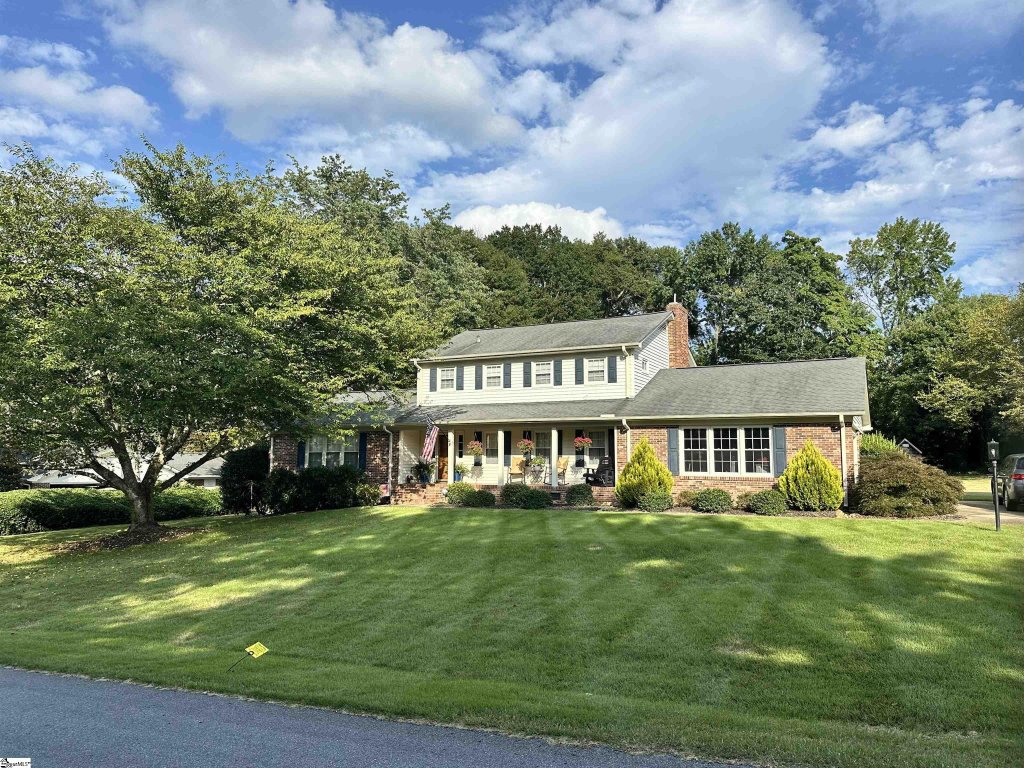
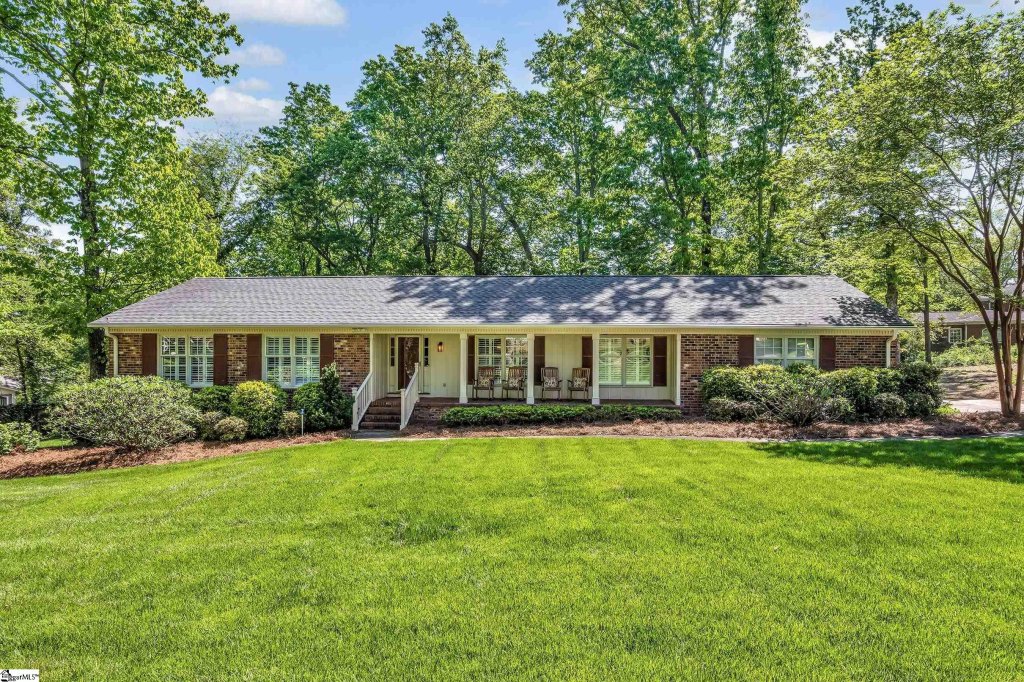
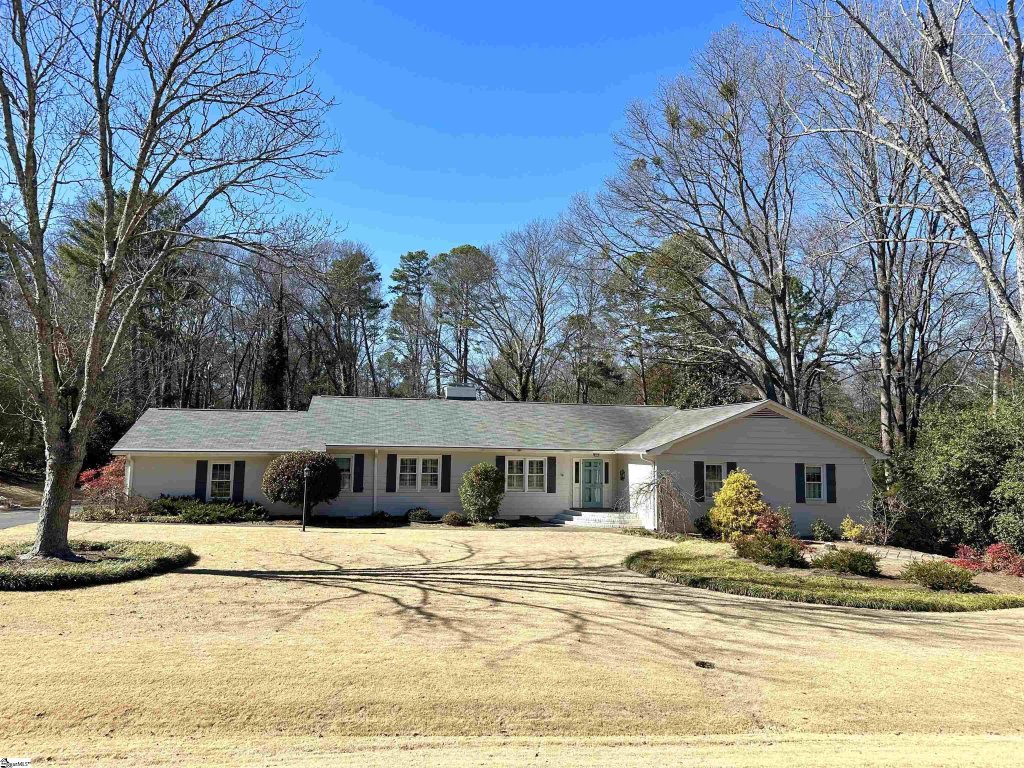
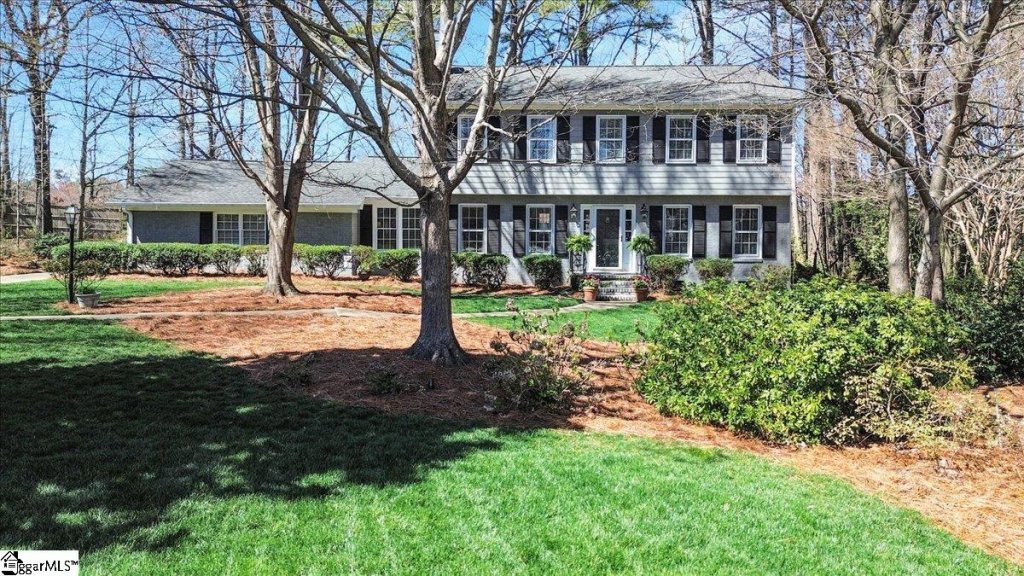
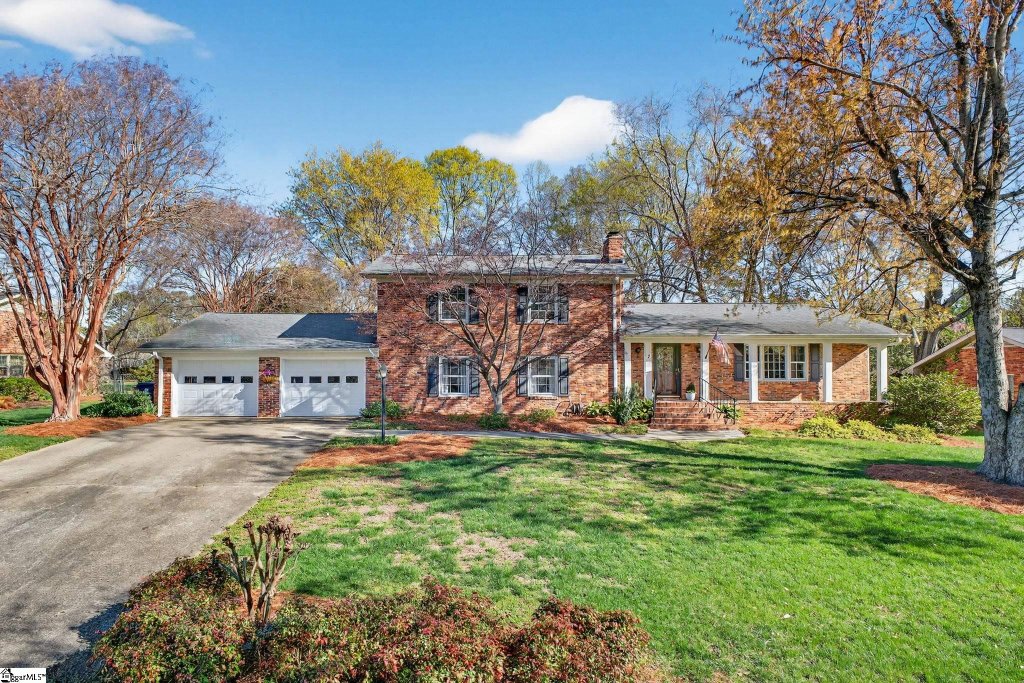
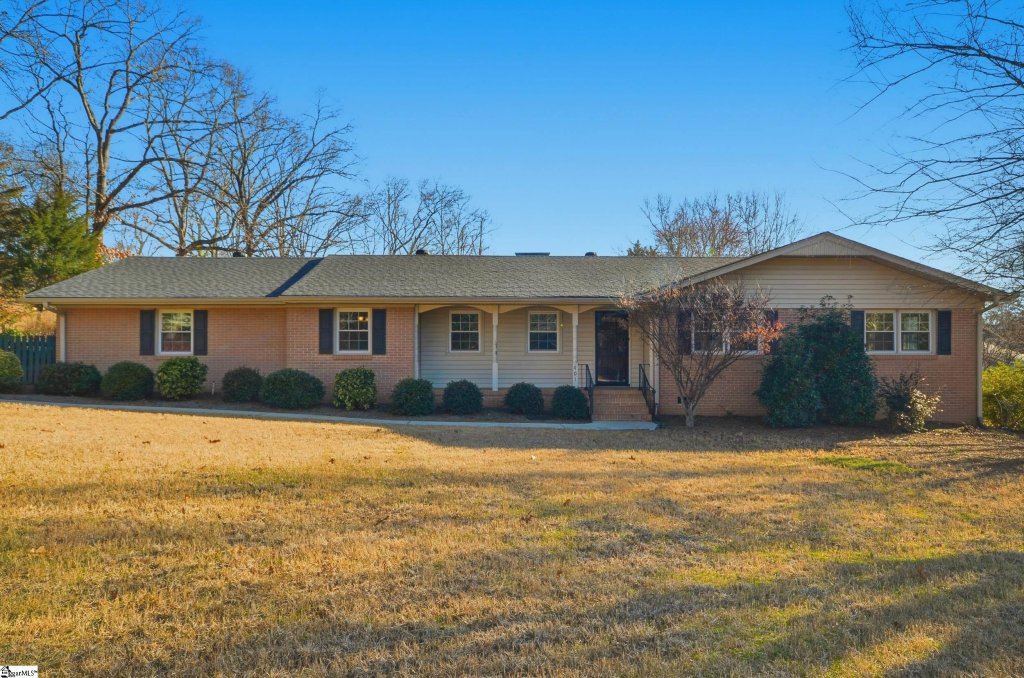
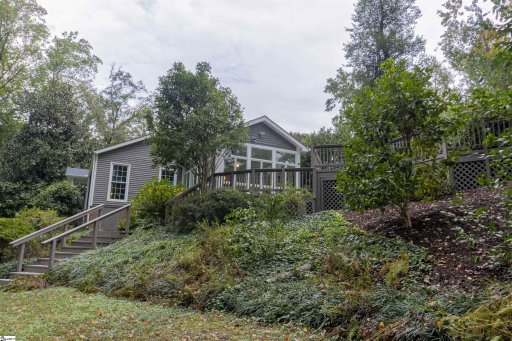
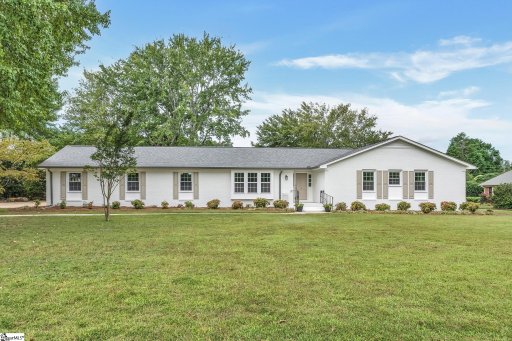
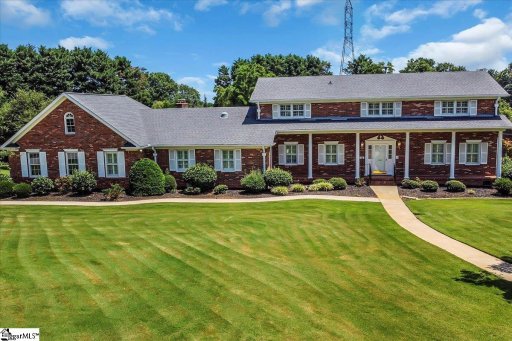
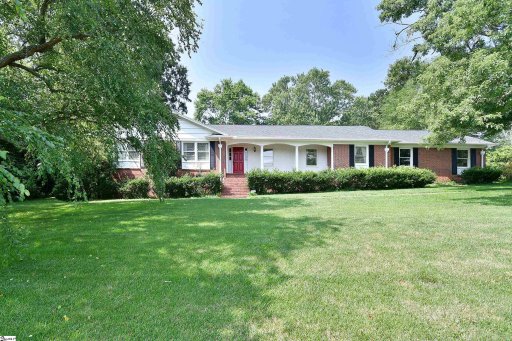
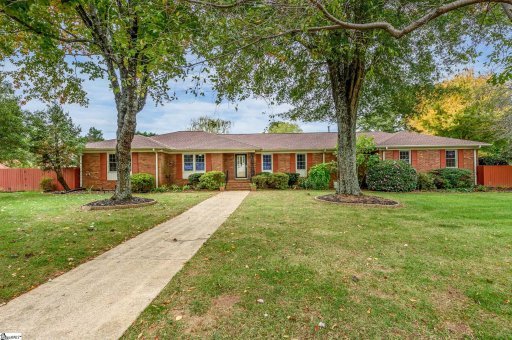
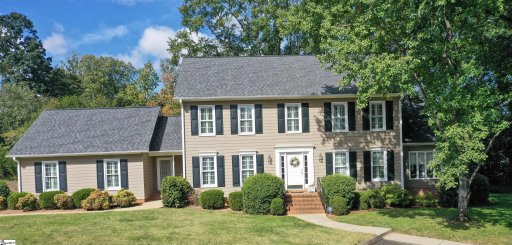
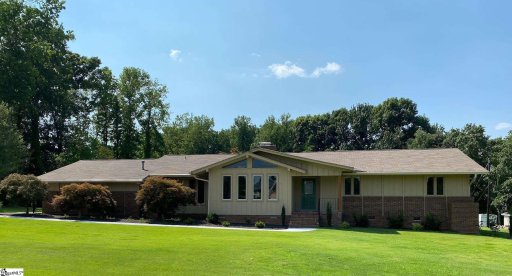
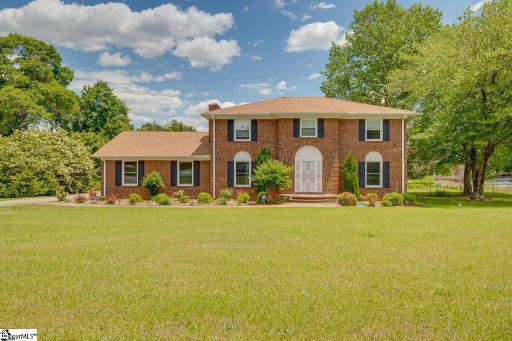
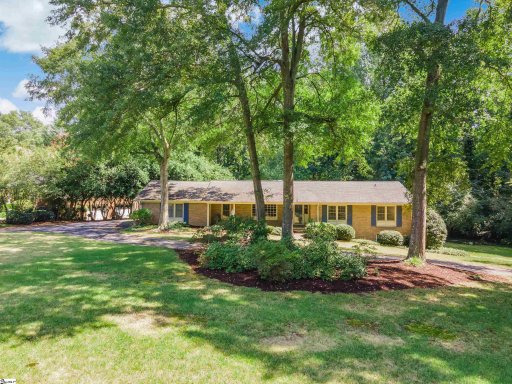
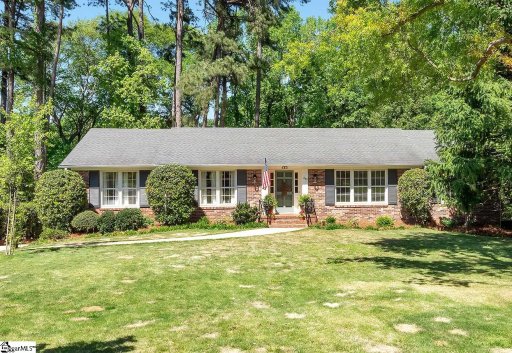
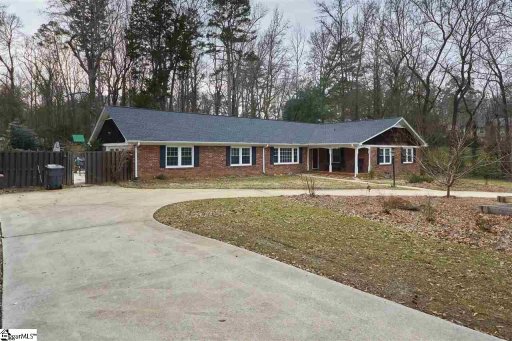
The prevailing look is classic Eastside: brick is frequently referenced, but the streetscape is mixed with wood-accented and stucco variations rather than one uniform exterior. Ranch plans are common alongside two-story traditionals, and the layout emphasis is practical rather than compact. Hardwood floors, fireplaces, sunrooms, covered porches, patios, built-ins, and garages appear again and again, while bonus rooms, detached workshops, and office-ready flex spaces give many homes extra utility. Basements exist here, but they are the exception instead of the rule.
Pelham Estates also shows a wide renovation range. Cape Charles Drive has produced the neighborhood's highest closed-sale average, running about 25% above the broader Pelham Estates closed average, while Redcliffe Road also trends above the community norm. Updated kitchens, expanded living areas, pools, cabanas, and near-acre lots define much of that upper end. Across the neighborhood, resale inventory regularly features remodeled baths, granite or quartz surfaces, stainless appliances, new roofs or windows, and refreshed outdoor living areas.
These insights are based on listing details and are informational only; verify details for any specific property.
Market Trends
Fair conditions for both buyers and sellers. Room for negotiation. Prices have declined 15%.
Year-over-Year Comparison
Last 12 months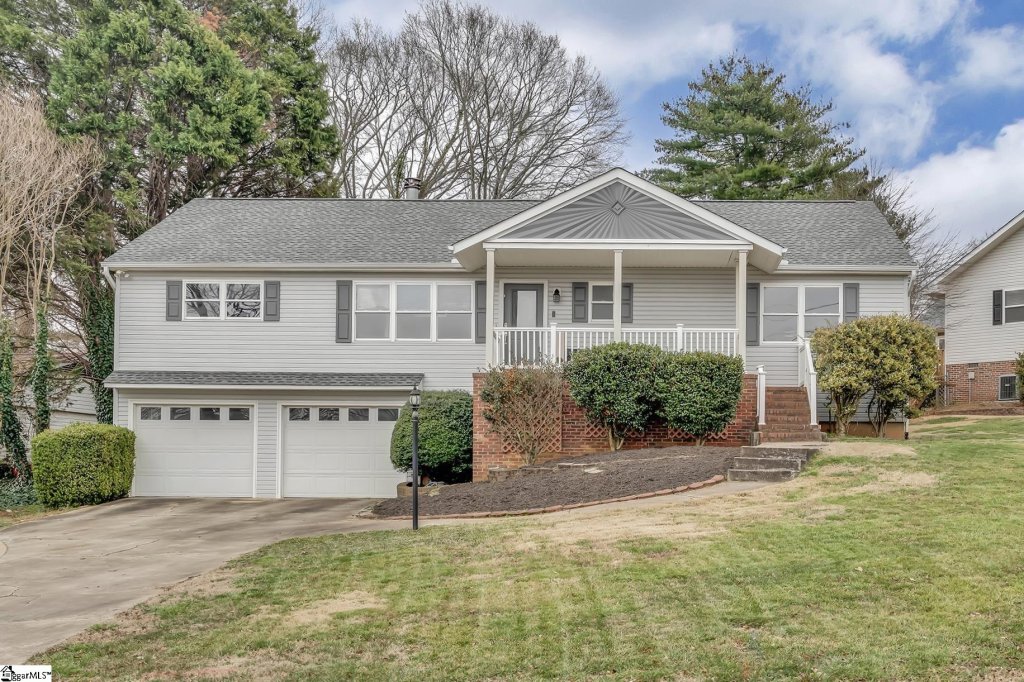
Recently Sold Properties
| Property | Sold Date▼ | Sale Price↕ | DOM↕ | LP/SP↕ | Size↕ | $/SF↕ |
|---|---|---|---|---|---|---|
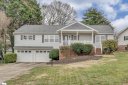
 SOLD 208 Cape Charles Drive 3 bed2 bath | Mar 17 2026 | $699,000 | 48 | 🎯100% | 2450 sq ft | $285 |
4 month gap in market activity | ||||||
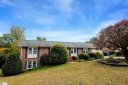
 SOLD 5 Belgrade Drive 4 bed2 bath | Nov 6 2025 | $899,000 | 34 | 🎯100% | 2666 sq ft | $337 |
3 month gap in market activity | ||||||
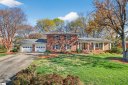
 SOLD 1 Redcliffe Road 5 bed3 bath | Jul 29 2025 | $822,000 | 34 | 97% | 4049 sq ft | $203 |
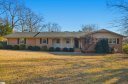
 SOLD 212 Cape Charles Drive 5 bed5 bath | May 30 2025 | $1.22M | 109 | 98% | 5408 sq ft | $226 |
7 month gap in market activity | ||||||
 SOLD 12 Independence Drive 4 bed3 bath | Oct 25 2024 | $690,000 | 64 | 🎯100% | 2627 sq ft | $263 |
3 month gap in market activity | ||||||
 SOLD 3 Providence Square 4 bed2 bath | Jul 1 2024 | $590,000 | 39 | 🎯101% | 2323 sq ft | $254 |
 SOLD 205 Redcliffe Road 4 bed2 bath | Jun 3 2024 | $850,000 | 38 | 🎯108% | 3200 sq ft | $266 |
 SOLD 22 Jamestown Drive 3 bed2 bath | May 24 2024 | $636,000 | 28 | 🎯109% | 3038 sq ft | $209 |
 SOLD 109 Providence Square 5 bed3 bath | Apr 30 2024 | $615,000 | 33 | 🎯107% | 3472 sq ft | $177 |
 SOLD 105 Independence Drive 4 bed2 bath | Mar 29 2024 | $630,000 | 37 | 🎯108% | 2963 sq ft | $213 |
 SOLD 237 Providence Square 3 bed3 bath | Mar 28 2024 | $655,000 | 14 | 🎯103% | 2740 sq ft | $239 |
 SOLD 9 Fredricksburg Drive 4 bed2 bath | Feb 23 2024 | $650,000 | 31 | 96% | 2769 sq ft | $235 |
5 month gap in market activity | ||||||
 SOLD 14 Queens Way 4 bed4 bath | Sep 18 2023 | $700,000 | 48 | 🎯101% | 4147 sq ft | $169 |
 SOLD 21 Ashburn Place 4 bed3 bath | Sep 15 2023 | $507,507 | 22 | 🎯113% | 3785 sq ft | $134 |
 SOLD 16 Cape Charles Drive 4 bed2 bath | Aug 11 2023 | $497,500 | 42 | 98% | 2821 sq ft | $176 |
5 month gap in market activity | ||||||
 SOLD 30 Ashburn Place 4 bed2 bath | Mar 10 2023 | $540,000 | 183 | 98% | 3072 sq ft | $176 |
6 month gap in market activity | ||||||
 SOLD 6 Redcliffe Road 4 bed3 bath | Sep 2 2022 | $784,900 | 31 | 🎯101% | 4154 sq ft | $189 |
 SOLD 3 Providence Square 4 bed2 bath | Aug 19 2022 | $480,000 | 38 | 96% | 2463 sq ft | $195 |
 SOLD 102 Saint Augustine Drive 4 bed3 bath | Jul 28 2022 | $445,000 | 97 | 🎯101% | 1877 sq ft | $237 |
2 month gap in market activity | ||||||
 SOLD 1 Saint Augustine Drive 4 bed2 bath | May 6 2022 | $525,000 | 43 | 🎯100% | 2927 sq ft | $179 |
4 month gap in market activity | ||||||
 SOLD 105 Belgrade Drive 4 bed3 bath | Dec 23 2021 | $500,000 | 48 | 91% | 3300 sq ft | $152 |
 SOLD 6 Hudson Grove Court 4 bed2 bath | Dec 20 2021 | $405,000 | 35 | 98% | 3085 sq ft | $131 |
2 month gap in market activity | ||||||
 SOLD 101 Redcliffe Road 3 bed2 bath | Oct 12 2021 | $445,000 | 59 | 97% | 2367 sq ft | $188 |
 SOLD 2 Queens Way 4 bed2 bath | Oct 1 2021 | $330,000 | 44 | 86% | 2816 sq ft | $117 |
 SOLD 102 Port Royal Drive 4 bed3 bath | Sep 24 2021 | $475,000 | 15 | 🎯100% | 3528 sq ft | $135 |
4 month gap in market activity | ||||||
 SOLD 249 Providence Square 4 bed3 bath | May 7 2021 | $500,000 | 14 | 🎯103% | 2856 sq ft | $175 |
 SOLD 306 Providence Square 4 bed2 bath | Mar 30 2021 | $430,000 | 33 | 🎯100% | 3062 sq ft | $140 |
5 month gap in market activity | ||||||
 SOLD 1 St. Augustine Drive 4 bed2 bath | Oct 16 2020 | $425,000 | 49 | 🎯100% | 2927 sq ft | $145 |
6 month gap in market activity | ||||||
 SOLD 229 Providence Square 5 bed3 bath | Mar 26 2020 | $338,000 | 51 | 94% | 2880 sq ft | $117 |
6 month gap in market activity | ||||||
 SOLD 107 Saint Augustine Drive 5 bed3 bath | Aug 30 2019 | $515,000 | 32 | 🎯101% | 3513 sq ft | $147 |
208 Cape Charles Drive
$699,000
5 Belgrade Drive
$899,000
1 Redcliffe Road
$822,000
212 Cape Charles Drive
$1,220,000
12 Independence Drive
$690,000
3 Providence Square
$590,000
205 Redcliffe Road
$850,000
22 Jamestown Drive
$636,000
109 Providence Square
$615,000
105 Independence Drive
$630,000
237 Providence Square
$655,000
9 Fredricksburg Drive
$650,000
14 Queens Way
$700,000
21 Ashburn Place
$507,507
16 Cape Charles Drive
$497,500
30 Ashburn Place
$540,000
6 Redcliffe Road
$784,900
3 Providence Square
$480,000
102 Saint Augustine Drive
$445,000
1 Saint Augustine Drive
$525,000
105 Belgrade Drive
$500,000
6 Hudson Grove Court
$405,000
101 Redcliffe Road
$445,000
2 Queens Way
$330,000
102 Port Royal Drive
$475,000
249 Providence Square
$500,000
306 Providence Square
$430,000
1 St. Augustine Drive
$425,000
229 Providence Square
$338,000
107 Saint Augustine Drive
$515,000
Market Statistics
The Pelham Estates real estate market shows balanced market conditions. Homes typically sell within 48 days. With 0 active listings and 4 homes sold in the past year, A healthy balance between buyers and sellers.
Pricing
Median Price:$822,000
Average Price:$866,000
Property Details
Avg Bedrooms:4.0
Avg Bathrooms:2.5
Avg Lot Size:0.87 acres
Market Activity
Active Listings:0
Sold Last Year:4
Median Days to Sell:48 days
Community Info
Median Year Built:1971
New Construction:0%