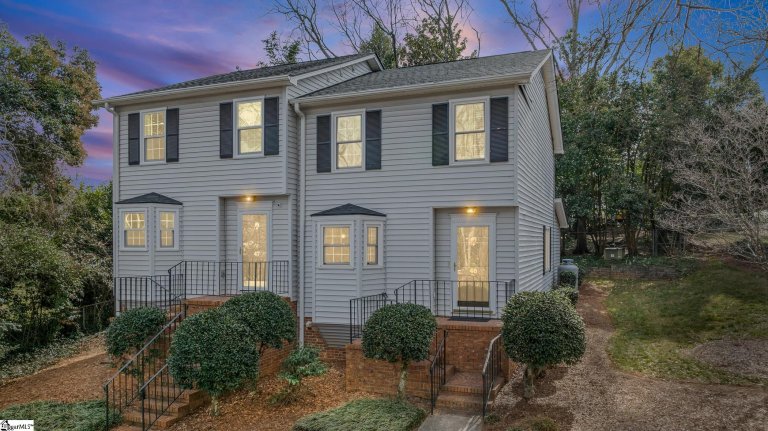
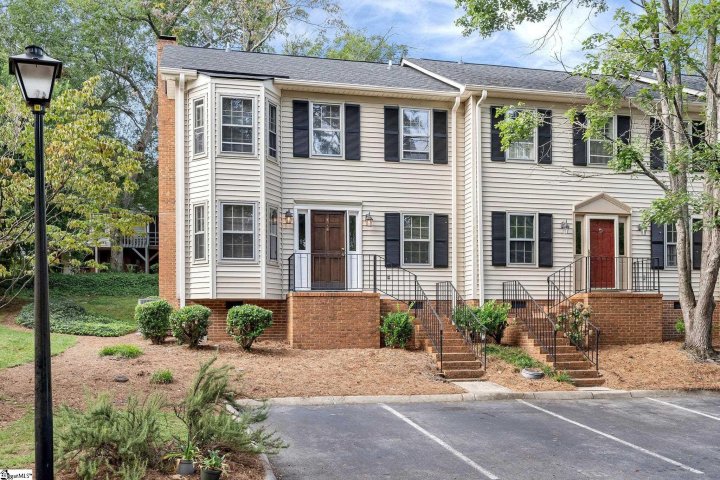
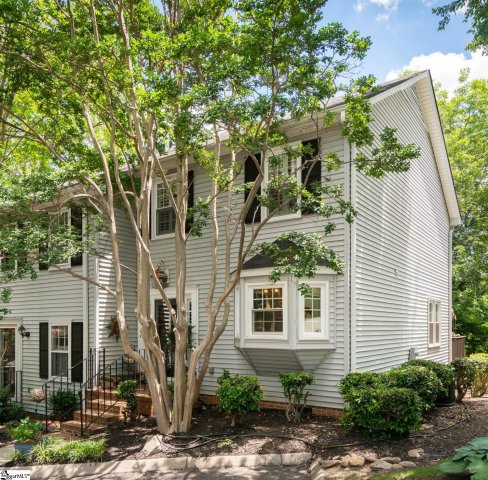
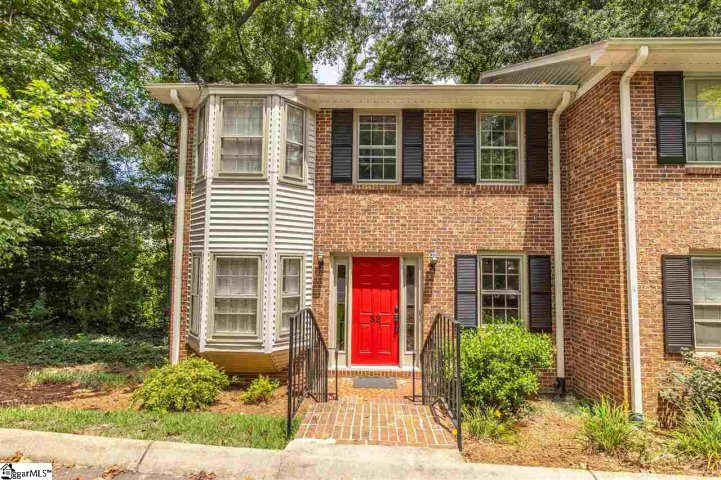
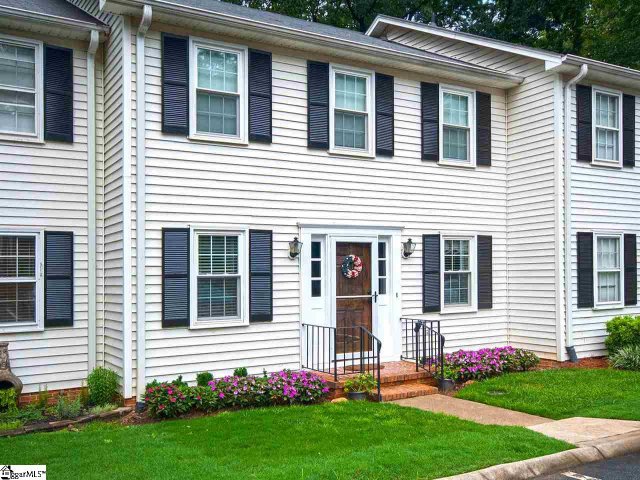
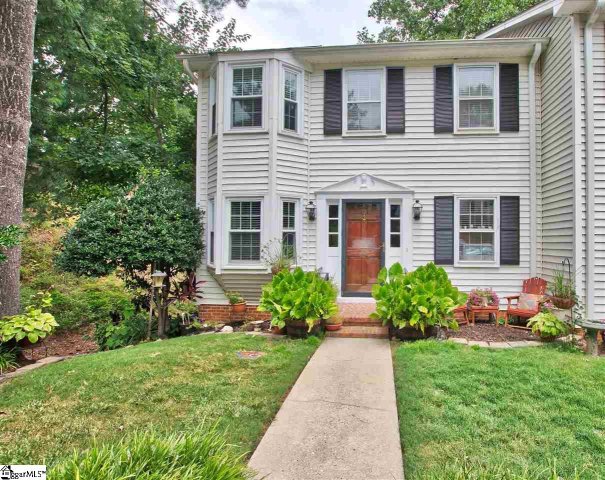
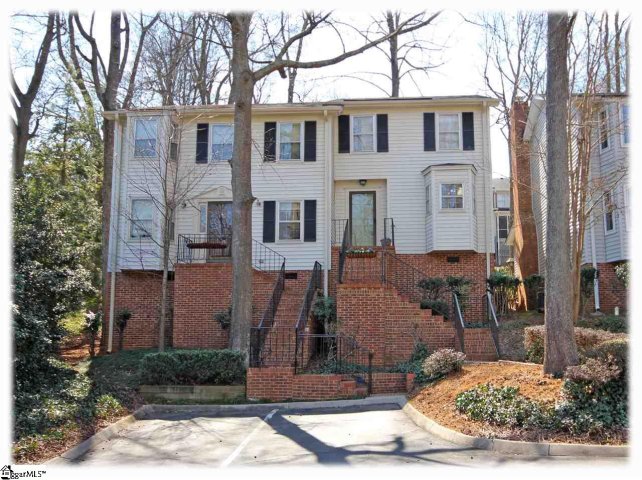
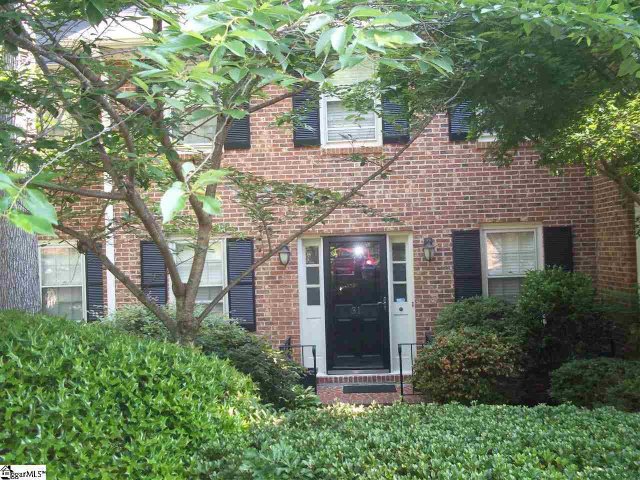
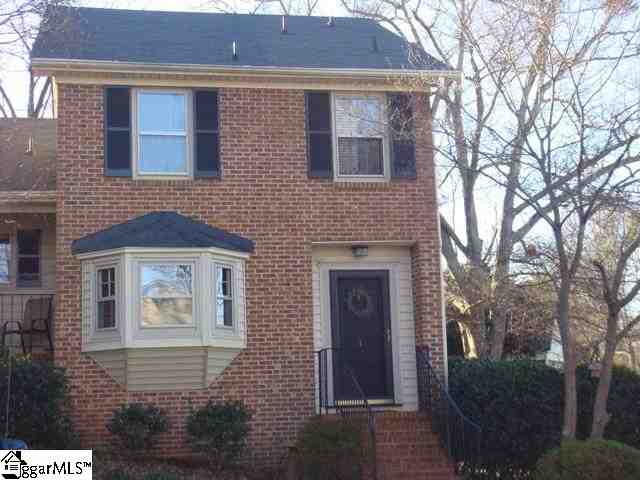
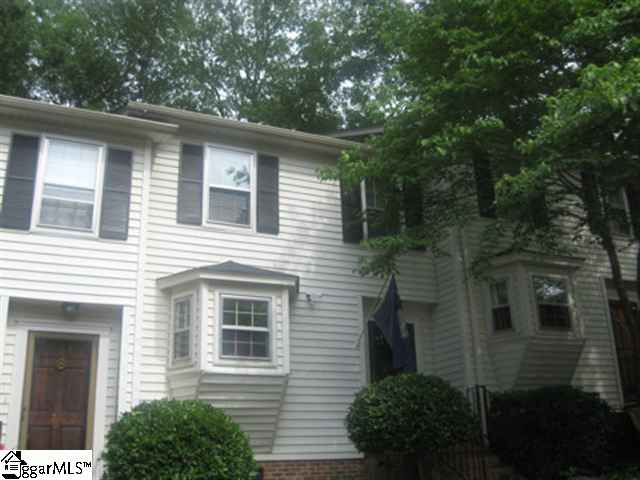
Sold
$370,000 $316/sqft
900 N Main Street #46
Greenville, SC 29609
2 bd · 2 ba · 1,172 sqft · 1982 · DOM: 73 d
Fireplace
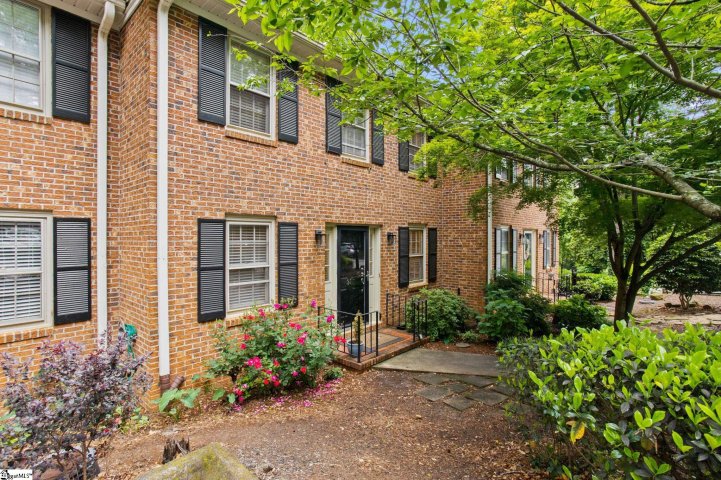
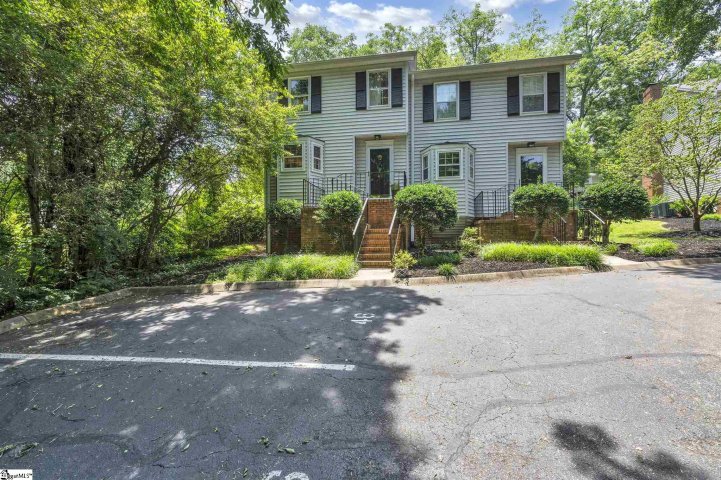
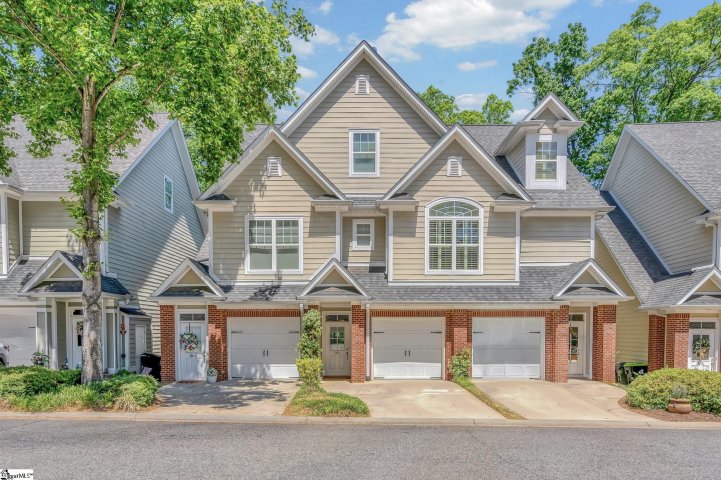
Northgate Trace delivers downtown Greenville living at its most convenient.
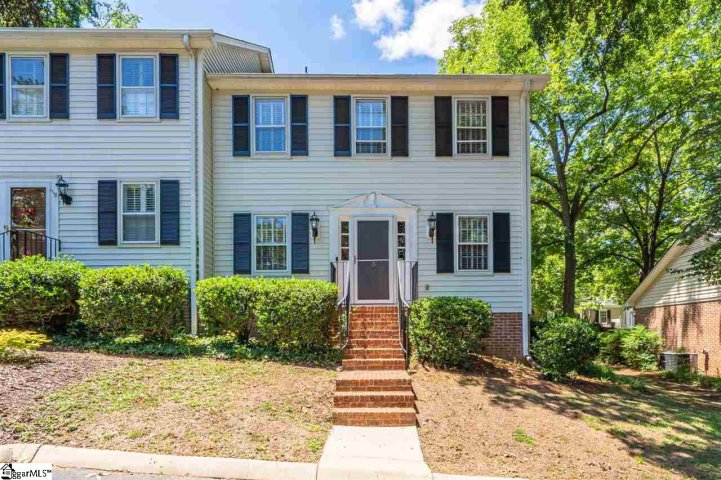
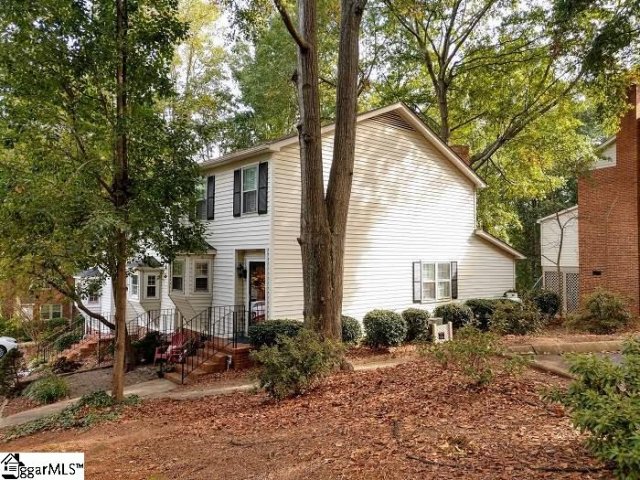
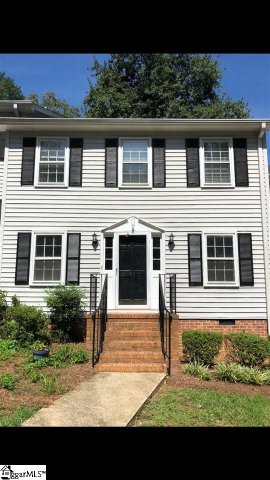
Listing summary: 43 Recently Sold
$370,000 $316/sqft
Greenville, SC 29609
2 bd · 2 ba · 1,172 sqft · 1982 · DOM: 73 d
$395,000 $262/sqft
Greenville, SC 29609
3 bd · 2 ba · 1,505 sqft · 1982 · DOM: 111 d
$397,609 $264/sqft
Greenville, SC 29609
3 bd · 2 ba · 1,506 sqft · 1982 · DOM: 51 d
$379,000 $329/sqft
Greenville, SC 29609
2 bd · 2 ba · 1,152 sqft · 1982 · DOM: 66 d
$374,609 $247/sqft
Greenville, SC 29609
3 bd · 2 ba · 1,517 sqft · 1982 · DOM: 48 d
$314,900 $194/sqft
Greenville, SC 29609
3 bd · 2 ba · 1,622 sqft · 1982 · DOM: 56 d
$339,000 $261/sqft
Greenville, SC 29609
2 bd · 2 ba · 1,300 sqft · 1983 · DOM: 239 d
$379,500 $229/sqft
Greenville, SC 29609
3 bd · 2 ba · 1,654 sqft · DOM: 63 d
$369,500 $261/sqft
Greenville, SC 29609
4 bd · 2 ba · 1,417 sqft
Downtown Greenville urban core
Walkability: High
$359,900 $232/sqft
Greenville, SC 29609
3 bd · 2 ba · 1,550 sqft · DOM: 29 d
$315,000 $236/sqft
Greenville, SC 29609
2 bd · 2 ba · 1,333 sqft · DOM: 27 d
$290,000 $214/sqft
Greenville, SC 29609
3 bd · 2 ba · 1,357 sqft · DOM: 65 d
$300,000 $219/sqft
Greenville, SC 29609-5560
2 bd · 2 ba · 1,370 sqft · 1982 · DOM: 25 d
$273,900 $199/sqft
Greenville, SC 29609
2 bd · 2 ba · 1,376 sqft · 1982 · DOM: 41 d
$275,000 $235/sqft
Greenville, SC 29609
2 bd · 2 ba · 1,172 sqft · DOM: 33 d
$265,000 $171/sqft
Greenville, SC 29609
3 bd · 2 ba · 1,547 sqft · DOM: 42 d
$279,900 $202/sqft
Greenville, SC 29609
3 bd · 2 ba · 1,385 sqft · 1982 · DOM: 177 d
$282,000 $186/sqft
Greenville, SC 29609
3 bd · 2 ba · 1,520 sqft · 1982 · DOM: 38 d
$268,500 $196/sqft
Greenville, SC 29609
2 bd · 2 ba · 1,373 sqft · 1985 · DOM: 80 d
$215,000 $153/sqft
Greenville, SC 29609
3 bd · 2 ba · 1,406 sqft · 1982 · DOM: 93 d
$285,000 $186/sqft
Greenville, SC 29609
3 bd · 2 ba · 1,532 sqft · 1982 · DOM: 88 d
$239,900 $230/sqft
Greenville, SC 29601
2 bd · 2 ba · 1,042 sqft · 1983 · DOM: 40 d
$287,500 $187/sqft
Greenville, SC 29609
3 bd · 2 ba · 1,537 sqft · 1981 · DOM: 72 d
$199,900 $123/sqft
Greenville, SC 29609
3 bd · 2 ba · 1,630 sqft · 1982 · DOM: 24 d
$261,400 $175/sqft
Greenville, SC 29609
3 bd · 2 ba · 1,496 sqft · 1982 · DOM: 76 d
$275,000 $188/sqft
Greenville, SC 29609
3 bd · 2 ba · 1,463 sqft · 1985 · DOM: 45 d
$215,000 $143/sqft
Greenville, SC 29609
3 bd · 2 ba · 1,499 sqft · 1984 · DOM: 50 d
$214,900 $137/sqft
Greenville, SC 29609
3 bd · 2 ba · 1,566 sqft · 1982 · DOM: 37 d
$177,500 $151/sqft
Greenville, SC 29609
2 bd · 2 ba · 1,172 sqft · DOM: 35 d
$173,000 $112/sqft
Greenville, SC 29609
2 bd · 2 ba · 1,548 sqft · 1982 · DOM: 49 d
$205,000 $132/sqft
Greenville, SC 29609
3 bd · 2 ba · 1,554 sqft · 1983 · DOM: 71 d
$188,900 $119/sqft
Greenville, SC 29609
3 bd · 2 ba · 1,584 sqft · 1980 · DOM: 119 d
$204,609 $136/sqft
Greenville, SC 29609
3 bd · 2 ba · 1,500 sqft · DOM: 27 d
$150,000 $130/sqft
Greenville, SC 29609
2 bd · 2 ba · 1,155 sqft · 1982 · DOM: 70 d
$189,900 $125/sqft
Greenville, SC 29609
3 bd · 2 ba · 1,516 sqft · 1984 · DOM: 42 d
$194,500 $130/sqft
Greenville, SC 29609
3 bd · 2 ba · 1,500 sqft · 1982 · DOM: 76 d
$162,900 $136/sqft
Greenville, SC 29609
2 bd · 2 ba · 1,200 sqft · 1982 · DOM: 119 d
$169,900 $140/sqft
Greenville, SC 29609
2 bd · 2 ba · 1,216 sqft · 1982 · DOM: 295 d
$189,900 $127/sqft
Greenville, SC 29609
3 bd · 2 ba · 1,500 sqft · 1983 · DOM: 120 d
$195,000 $128/sqft
Greenville, SC 29609
3 bd · 2 ba · 1,518 sqft · 1985 · DOM: 27 d
$179,900 $149/sqft
Greenville, SC 29609
2 bd · 2 ba · 1,205 sqft · 1982 · DOM: 63 d
$165,000 $138/sqft
Greenville, SC 29609
2 bd · 2 ba · 1,200 sqft · 1983 · DOM: 82 d
$195,000 $129/sqft
Greenville, SC 29609
3 bd · 2 ba · 1,513 sqft · 1982 · DOM: 199 d
AI-assisted overview based on MLS listing data for Northgate Trace, Greenville
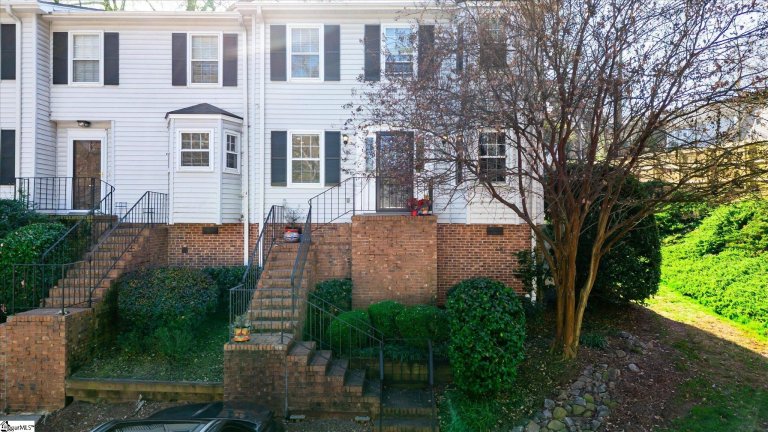
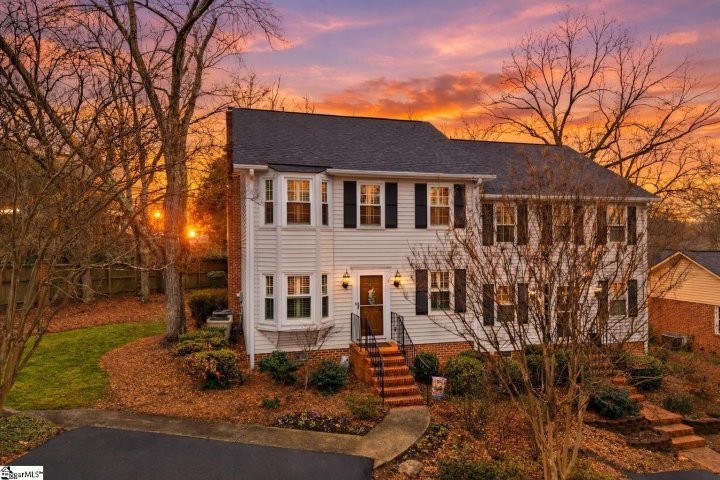
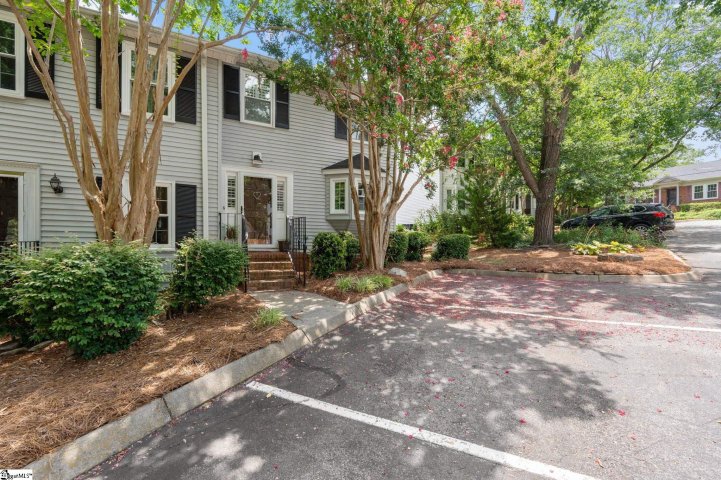
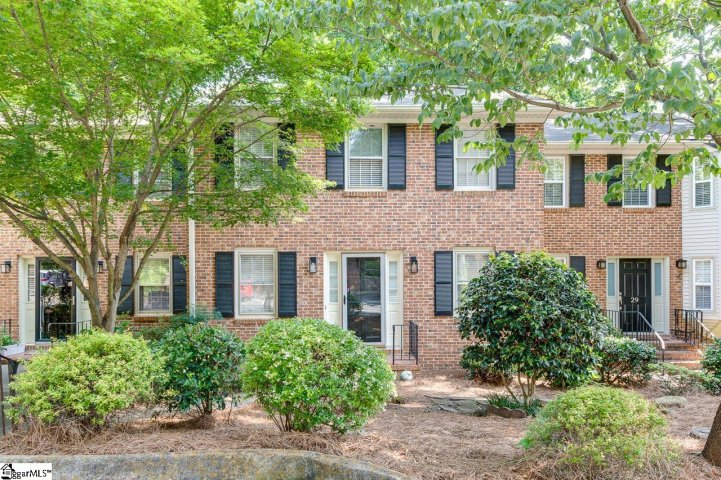
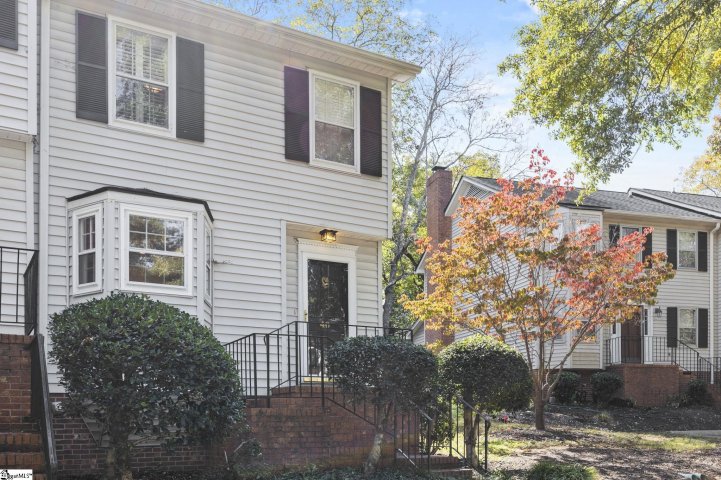
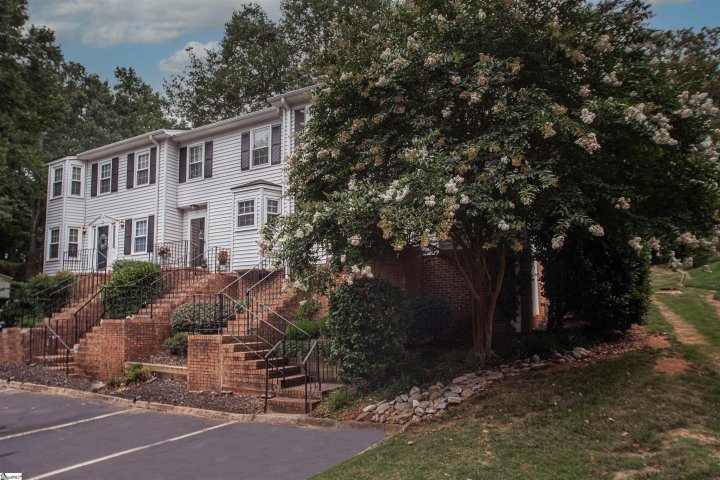
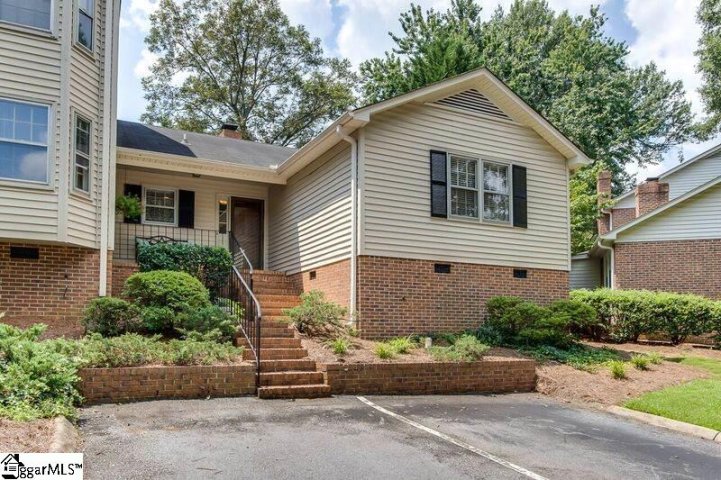
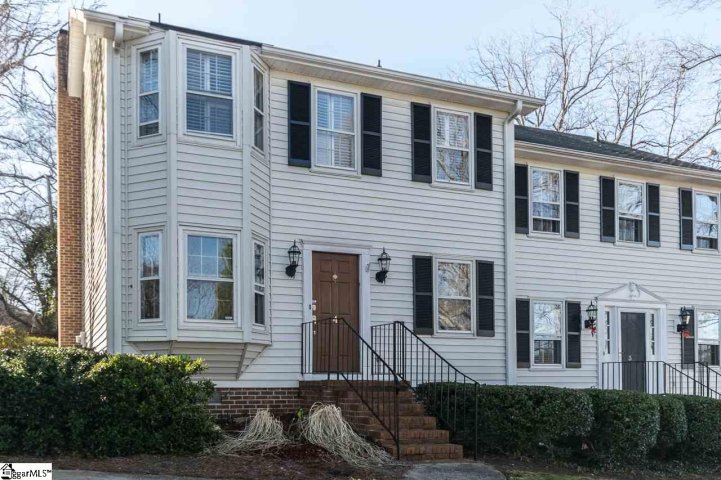
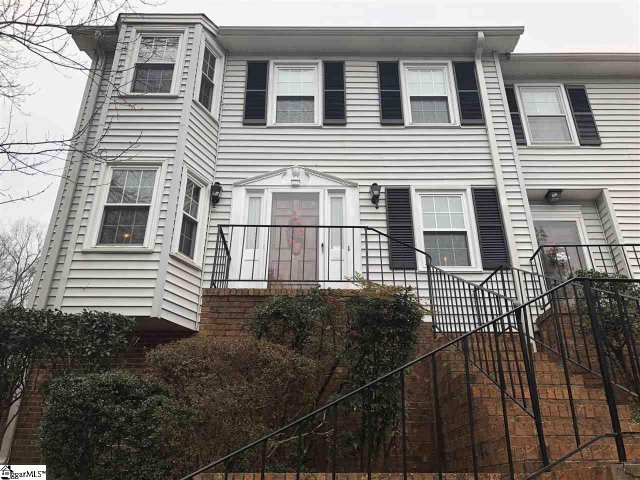
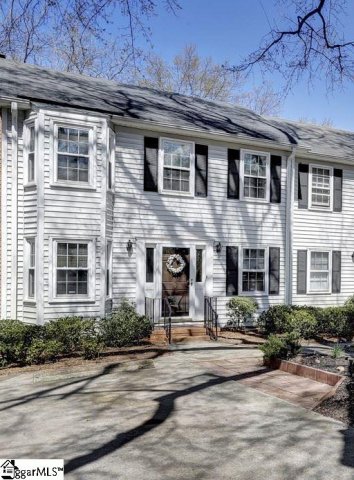
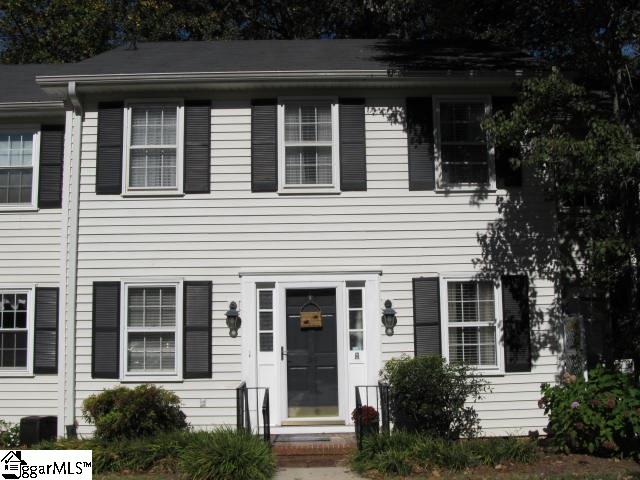
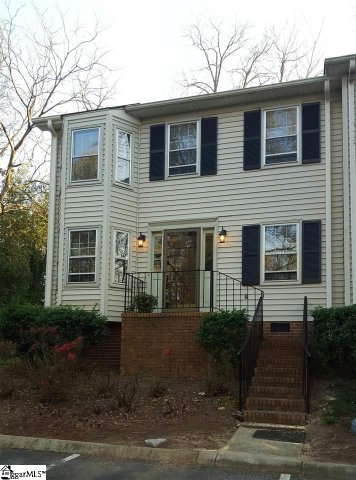
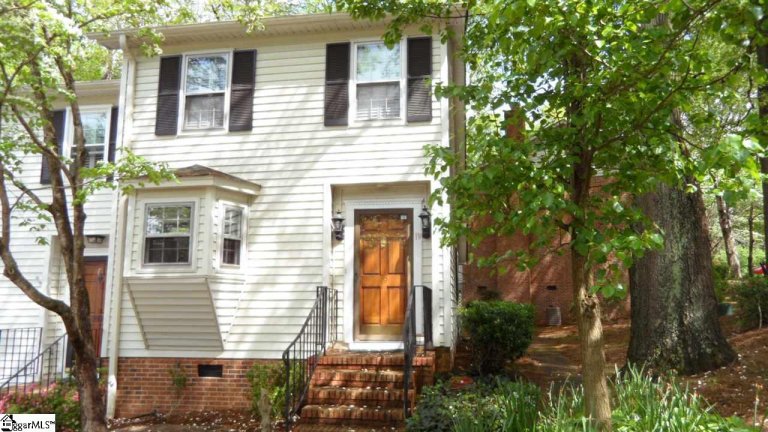
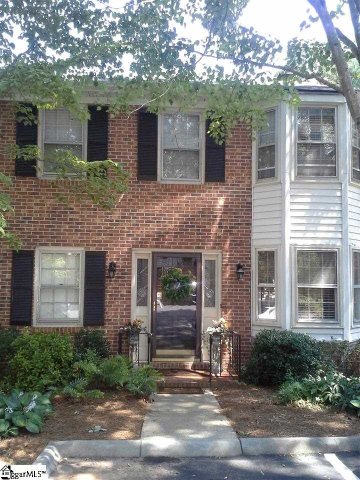
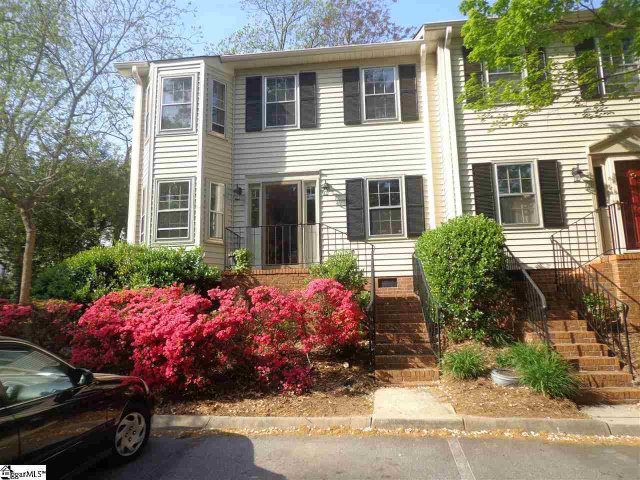
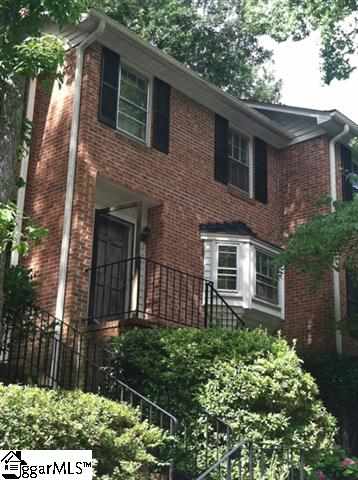
Northgate Trace delivers downtown Greenville living at its most convenient. Located on North Main Street, this established townhome community places residents within walking distance of the city's restaurants, parks, and cultural attractions while maintaining the quiet, wooded character of the beloved North Main neighborhood.
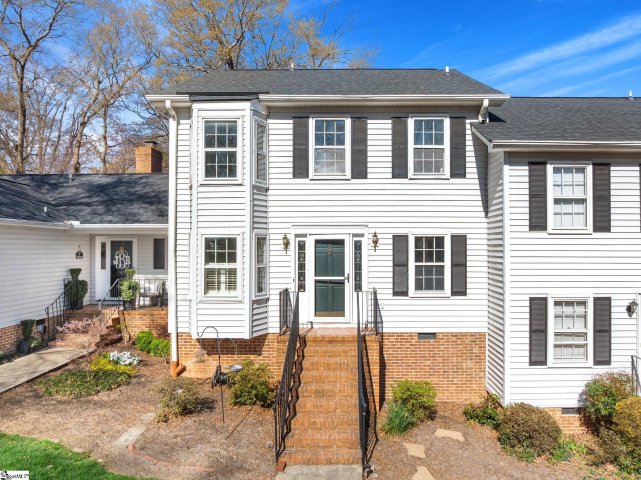
Built between 1980 and 1985, Northgate Trace consists of two-story townhomes ranging from 2 to 3 bedrooms. The location defines the lifestyle: McPherson Park sits just 0.4 miles away, Falls Park is 1.5 miles south, and Unity Park is equally close. Residents walk to Northgate Soda Shop, Bohemian Cafe, Methodical Coffee, and the shops along Stone Avenue. Downtown's restaurants, Fluor Field, and NOMA Square concerts are all within a mile. Harris Teeter grocery sits under half a mile from the community.
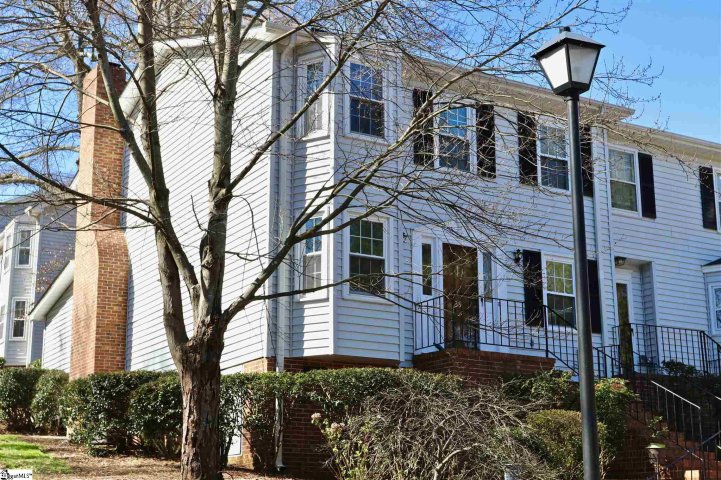
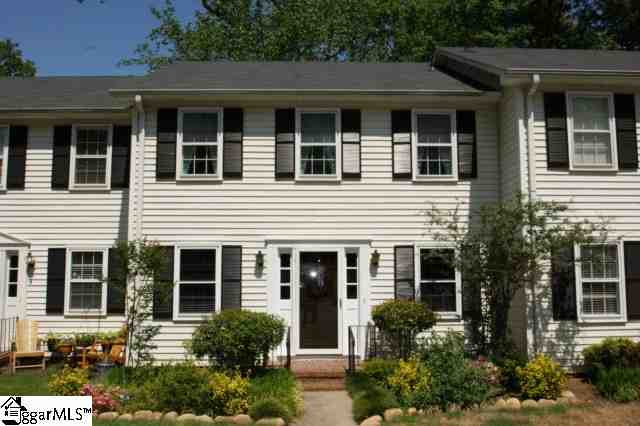
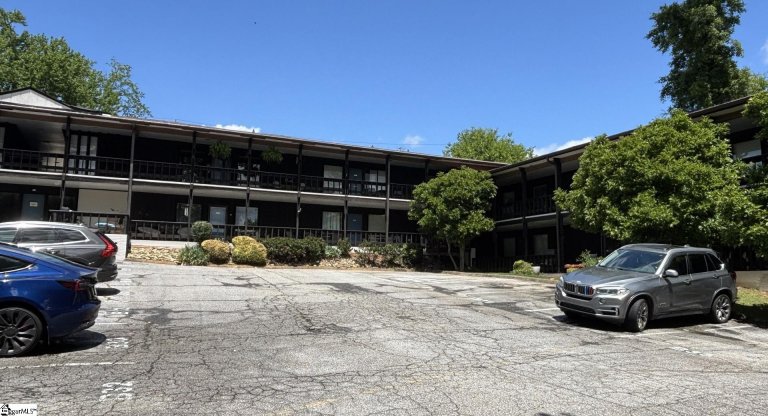
The low-maintenance appeal runs throughout the community. The HOA handles exterior maintenance, roof upkeep, lawn care, landscaping, trash service, and termite bond, allowing residents to spend time enjoying the surroundings rather than managing property upkeep. A community pool provides a gathering space during warmer months.
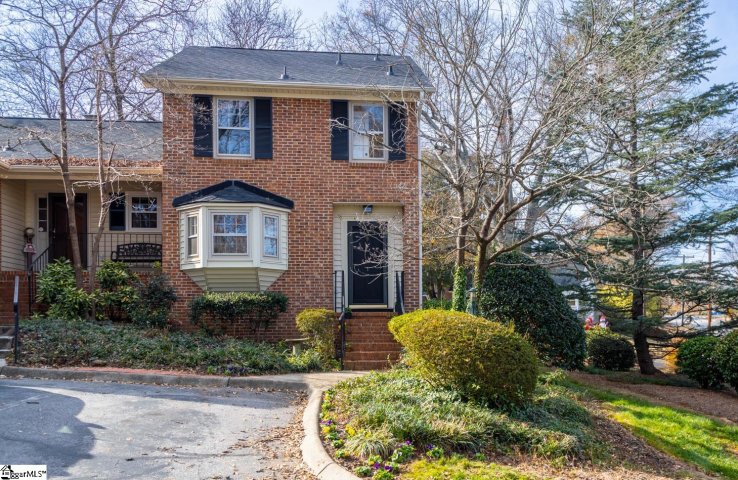
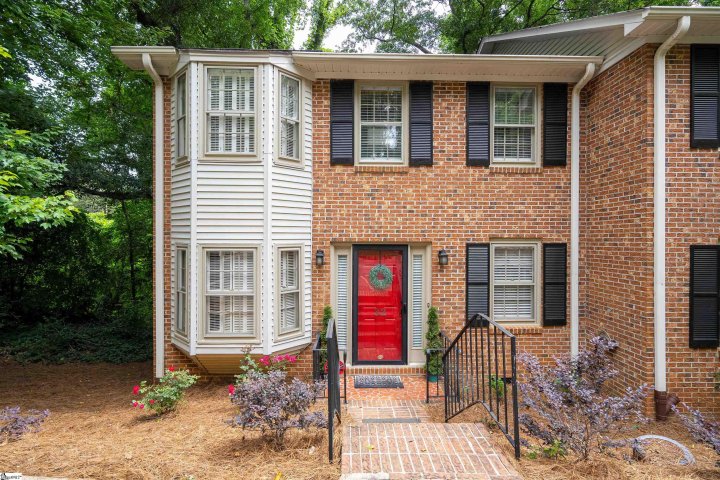
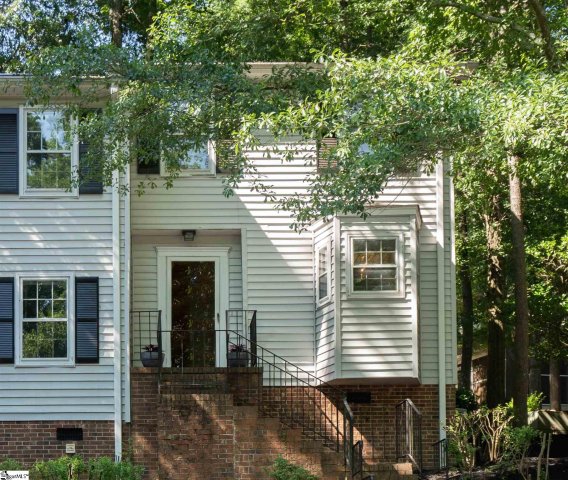
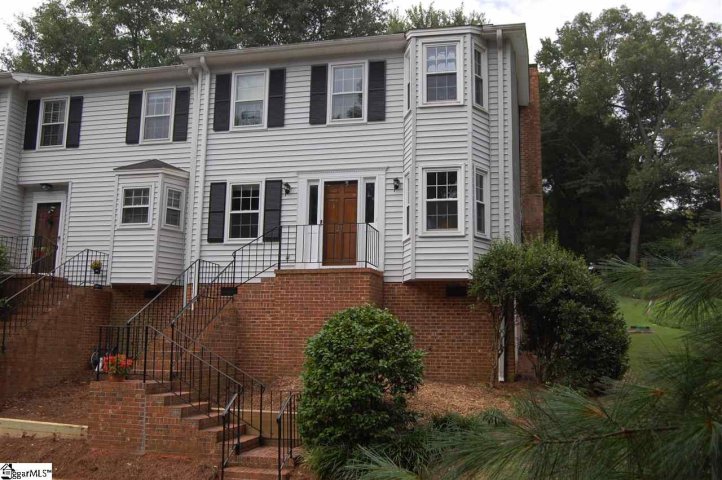
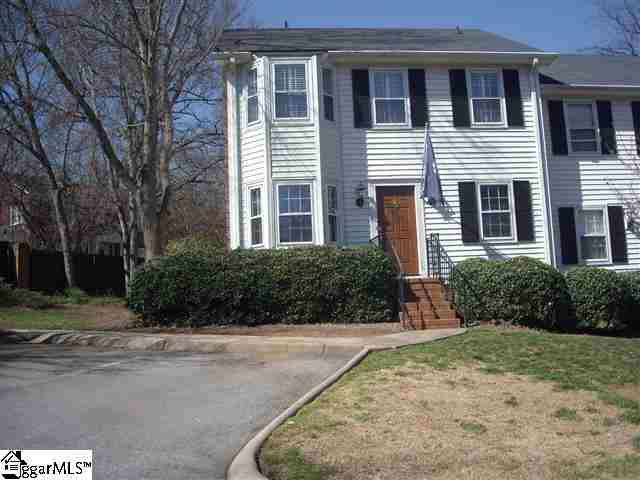
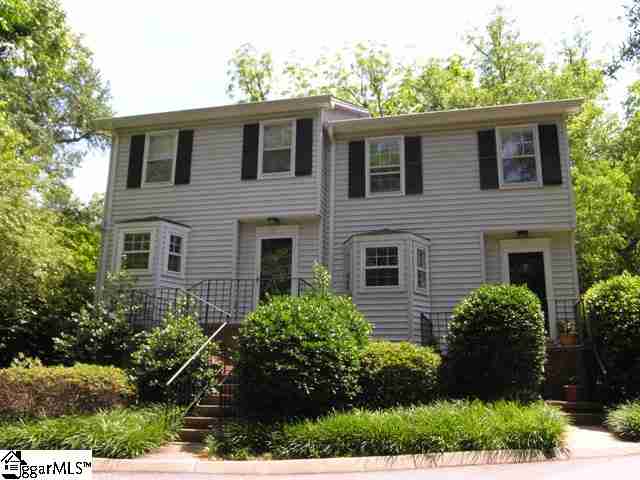
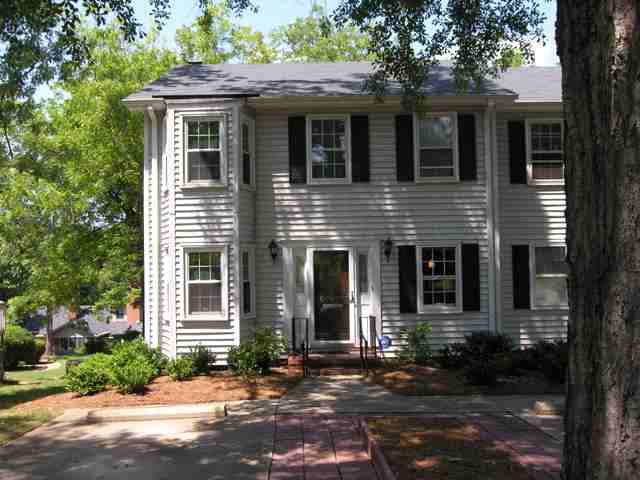
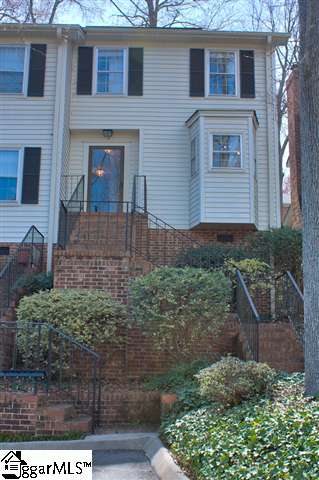
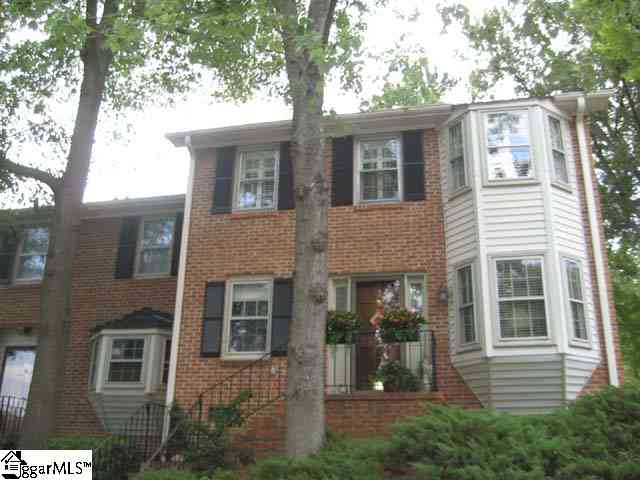
Most homes showcase hardwood floors on the main level, wood-burning fireplaces in the living areas, and granite or quartz countertops in updated kitchens. Bay windows appear frequently, adding natural light to primary bedrooms or front sitting rooms. The two-story layout places all bedrooms upstairs for privacy, with primary suites featuring en-suite bathrooms and ample closet space. Plantation shutters, stainless steel appliances, and upper-level laundry rooms are common throughout. Many units feature screened porches overlooking green space or wooded backyards, with select units backing to a creek.
Recent updates in the community include new windows, modernized kitchens with quartz countertops, luxury vinyl plank flooring, updated tile work in bathrooms, and newer HVAC systems and roofs. End units offer additional privacy and natural light.
The North Main neighborhood balances the energy of downtown proximity with a tranquil, tree-canopied setting. The community sits in the Stone Academy Elementary district, a highly-rated school frequently mentioned in marketing materials. League Middle School and Greenville High School serve the area. The mature hardwood trees and hidden feel of the neighborhood create a residential retreat despite being minutes from downtown's activity.
Northgate Trace appeals to buyers prioritizing walkability, minimal maintenance, and immediate access to Greenville's urban core. The combination of location, HOA services, and established neighborhood character continues to drive steady demand in this North Main enclave.
Talk to a local agent about homes in Northgate Trace, Greenville
Communities similar to Northgate Trace
 0.5 mi
 Middleton Place, Greenville
2 active · $296,250
 0.1 mi
 The Edge On North Main, Greenville
3 active · $480,000
 1.1 mi
 Cityhomes At McBee Station, Greenville
3 active · $635,000
 0.8 mi
 Noma Flats, Greenville
3 active · $349,000
 1.1 mi
 Richland At Cleveland Park, Greenville
2 active · $687,500
 0.6 mi
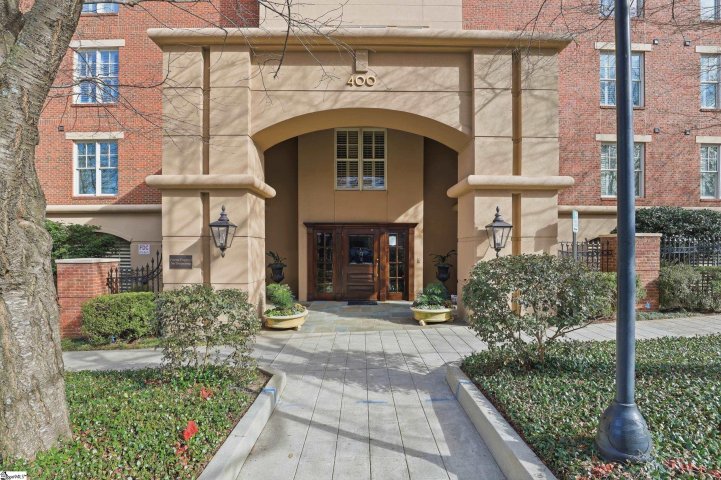
 400 North Main, Greenville
2 active · $937,500
Aggregated from MLS listing history for Northgate Trace, Greenville
The Northgate Trace real estate market shows buyer's market conditions. Homes typically sell within 64 days. With 0 active listings and 6 homes sold in the past year, buyers have more negotiating power and time to decide.
Save the homes you love
You've been exploring quite a few listings. Create a free account to save your favorites, follow communities, and get an alert the moment a new home hits the market.
Create your free account →Creating an account links your browsing on this site to it, so your saved homes and alerts can follow you. No spam — unsubscribe anytime.