Active
New
$1,825,000 $592/sqft
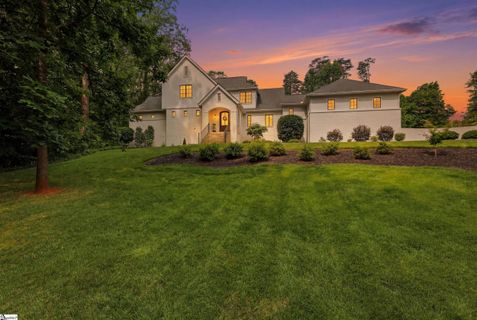
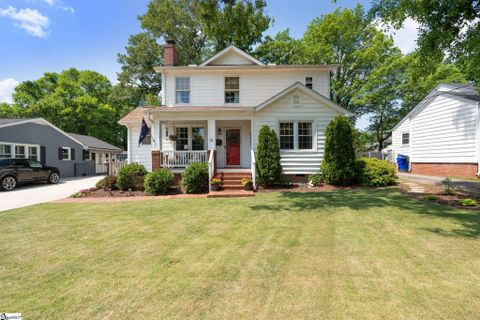
23 Buist Avenue
Greenville, SC 29609
3 bd · 3 ba · 3,085 sqft · 3 d ago
Fireplace Garage
North Main stands as one of Greenville's most established and sought-after in-town neighborhoods, combining historic character with modern urban convenience.
Community overview based on MLS listing data for North Main, Greenville
"One of Greenville's most walkable neighborhoods, where tree-lined streets meet downtown convenience just minutes from Main Street"
North Main stands as one of Greenville's most established and sought-after in-town neighborhoods, combining historic character with modern urban convenience. Located immediately north of downtown Greenville—most homes sit within a 5-10 minute walk or 1-2 minute drive to Main Street—this highly walkable community offers unparalleled access to Falls Park on the Reedy, the Swamp Rabbit Trail, downtown dining and entertainment, and Harris Teeter grocery. The neighborhood's tree-lined streets, sidewalk connectivity, and classic residential feel create a peaceful retreat that's simultaneously at the heart of the city's action.
The defining feature of North Main is its authentic urban walkability. Residents regularly walk to downtown restaurants, coffee shops (including neighborhood favorites), boutique shopping, and cultural attractions. The Swamp Rabbit Trail runs nearby, connecting to regional greenway systems, while Paris Mountain State Park sits just 9 minutes north. This rare combination of mature neighborhood character and immediate downtown access has made North Main one of Greenville's most competitive real estate markets, with 53 homes sold in the past year and steady demand despite limited inventory (12 active listings).
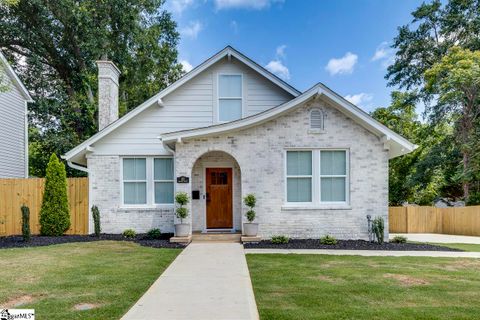
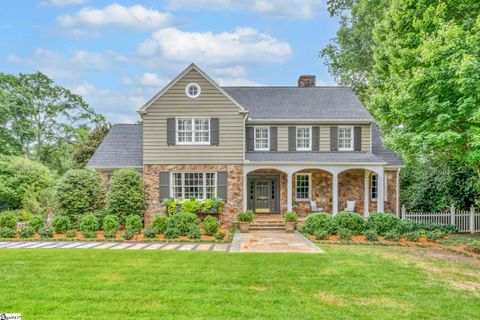
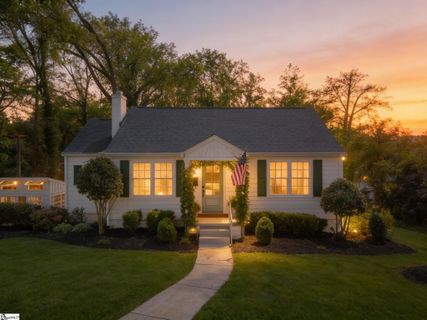
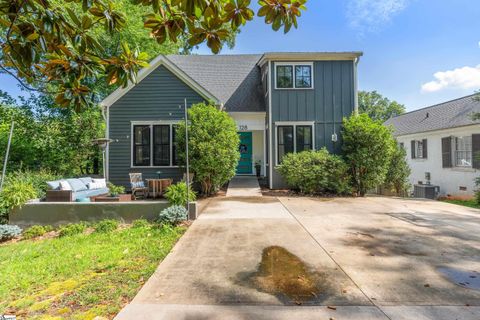
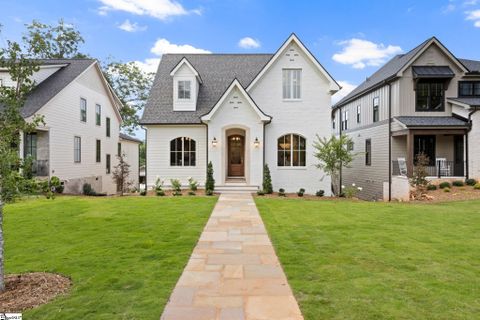
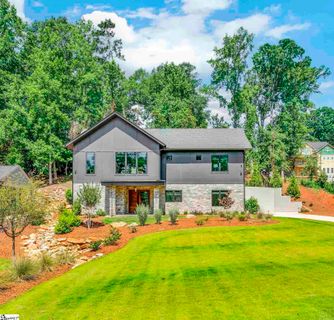
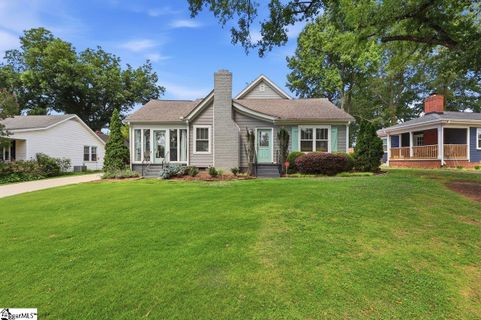
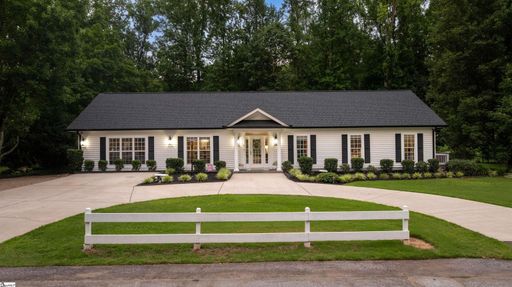
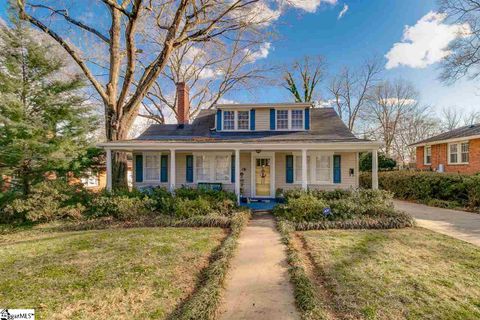
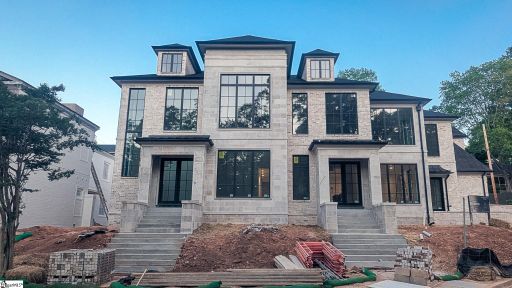
"Home to a rich architectural mix spanning eight decades, from 1940s brick bungalows to brand-new custom construction completed in 2026"
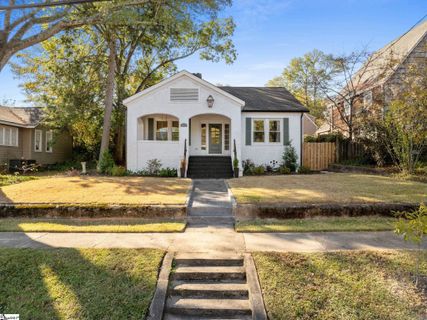
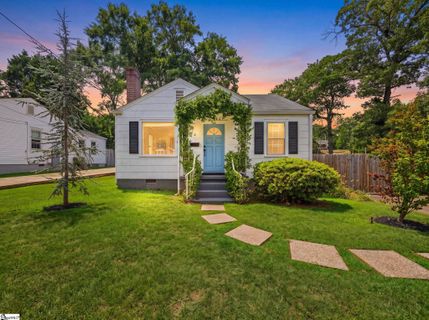
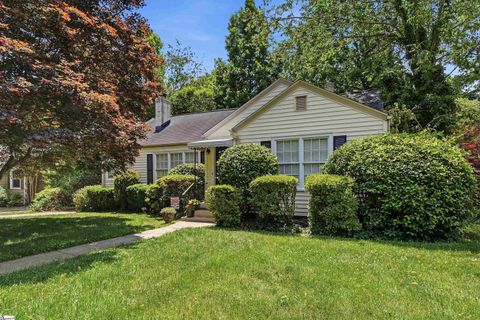
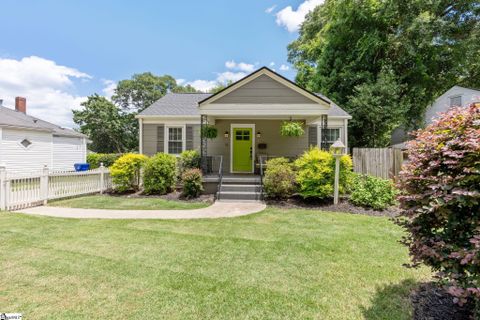
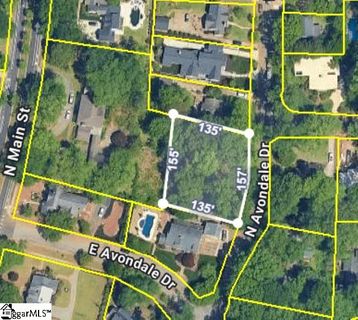
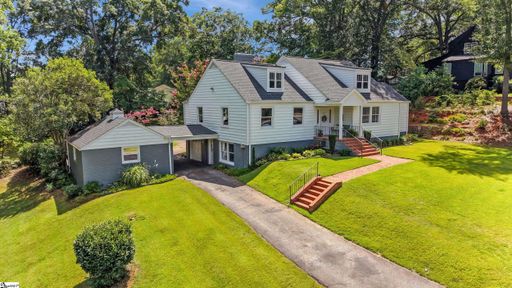
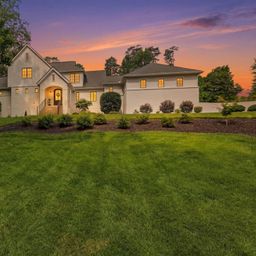
The neighborhood's appeal extends beyond location to its distinctive architectural character. Classic brick bungalows and mid-century homes from the 1940s-1960s predominate, many featuring original hardwood floors, covered front porches, and generous lots averaging 0.29 acres (12,566 sq ft). Approximately 21% of homes are marketed as bungalows, while historic renovations emphasize period details like original millwork, hardwood floors, and brick construction. Newer construction and major renovations (2015-2026) have introduced modern designs—including Scandinavian-inspired and contemporary craftsman styles—while maintaining the neighborhood's residential scale.
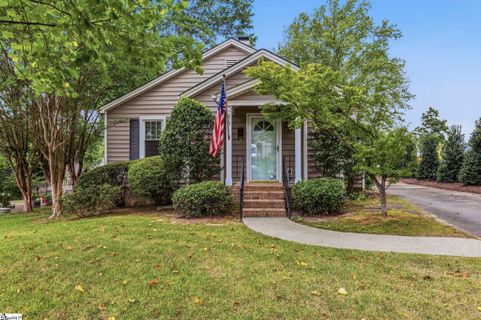
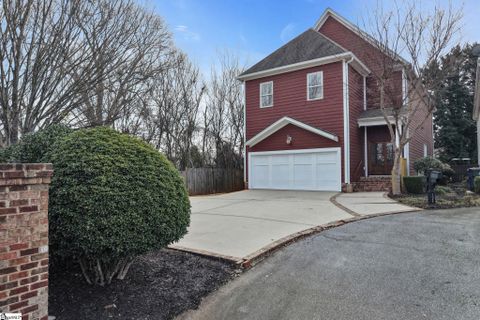
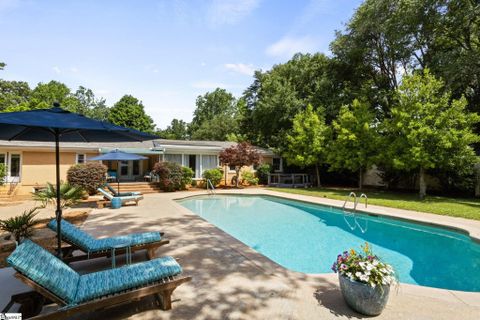
Outdoor living is central to North Main's lifestyle. Covered porches (46% of homes), decks (36%), and fenced yards (34%) provide private outdoor spaces, while wood-burning fireplaces (44% of homes) add warmth and ambiance indoors. The area's mature landscaping, tree-lined streets, and established gardens contribute to its park-like setting. Basement spaces appear in approximately 32% of homes, offering flex space for home offices, recreation rooms, or guest suites in the urban setting where garages are relatively rare (16% of homes).
North Main is zoned for Stone Academy Elementary (frequently mentioned for its convenience and walkability), League Academy Middle School, and Greenville High School. The neighborhood's central location provides quick access to Greenville's employment centers, with downtown offices within walking distance and major corridors easily accessible. Cultural amenities abound: Greenville County's Main Branch Library sits 7 minutes away, while the Peace Center, museums, and downtown events are all within a 10-minute stroll.
The historic Earle Street section—mentioned prominently in listings—represents one of the neighborhood's most established enclaves, known for neighborhood traditions, community events, and particularly strong resident connections. This area exemplifies the community spirit that defines North Main, where neighbors know one another and sidewalk culture thrives.
Palmetto Park Realty Team · Greenville
Ask about North Main — we answer fast
See what it's worth — your home's own sale history plus recent North Main sales, free.
What's my home worth?Communities similar to North Main
 1.3 mi
 Hampton-Pinckney Historic, Greenville
4 active · $247,601
 1.1 mi
 University Park, Greenville
3 active · $515,000
 2.5 mi
 Lake Forest, Greenville
4 active · $725,307
 1.0 mi
 Stone Lake, Greenville
2 active · $562,500
 3.3 mi
 Augusta Road, Greenville
19 active · $950,000
 1.9 mi
 Downtown, Greenville
23 active · $725,000
Showing 1-48+ recently sold in North Main, Greenville
| Property | Sold | Sold Price | Days on Market | Size | Sold to Ask | Sold $/SF |
|---|---|---|---|---|---|---|
| | Jul 24 2026 | $1,300,000 | 103 | 3,222 sq ft | 94.3% | $403 |
| | Jul 17 2026 | $574,000 | 50 | 1,758 sq ft | 95.7% | $327 |
| | Jul 10 2026 | $365,000 | 34 | 839 sq ft | 97.4% | $435 |
| | Jul 2 2026 | $844,000 | 40 | 2,063 sq ft | 96.5% | $409 |
| | Jun 26 2026 | $327,000 | 49 | 1,077 sq ft | 99.4% | $304 |
| | Jun 23 2026 | $1,825,000 | 53 | 3,250 sq ft | 107.4% | $562 |
| | Jun 22 2026 | $1,130,000 | 32 | 2,607 sq ft | 95.0% | $433 |
| | Jun 16 2026 | $775,000 | 56 | 1,799 sq ft | 100.0% | $431 |
| | Jun 11 2026 | $522,000 | 55 | 1,572 sq ft | 95.1% | $332 |
| | Jun 10 2026 | $660,000 | 35 | 1,448 sq ft | 97.8% | $456 |
| | May 21 2026 | $1,460,000 | 34 | 3,500 sq ft | 100.7% | $417 |
| | May 21 2026 | $1,275,000 | 33 | 3,006 sq ft | 94.4% | $424 |
| | May 20 2026 | $775,000 | 31 | 2,000 sq ft | 100.0% | $388 |
| | May 15 2026 | $450,000 | 296 | — | 85.7% | — |
| | May 8 2026 | $575,000 | 42 | 1,620 sq ft | 96.0% | $355 |
| | May 1 2026 | $1,150,000 | 34 | 2,532 sq ft | 109.5% | $454 |
| | Apr 20 2026 | $975,000 | 52 | 2,182 sq ft | 98.8% | $447 |
| | Apr 8 2026 | $1,460,000 | 35 | 2,951 sq ft | 99.0% | $495 |
| | Apr 2 2026 | $383,500 | 20 | 1,200 sq ft | 109.6% | $320 |
| | Mar 27 2026 | $1,060,000 | 65 | 2,211 sq ft | 94.2% | $479 |
| | Mar 13 2026 | $340,000 | 27 | 1,005 sq ft | 101.5% | $338 |
| | Feb 27 2026 | $1,150,000 | 163 | 3,341 sq ft | 92.4% | $344 |
| | Feb 27 2026 | $462,500 | 125 | 1,078 sq ft | 98.4% | $429 |
| | Feb 26 2026 | $822,000 | 49 | 3,104 sq ft | 91.3% | $265 |
| | Feb 26 2026 | $1,323,000 | 47 | 3,528 sq ft | 98.0% | $375 |
| | Feb 18 2026 | $1,615,000 | — | 3,966 sq ft | 100.0% | $407 |
| | Feb 6 2026 | $855,000 | 107 | 2,304 sq ft | 97.6% | $371 |
| | Jan 30 2026 | $305,000 | 43 | 1,896 sq ft | 92.4% | $161 |
| | Jan 30 2026 | $345,000 | — | 876 sq ft | 100.0% | $394 |
| | Jan 13 2026 | $750,000 | 327 | — | 96.9% | — |
| | Dec 30 2025 | $1,050,000 | 94 | 2,425 sq ft | 95.5% | $433 |
| | Dec 30 2025 | $650,000 | — | 1,718 sq ft | 100.0% | $378 |
| | Dec 12 2025 | $727,000 | 139 | 2,483 sq ft | 97.1% | $293 |
| | Dec 12 2025 | $810,000 | 37 | 2,226 sq ft | 102.7% | $364 |
| | Nov 21 2025 | $501,500 | 160 | 1,826 sq ft | 100.0% | $275 |
| | Nov 21 2025 | $1,325,000 | 129 | 3,560 sq ft | 95.3% | $372 |
| | Oct 30 2025 | $600,000 | 131 | 1,893 sq ft | 92.3% | $317 |
| | Oct 22 2025 | $459,000 | 56 | 1,165 sq ft | 100.0% | $394 |
| | Oct 20 2025 | $590,000 | 37 | 1,647 sq ft | 98.3% | $358 |
| | Oct 17 2025 | $611,000 | 42 | 1,727 sq ft | 101.0% | $354 |
| | Oct 10 2025 | $380,000 | 59 | 1,620 sq ft | 97.7% | $235 |
| | Oct 7 2025 | $675,000 | 38 | 1,811 sq ft | 100.0% | $373 |
| | Oct 1 2025 | $1,370,000 | 50 | 2,917 sq ft | 97.9% | $470 |
| | Sep 26 2025 | $900,000 | 76 | 2,502 sq ft | 95.2% | $360 |
| | Sep 23 2025 | $655,000 | 40 | 2,096 sq ft | 99.4% | $313 |
| | Aug 29 2025 | $350,000 | 133 | 1,254 sq ft | 82.4% | $279 |
| | Aug 25 2025 | $275,000 | 17 | 1,712 sq ft | 94.9% | $161 |
| | Aug 11 2025 | $710,000 | 51 | 1,750 sq ft | 97.3% | $406 |
Closed sales from MLS history for North Main, Greenville
North Main median sale price is $718,500, up 28.3% from a year ago; Greenville is up 5.8%.
+4 outside price range.
The North Main real estate market shows balanced market conditions. Homes typically sell within 58 days. With 18 active listings and 58 homes sold in the past year, a healthy balance exists between buyers and sellers.
Listings taken off the market in the past year in North Main, Greenville
Greenville, SC 29609-4737
5 bd · 3 ba · 3,523 sqft
Greenville, SC 29609
2 bd · 1 ba · 960 sqft
Greenville, SC 29609
4 bd · 2 ba · 2,984 sqft
Greenville, SC 29609-4825
4 bd · 2 ba · 1,865 sqft
Greenville, SC 29609
3 bd · 2 ba · 1,508 sqft
Greenville, SC 29609
2 bd · 1 ba · 1,010 sqft
Greenville, SC 29609
4 bd · 2 ba · 2,414 sqft
Greenville, SC 29609
2 bd · 1 ba · 960 sqft
Greenville, SC 29609-4825
4 bd · 2 ba · 1,865 sqft
Greenville, SC 29609
2 bd · 1 ba · 1,010 sqft
Greenville, SC 29609
4 bd · 3 ba · 3,050 sqft
Greenville, SC 29609
2 bd · 1 ba · 1,010 sqft
Greenville, SC 29609
3 bd · 3 ba · 2,845 sqft
Greenville, SC 29609
3 bd · 2 ba · 2,412 sqft
Greenville, SC 29609
3 bd · 2 ba · 1,572 sqft
Greenville, SC 29609-4625
5 bd · 5 ba · 3,800 sqft
Greenville, SC 29609
5 bd · 3 ba · 4,326 sqft
Greenville, SC 29609
4 bd · 5 ba · 3,852 sqft
Greenville, SC 29609
3 bd · 2 ba · 1,952 sqft
Greenville, SC 29609
2 bd · 1 ba · 1,010 sqft
These homes are no longer available, but they show recent pricing and listing activity in North Main. Our agents can help you watch for new listings in this area.
Contact an agentFree account needed — create one to continue viewing homes.
Members see everything — free👋 Still browsing North Main?
Full photos, price history, and every active & pending home in North Main with a free account.
Palmetto Park Realty Team
 $3M
$3M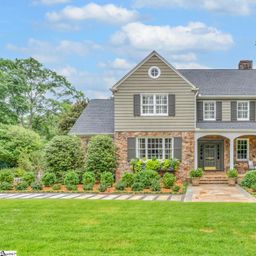 $2.83M
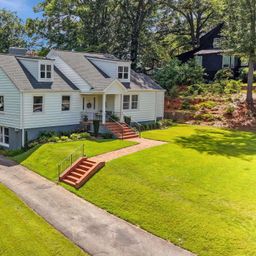 $1.82M
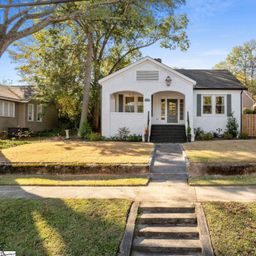 $1.12M
 $1.03M
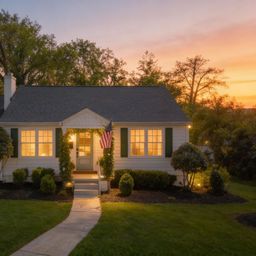 $945K
$945KCheck your messages
We sent a code to .
Verify your number and we'll text you price drops and new North Main listings. 1–2 texts a month, stop anytime.
Enjoy full access to this home and every home on Palmetto Park.