Active
$284,900 $215/sqft
5 Courtney Circle
Greenville, SC 29617
2 bd · 2 ba · 1,323 sqft · 1951 · 1 mo ago
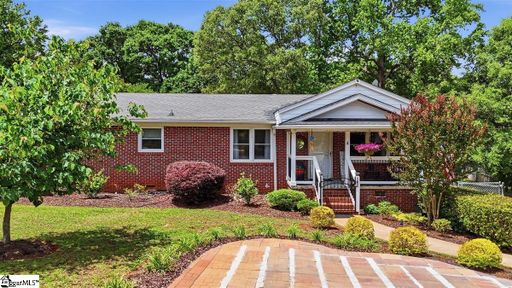
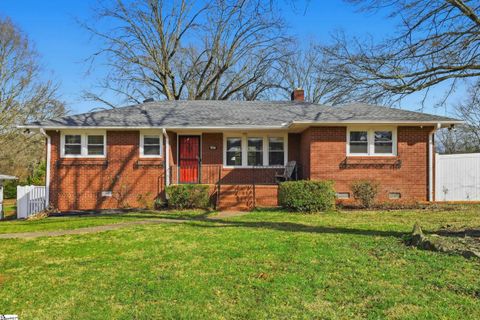
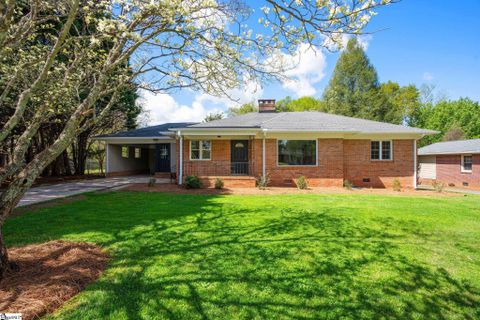
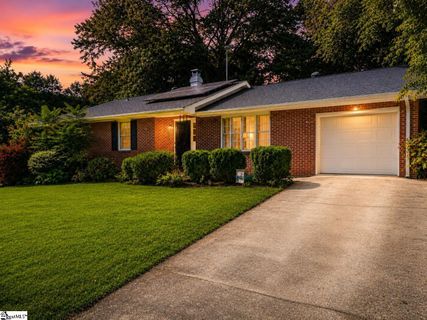
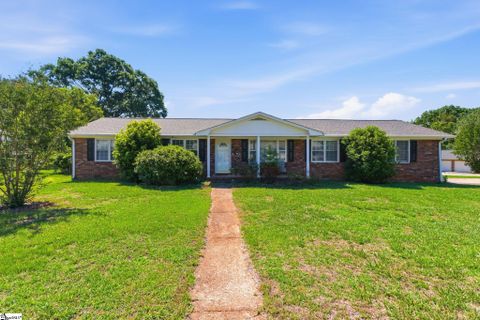
Casa Loma offers a rare combination of location, value, and classic mid-century character in an established Greenville neighborhood.
Community overview based on MLS listing data for Casa Loma, Greenville
Casa Loma offers a rare combination of location, value, and classic mid-century character in an established Greenville neighborhood. Located just 10-15 minutes from downtown Greenville and 8 minutes to Travelers Rest, this all-brick ranch community sits in the coveted corridor between two of the Upstate's most vibrant districts, with Furman University 5 minutes away and the Swamp Rabbit Trail under 2 miles from most homes. The neighborhood's strategic positioning provides residents with walkable access to the Tomato Vine Farmer's Market and a 3-minute drive to Cherrydale Shopping Center, while Paris Mountain State Park's hiking trails are an easy drive away.
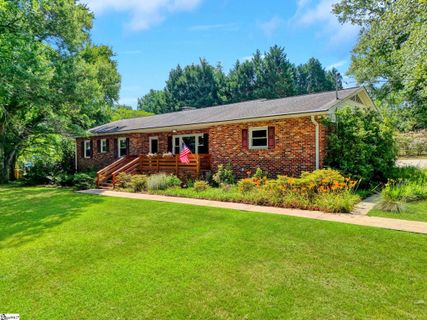
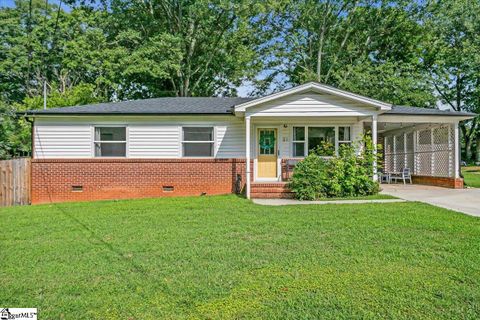
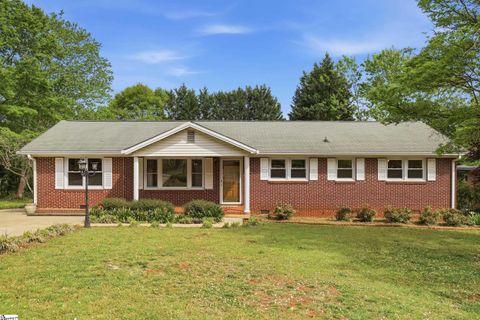
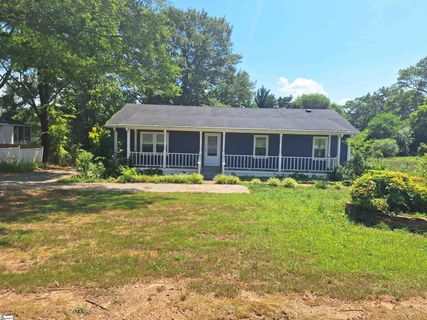
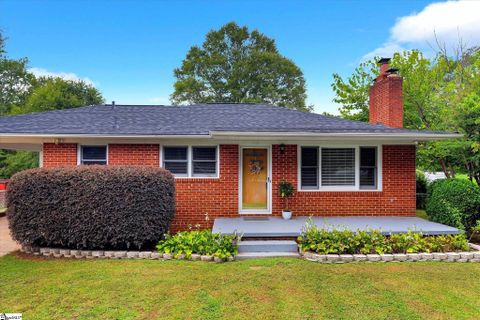
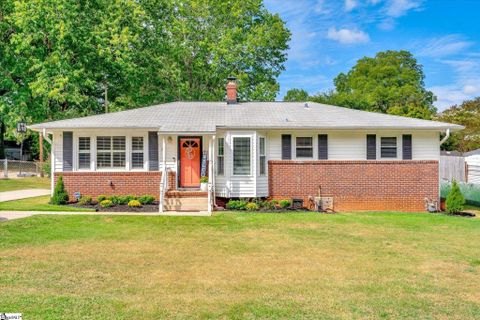
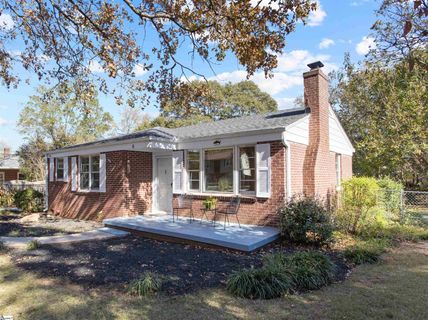
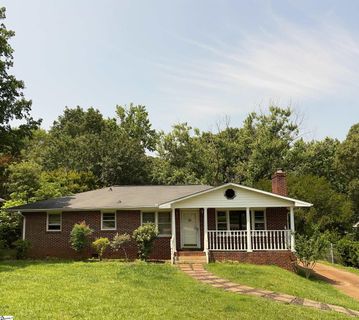
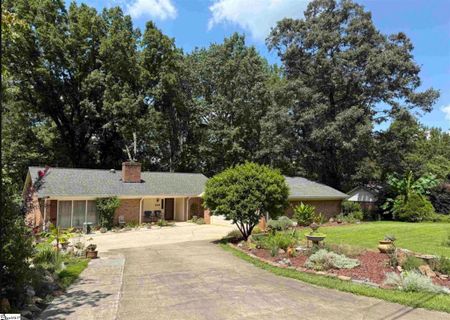
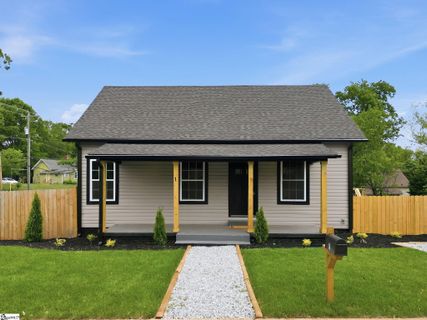
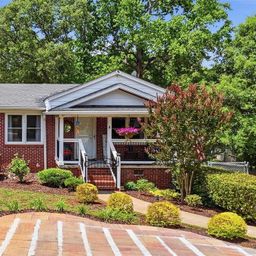
Built primarily between 1955 and 2001, Casa Loma's housing stock consists almost exclusively of traditional brick ranch homes on generous lots averaging 0.30-0.40 acres. These single-story homes showcase the enduring appeal of solid brick construction, original hardwood floors, and practical one-level living. The neighborhood's mature tree canopy—featuring hardwoods, Japanese maples, and established landscaping—creates a shaded, park-like setting on level, walkable streets. Most homes sit on quiet residential streets and cul-de-sacs where neighbors walk dogs and children play basketball in driveways.
Homes typically feature 2-4 bedrooms, original hardwood flooring throughout living areas and bedrooms, wood-burning or gas log fireplaces, and attached carports rather than enclosed garages. Fenced backyards are the norm, with approximately 75% of properties featuring privacy fencing and many including storage buildings or outbuildings for lawn equipment and tools. Front porches and rear decks provide outdoor living spaces, with some homes offering screened porches or sunrooms. A notable feature is the absence of a mandatory HOA in Casa Loma, providing residents with greater flexibility and lower ownership costs.
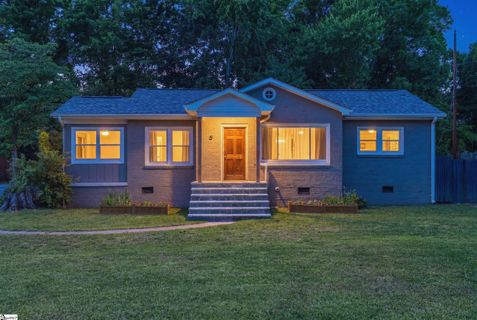
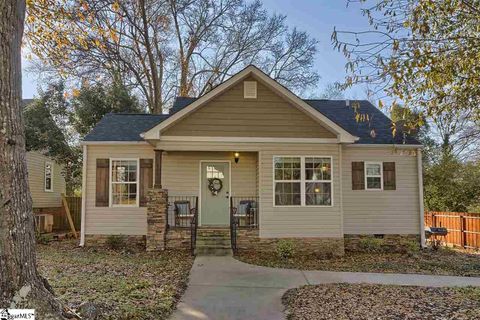
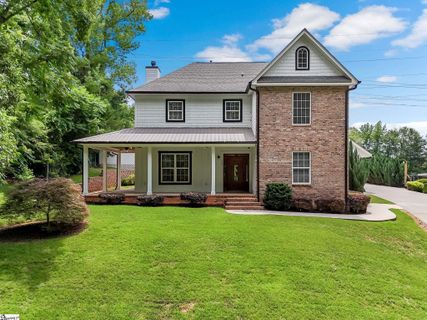
Recent sales reflect a mix of move-in ready updated homes and renovation opportunities. Well-maintained properties feature granite countertops, updated kitchens with stainless appliances, newer HVAC systems and roofs, luxury vinyl plank or refinished hardwood flooring, and modernized bathrooms. The community has attracted both primary homebuyers seeking affordable entry into a prime location and investors drawn to the area's strong rental demand, with several listings explicitly marketing Airbnb and long-term rental potential.
Casa Loma serves Duncan Chapel Elementary, Lakeview Middle, and Berea High schools. With prices ranging from the mid-$100,000s to low $300,000s and a current median of $270,000, the neighborhood offers accessible pricing in a location that commands premium value for its proximity to employment centers, recreation, and urban amenities. Current inventory is extremely limited with just 1 active listing and 3 sales in the past year, reflecting the neighborhood's appeal and low turnover among residents who value its central location and established character.
Palmetto Park Realty Team · Greenville
Ask about Casa Loma — we answer fast
See what it's worth — your home's own sale history plus recent Casa Loma sales, free.
What's my home worth?Communities similar to Casa Loma
 0.3 mi
 Pinehurst, Greenville
2 active · $332,450
 0.6 mi
 Northwood Hills, Greenville
3 active · $515,000
 1.1 mi
 San Souci Heights, Greenville
8 active · $302,400
 1.1 mi
 Buxton, Greenville
4 active · $449,900
 1.1 mi
 Mountain Shadow, Greenville
2 active · $352,450
 3.3 mi
 Woodside Mill, Greenville
3 active · $370,000
Showing 1-48+ recently sold in Casa Loma, Greenville
| Property | Sold | Sold Price | Days on Market | Size | Sold to Ask | Sold $/SF |
|---|---|---|---|---|---|---|
| | Jul 9 2026 | $259,999 | 366 | 1,104 sq ft | 100.0% | $236 |
| | May 28 2026 | $270,000 | 41 | 1,799 sq ft | 94.7% | $150 |
| | Feb 17 2026 | $285,000 | 21 | 1,371 sq ft | 98.6% | $208 |
| | Sep 5 2025 | $235,000 | 57 | 1,179 sq ft | 100.0% | $199 |
| | Sep 3 2025 | $255,000 | 25 | 1,081 sq ft | 98.8% | $236 |
| | Oct 15 2024 | $312,000 | 38 | 1,394 sq ft | 100.6% | $224 |
| | May 10 2024 | $252,000 | 30 | 1,552 sq ft | 100.8% | $162 |
| | Jan 16 2024 | $206,000 | 70 | 1,011 sq ft | 80.8% | $204 |
| | Aug 21 2023 | $173,000 | 79 | 1,095 sq ft | 100.0% | $158 |
| | Apr 6 2023 | $249,617 | 54 | 1,299 sq ft | 100.0% | $192 |
| | Apr 26 2022 | $210,000 | 31 | 1,098 sq ft | 109.1% | $191 |
| | Mar 14 2022 | $270,000 | 39 | 1,514 sq ft | 108.0% | $178 |
| | Jun 24 2021 | $235,000 | 28 | 2,245 sq ft | 104.4% | $105 |
| | Dec 11 2020 | $149,000 | 55 | 1,229 sq ft | 93.2% | $121 |
| | Oct 20 2020 | $217,500 | 45 | 1,850 sq ft | 96.7% | $118 |
| | Jul 2 2020 | $148,500 | 26 | 1,107 sq ft | 95.8% | $134 |
| | Jun 25 2020 | $200,000 | 40 | 1,733 sq ft | 103.1% | $115 |
| | Jun 22 2020 | $200,000 | 51 | 1,300 sq ft | 104.0% | $154 |
| | Apr 27 2020 | $194,000 | 53 | 2,176 sq ft | 99.5% | $89 |
| | Mar 18 2020 | $105,000 | 26 | 1,100 sq ft | 105.0% | $95 |
| | Jul 1 2019 | $100,000 | 53 | 1,120 sq ft | 85.1% | $89 |
| | Jun 14 2019 | $207,500 | 48 | 1,622 sq ft | 96.5% | $128 |
| | Apr 1 2019 | $264,300 | 43 | 2,202 sq ft | 97.9% | $120 |
| | Mar 14 2019 | $132,000 | 163 | 1,042 sq ft | 89.2% | $127 |
| | Oct 5 2018 | $121,000 | 27 | 1,265 sq ft | 100.8% | $96 |
| | Jun 12 2018 | $155,000 | 31 | 2,003 sq ft | 100.1% | $77 |
| | Feb 28 2018 | $132,650 | 69 | 1,283 sq ft | 91.5% | $103 |
| | Dec 1 2017 | $120,000 | 21 | 1,234 sq ft | 92.4% | $97 |
| | Nov 3 2016 | $106,500 | 114 | 1,328 sq ft | 102.9% | $80 |
| | Jul 27 2016 | $170,000 | 129 | 3,395 sq ft | 97.2% | $50 |
| | Jun 2 2016 | $116,000 | 64 | 1,080 sq ft | 97.6% | $107 |
| | Jan 29 2016 | $117,000 | 77 | 1,547 sq ft | 97.9% | $76 |
| | Dec 17 2015 | $135,000 | 344 | 1,862 sq ft | 96.8% | $73 |
| | Dec 17 2015 | $149,000 | 97 | 2,294 sq ft | 90.3% | $65 |
| | Oct 15 2015 | $120,000 | 48 | 1,299 sq ft | 100.0% | $92 |
| | Jul 22 2015 | $119,000 | 263 | 1,396 sq ft | 99.2% | $85 |
| | Jun 19 2015 | $136,000 | 67 | 1,624 sq ft | 100.8% | $84 |
| | Mar 26 2015 | $125,000 | 172 | 1,474 sq ft | 96.2% | $85 |
| | Jan 9 2015 | $78,000 | 203 | 1,619 sq ft | 94.5% | $48 |
| | Nov 20 2014 | $105,000 | 24 | 1,239 sq ft | 95.5% | $85 |
| | Jun 27 2014 | $60,000 | 54 | 1,395 sq ft | 92.4% | $43 |
| | May 28 2014 | $145,000 | 74 | 1,468 sq ft | 100.0% | $99 |
| | Feb 14 2014 | $125,000 | 135 | 1,491 sq ft | 104.3% | $84 |
| | Oct 29 2013 | $49,900 | 6 | 1,009 sq ft | 100.0% | $49 |
| | Aug 9 2013 | $112,000 | 388 | 1,924 sq ft | 93.4% | $58 |
| | May 30 2013 | $65,000 | 127 | 1,276 sq ft | 93.0% | $51 |
| | Jan 31 2013 | $100,000 | 189 | 1,850 sq ft | 100.0% | $54 |
| | Dec 10 2012 | $140,000 | 206 | 2,365 sq ft | 93.4% | $59 |
Closed sales from MLS history for Casa Loma, Greenville
Below trend-line threshold — city median shown for context
The Casa Loma real estate market shows balanced market conditions. Homes typically sell within 55 days. With 3 active listings and 5 homes sold in the past year, a healthy balance exists between buyers and sellers.
Listings taken off the market in the past year in Casa Loma, Greenville
These homes are no longer available, but they show recent pricing and listing activity in Casa Loma. Our agents can help you watch for new listings in this area.
Contact an agentFree account needed — create one to continue viewing homes.
Members see everything — free👋 Still browsing Casa Loma?
Full photos, price history, and every active & pending home in Casa Loma with a free account.
Palmetto Park Realty Team
 $320K
$320K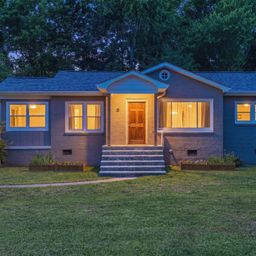 $285K
$285K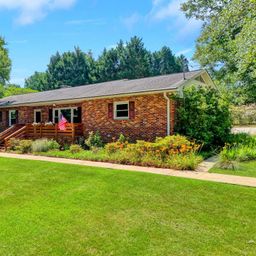 $375K
$375KCheck your messages
We sent a code to .
Verify your number and we'll text you price drops and new Casa Loma listings. 1–2 texts a month, stop anytime.
Enjoy full access to this home and every home on Palmetto Park.