Active
$160,000 $138/sqft
849 Nottingham Drive
Gastonia, NC 28054
2 bd · 2 ba · 1,160 sqft · 1976 · 1 mo ago
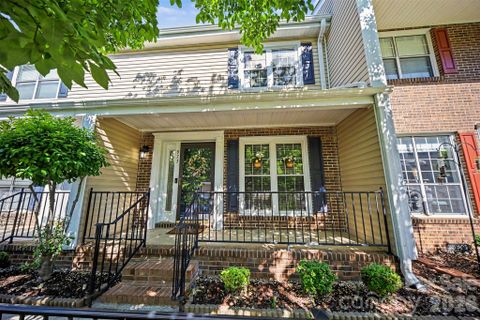
Sherwood in Gastonia has the feel of an established condo community with a practical, lived-in rhythm.
Community overview based on MLS listing data for Sherwood, Gastonia
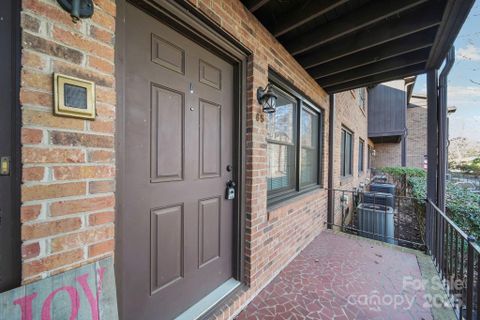
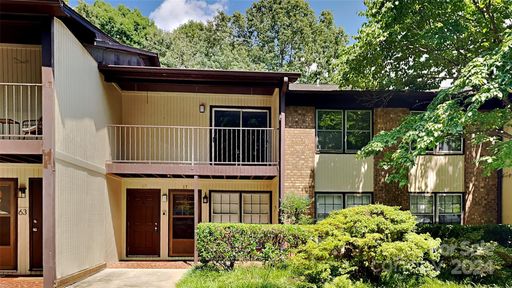
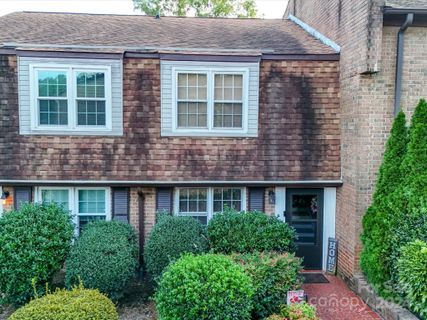
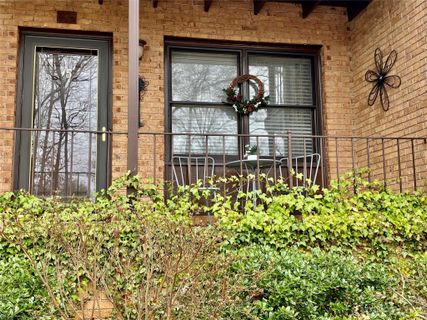
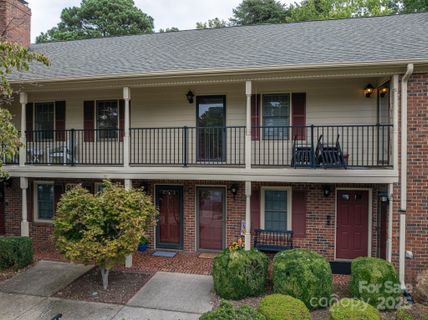
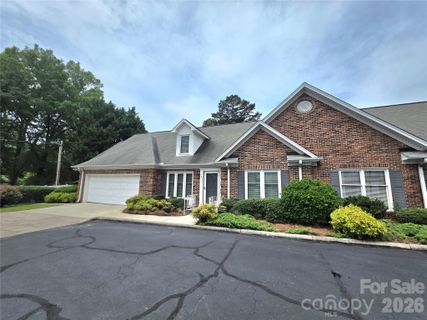
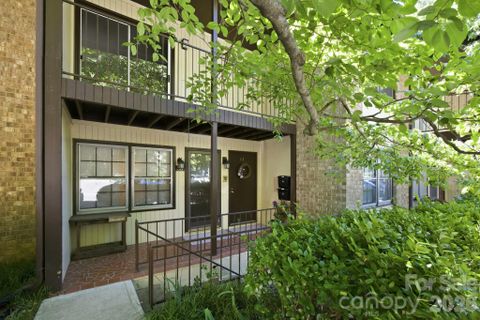
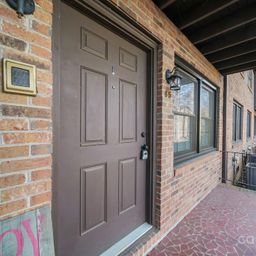
Sherwood in Gastonia has the feel of an established condo community with a practical, lived-in rhythm. The setting is centered on Nottingham Drive near Garrison Boulevard, where low-maintenance homes, mature trees, and covered parking details give the neighborhood a familiar, easygoing character. Many of the homes here are updated inside, but the overall appeal comes from the same core idea: comfortable space, straightforward layouts, and a location that keeps errands close at hand.
"Sherwood blends everyday convenience with a classic condo setting and a central Gastonia address."
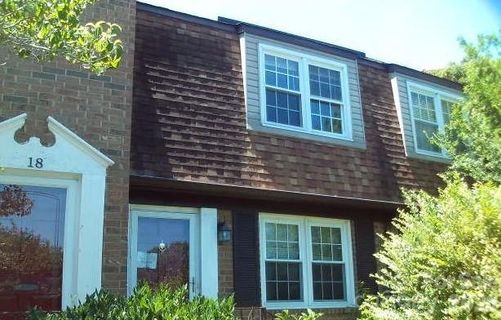
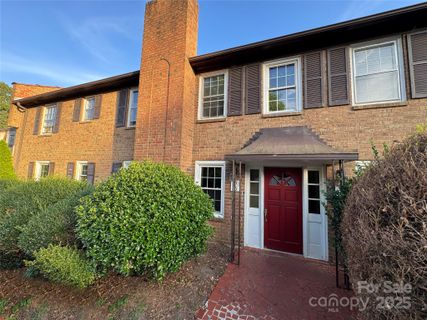
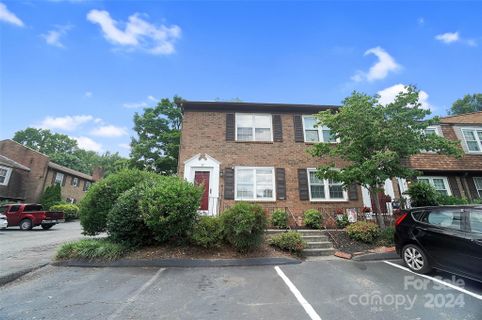
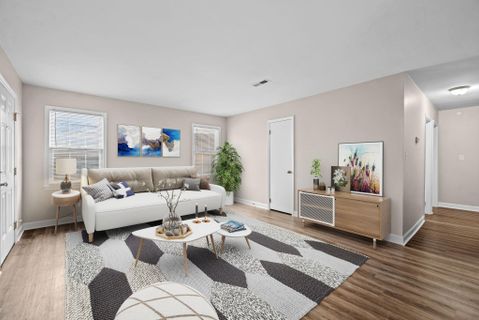
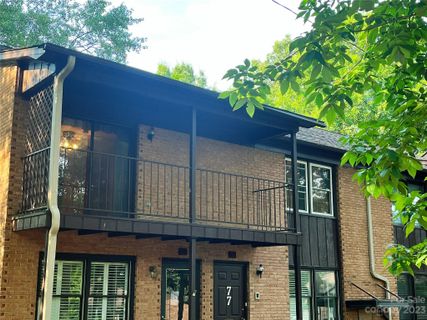
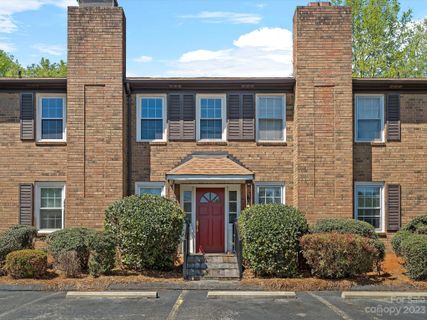
The neighborhood is made up primarily of residential condominiums, with most homes dating from the 1970s through 1980. Floor plans tend to be efficient and open, usually offering two or three bedrooms, one to two baths, and features that make the homes feel larger than the footprint suggests. You’ll often find bright kitchens, dining areas that flow into the main living space, balconies or patios, and in several cases, fireplaces or private outdoor access from the primary suite.
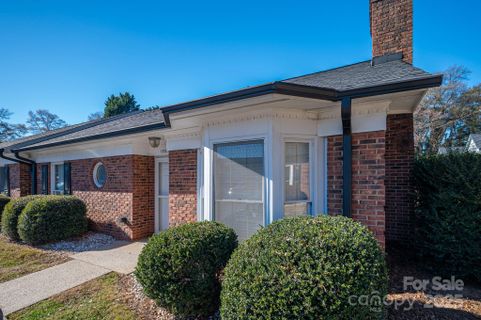
Brick shows up often enough to be part of the visual identity, and some homes are described as full-brick or renovated with brick exteriors. Recent updates commonly include fresh paint, new flooring, modern lighting, and upgraded kitchens or baths, which keeps the community feeling current without losing its established look.
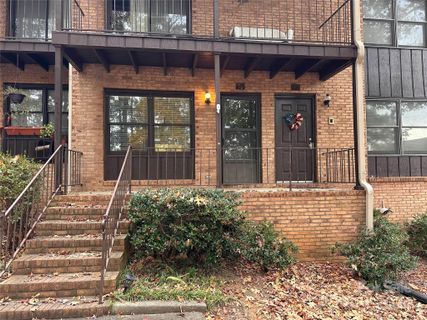
Sherwood’s daily appeal is rooted in convenience. Assigned parking, carports, and ground-level or second-level access patterns make coming and going simple, while interior laundry and included appliances appear in many homes. The surrounding setting is close to creeks, greenways, parks, and tree-lined common areas, so the neighborhood feels connected to the outdoors even without resort-style amenities.
"It is the kind of place where low-maintenance living and a central location do most of the heavy lifting."
Residents also benefit from the practical side of condo living: exterior upkeep is limited, and several listings highlight water, sewer, or other utilities included through the association. That combination of manageable upkeep and central placement gives Sherwood a steady, uncomplicated daily rhythm.
Sherwood sits in central Gastonia off Garrison Boulevard, with quick access to downtown Gastonia’s shopping and dining and a short drive to the revitalized downtown area and the FUSE District. Listings also point to easy access to I-85, and one remarks notes a quick commute to Charlotte. Nearby destinations mentioned in the neighborhood remarks include Lineberger Park, Avon/Catawba Creeks Greenway, local shopping, restaurants, the library, the museum, and the hospital.
School assignments commonly referenced for the community are Sherwood Elementary, Grier Middle, and Ashbrook High, with Gaston County public schools serving the area. That mix of neighborhood schools, central roads, and nearby services makes Sherwood especially well placed for straightforward day-to-day living in Gastonia.
Palmetto Park Realty Team · Gastonia
Ask about Sherwood — we answer fast
Communities similar to Sherwood
36 recently sold in Sherwood, Gastonia
| Property | Sold | List Price | DOM | Size | List $/SF |
|---|---|---|---|---|---|
| | Jun 10 2026 | $99,900 | 314 | 1,138 sq ft | $88 |
| | Feb 10 2025 | $169,900 | 58 | 1,162 sq ft | $146 |
| | Jan 6 2025 | $124,900 | 90 | 1,032 sq ft | $121 |
| | Dec 23 2024 | $165,000 | 52 | 1,130 sq ft | $146 |
| | Oct 21 2024 | $134,500 | 121 | 1,052 sq ft | $128 |
| | Nov 13 2023 | $184,900 | 266 | 1,272 sq ft | $145 |
| | Sep 12 2023 | $180,000 | 203 | 1,127 sq ft | $160 |
| | Aug 10 2023 | $168,000 | 39 | 1,115 sq ft | $151 |
| | Jun 12 2023 | $170,000 | 58 | 1,123 sq ft | $151 |
| | Sep 30 2022 | $148,000 | 131 | 1,158 sq ft | $128 |
| | Jun 3 2022 | $149,900 | 41 | 1,081 sq ft | $139 |
| | Nov 30 2021 | $129,900 | 109 | 1,127 sq ft | $115 |
| | Nov 3 2021 | $99,900 | 15 | 1,180 sq ft | $85 |
| | Oct 6 2021 | $155,000 | 26 | 1,127 sq ft | $138 |
| | Aug 9 2021 | $115,000 | 30 | — | — |
| | May 27 2021 | $119,900 | 37 | 1,123 sq ft | $107 |
| | Mar 22 2021 | $115,000 | 108 | 1,136 sq ft | $101 |
| | Feb 25 2021 | $109,900 | 34 | 1,200 sq ft | $92 |
| | Jul 23 2020 | $122,900 | 22 | 1,125 sq ft | $109 |
| | Jun 3 2020 | $89,900 | 103 | 1,142 sq ft | $79 |
| | May 2 2019 | $74,000 | 52 | 1,132 sq ft | $65 |
| | Sep 21 2018 | $72,000 | 114 | 1,068 sq ft | $67 |
| | Feb 9 2018 | $72,900 | 82 | 1,134 sq ft | $64 |
| | Oct 31 2017 | $69,900 | 68 | 1,070 sq ft | $65 |
| | Aug 16 2017 | $219,900 | 63 | 1,894 sq ft | $116 |
| | May 15 2017 | $62,000 | 27 | 1,292 sq ft | $48 |
| | May 1 2017 | $154,900 | 63 | 1,430 sq ft | $108 |
| | May 27 2016 | $59,900 | 69 | 1,048 sq ft | $57 |
| | Nov 17 2015 | $53,900 | 371 | 1,100 sq ft | $49 |
| | Jan 12 2015 | $59,900 | 195 | 1,152 sq ft | $52 |
| | May 30 2014 | $29,300 | 50 | 1,072 sq ft | $27 |
| | Mar 21 2014 | $104,900 | 27 | 1,747 sq ft | $60 |
| | Aug 2 2013 | $189,900 | 319 | 2,508 sq ft | $76 |
| | Feb 11 2013 | $187,500 | 84 | 2,419 sq ft | $78 |
| | Jul 30 2012 | $400,000 | 259 | 5,089 sq ft | $79 |
| | Jun 1 2012 | $439,000 | 112 | 6,635 sq ft | $66 |
Aggregated from MLS listing history for Sherwood, Gastonia
The Sherwood real estate market shows buyer's market conditions. Homes typically sell within 69 days. With 3 active listings and 1 home sold in the past year, buyers have more negotiating power and time to decide.
Listings taken off the market in the past year in Sherwood, Gastonia
Gastonia, NC 28054
2 bd · 2 ba · 1,120 sqft
Gastonia, NC 28054
2 bd · 1 ba · 1,158 sqft
These homes are no longer available, but they show recent pricing and listing activity in Sherwood. Our agents can help you watch for new listings in this area.
Contact an agentFree account needed — create one to continue viewing homes.
Members see everything — free👋 Still browsing Sherwood?
Full photos, price history, and every active & pending home in Sherwood with a free account.
Palmetto Park Realty Team
 $165K
$165K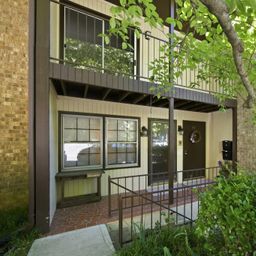 $160K
$160K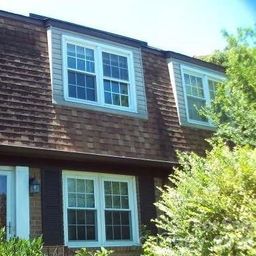 $125K
$125KCheck your messages
We sent a code to .
Verify your number and we'll text you price drops and new Sherwood listings. 1–2 texts a month, stop anytime.
Enjoy full access to this home and every home on Palmetto Park.