Active
New
$438,490 $232/sqft
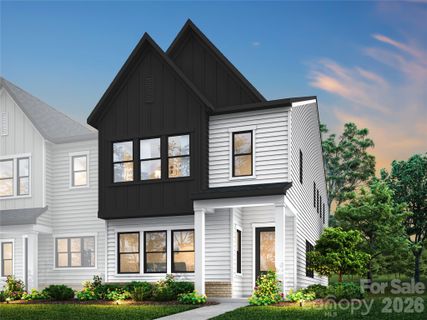
416 Nash Street
Fort Mill, SC 29715
3 bd · 2 ba · 1,887 sqft · 2027 · 2 d ago
Garage
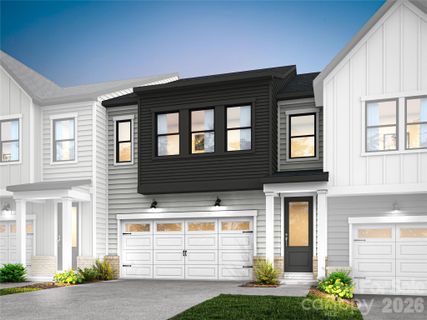
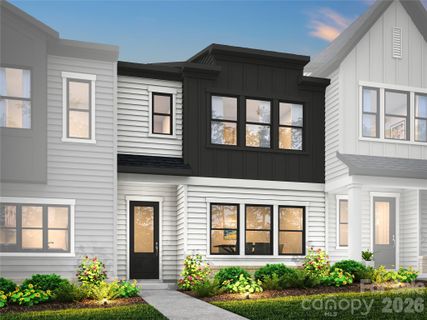
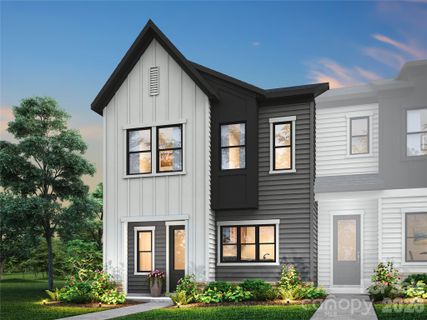
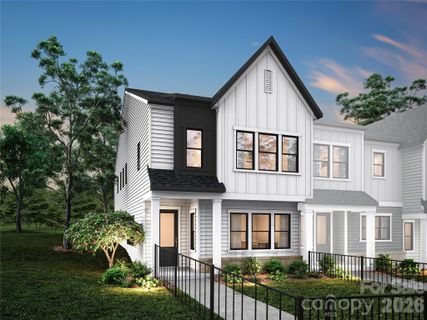
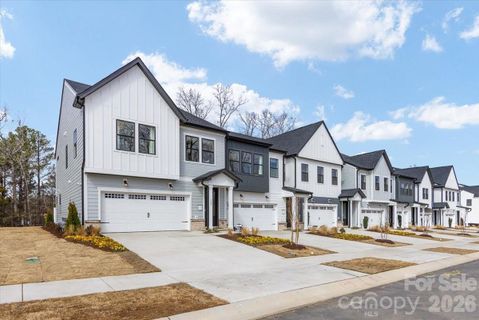
Southbridge in Fort Mill reads as a fresh, carefully planned townhome community with a polished, low-maintenance feel.
Community overview based on MLS listing data for Southbridge, Fort Mill
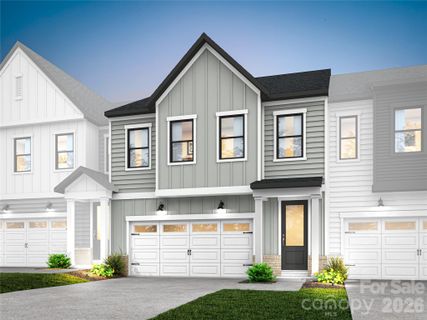
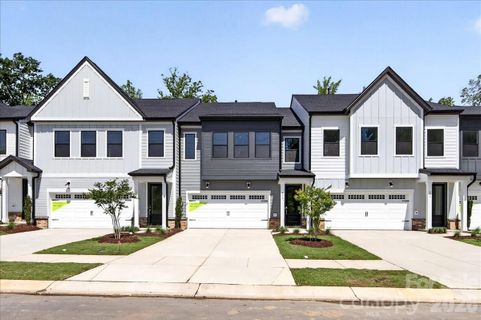
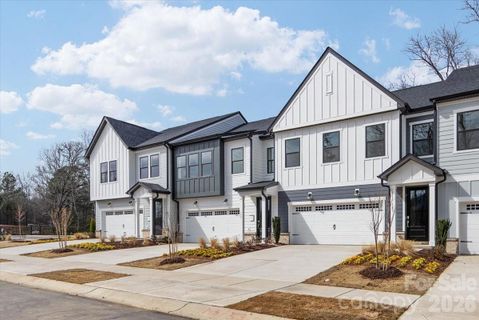
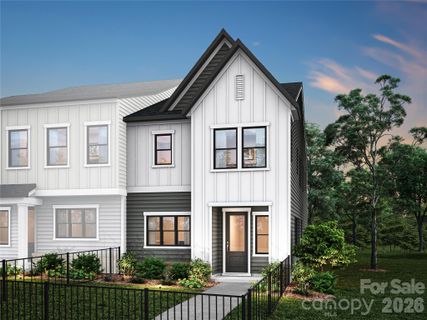
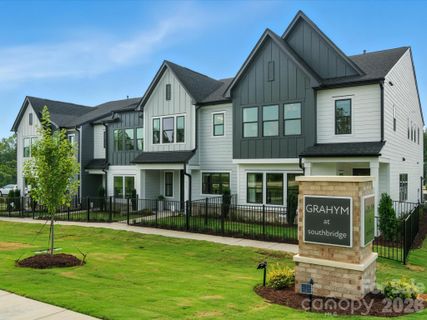
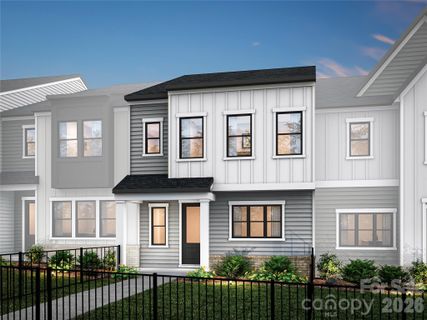
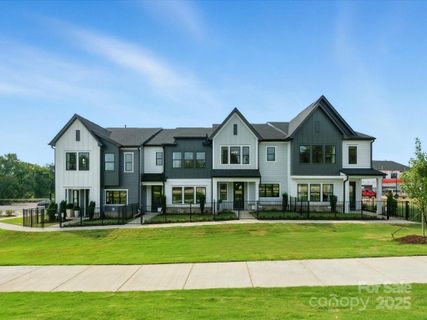
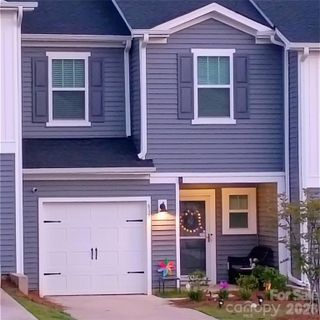
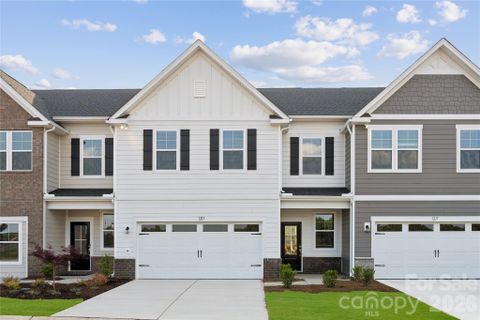
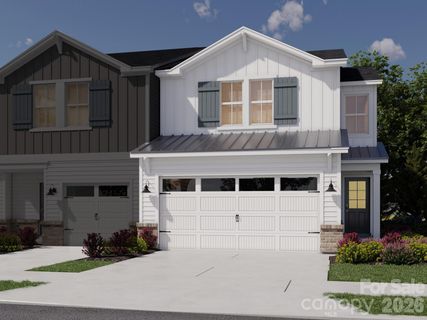
Southbridge in Fort Mill reads as a fresh, carefully planned townhome community with a polished, low-maintenance feel. The streetscape is shaped by end-unit layouts, rear-load or front-load two-bay garages, and fenced front yards that help soften the architecture with a more residential look. Newer construction gives the neighborhood a crisp edge, while wooded views and tree-lined backdrops add a welcome natural note. It feels modern without losing the sense of neighborhood character that many buyers look for in Fort Mill.
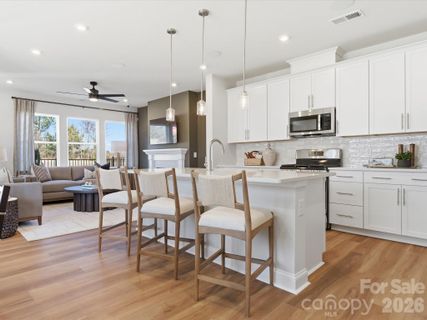
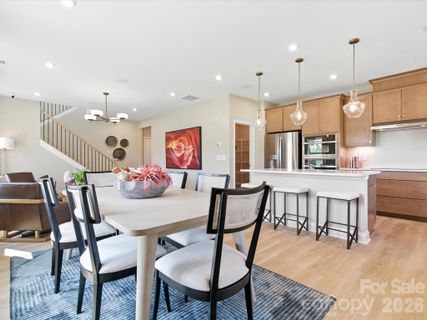
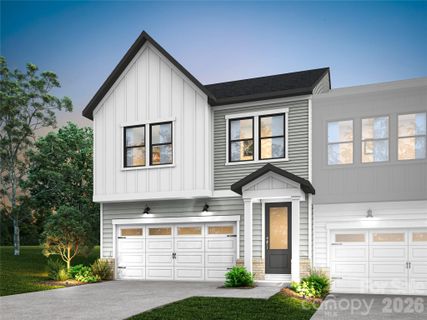
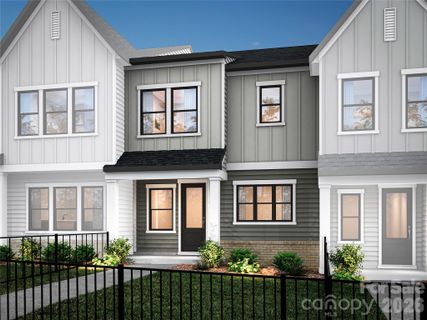
The homes here are overwhelmingly townhouse-style residences, built in 2025 and 2026, with most offering three bedrooms and two baths, plus a few plans that add a fourth bedroom or a flexible loft. The floorplans lean into open-concept living, with large kitchen islands, quartz countertops, gas ranges, walk-in pantries, and drop zones near the garage entry. Oak box stairs, tray ceilings, tiled showers, and open rails show up often enough to define the interior style: clean, current, and thoughtfully upgraded. Many homes also include covered porches or patios, and several back to mature trees, which gives the community a more settled feel than you might expect from such new construction.
Southbridge is designed around everyday convenience. Walking trails and a playground are part of the community rhythm, offering easy outdoor space close to home. The HOA-maintained fenced front yards keep upkeep simple and the streets looking tidy. With every home featuring a garage, daily life is built around practical arrivals and departures, while the outdoor living areas extend the usable space beyond the main floor. The overall impression is of a neighborhood that balances customization with ease, especially for buyers who want a new home without sacrificing character or connection to outdoor space.
Southbridge sits in Fort Mill just off I-77, with remarks repeatedly noting quick access to the interstate and a short drive to downtown Fort Mill. Listings also point to convenient connectivity to Charlotte and CLT Airport, making the location feel well placed for regional travel. Downtown Fort Mill’s dining and shopping are close at hand, and the community is also described as being near local shops and restaurants. School zoning is a clear part of the appeal, with Springfield Elementary, Springfield Middle, and Nation Ford High School named most often. The setting pairs a central Fort Mill location with a practical commute pattern and well-established school assignments, which helps Southbridge feel both connected and easy to live in.
Palmetto Park Realty Team · Fort Mill
Ask about Southbridge — we answer fast
See what it's worth — your home's own sale history plus recent Southbridge sales, free.
What's my home worth?Communities similar to Southbridge
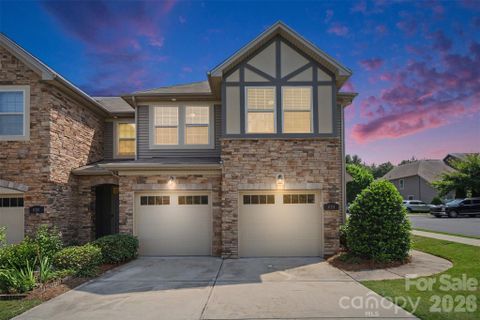 0.7 mi
 Ayrshire Townhomes, Fort Mill
3 active · $385,000
 1.9 mi
 Beacon Knoll Villas, Fort Mill
4 active · $429,950
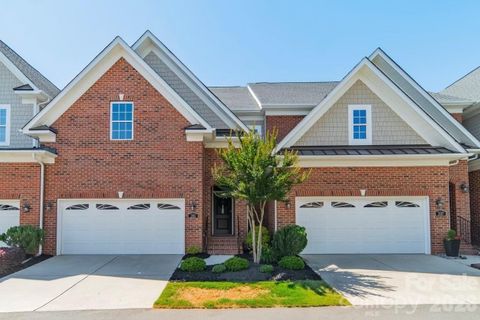
 1.4 mi
 Fairway Townes, Fort Mill
3 active · $350,000
 2.3 mi
 Ashe Downs Townhomes, Fort Mill
4 active · $344,500
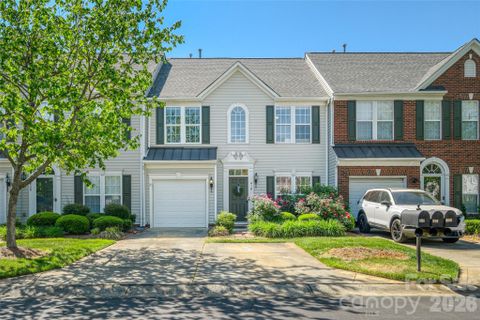
 0.8 mi
 Tillery At Wilson Farms, Fort Mill
8 active · $438,500
 0.8 mi
 Meadows At Wilson Farms, Fort Mill
21 active · $387,190
16 recently sold in Southbridge, Fort Mill
| Property | Sold | Sold Price | Days on Market | Size | Sold to Ask | Sold $/SF |
|---|---|---|---|---|---|---|
| | Jul 8 2026 | $437,879 | 123 | 2,076 sq ft | 100.0% | $211 |
| | Jun 17 2026 | $489,010 | 68 | 2,159 sq ft | 99.6% | $226 |
| | Jun 5 2026 | $455,000 | 86 | 1,887 sq ft | 97.8% | $241 |
| | May 29 2026 | $449,990 | 83 | 2,178 sq ft | 100.0% | $207 |
| | May 14 2026 | $468,000 | 1 | 2,178 sq ft | 100.0% | $215 |
| | Apr 21 2026 | $412,886 | 242 | 1,813 sq ft | 103.6% | $228 |
| | Apr 10 2026 | $429,000 | 231 | 1,767 sq ft | 101.5% | $243 |
| | Apr 3 2026 | $508,776 | 0 | 2,178 sq ft | 100.0% | $234 |
| | Feb 26 2026 | $409,990 | 146 | 1,767 sq ft | 100.0% | $232 |
| | Dec 1 2025 | $422,418 | 68 | 1,813 sq ft | 100.0% | $233 |
| | Nov 26 2025 | $402,911 | 96 | 1,862 sq ft | 96.4% | $216 |
| | Nov 21 2025 | $412,232 | 132 | 1,814 sq ft | 97.1% | $227 |
| | Nov 18 2025 | $444,722 | 129 | 1,767 sq ft | 111.2% | $252 |
| | Nov 18 2025 | $444,722 | 129 | 1,862 sq ft | 101.0% | $239 |
| | Nov 12 2025 | $416,731 | 49 | 1,813 sq ft | 100.0% | $230 |
| | Oct 27 2025 | $433,043 | 107 | 1,888 sq ft | 96.7% | $229 |
Closed sales from MLS history for Southbridge, Fort Mill
Southbridge median sale price is $433,043; Fort Mill is down 3.5%.
The Southbridge real estate market shows buyer's market conditions. Homes typically sell within 101 days. With 26 active listings and 16 homes sold in the past year, buyers have more negotiating power and time to decide.
Listings taken off the market in the past year in Southbridge, Fort Mill
Fort Mill, SC 29715
3 bd · 2 ba · 1,767 sqft
Fort Mill, SC 29715
3 bd · 2 ba · 1,888 sqft
Fort Mill, SC 29715
3 bd · 2 ba · 1,862 sqft
Fort Mill, SC 29715
3 bd · 2 ba · 1,814 sqft
Fort Mill, SC 29715
3 bd · 2 ba · 2,076 sqft
Fort Mill, SC 29715
4 bd · 2 ba · 2,159 sqft
Fort Mill, SC 29715
3 bd · 2 ba · 2,076 sqft
Fort Mill, SC 29715
3 bd · 2 ba · 2,159 sqft
These homes are no longer available, but they show recent pricing and listing activity in Southbridge. Our agents can help you watch for new listings in this area.
Contact an agentFree account needed — create one to continue viewing homes.
Members see everything — free👋 Still browsing Southbridge?
Full photos, price history, and every active & pending home in Southbridge with a free account.
Palmetto Park Realty Team
 $490K
$490K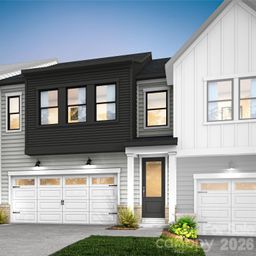 $478K
$478K $478K
$478K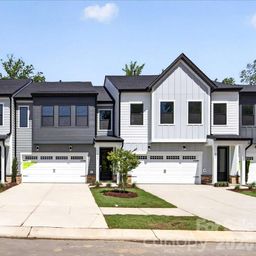 $470K
$470K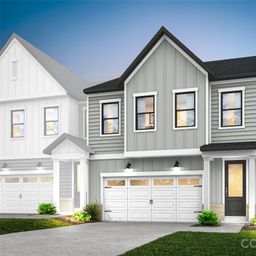 $468K
$468K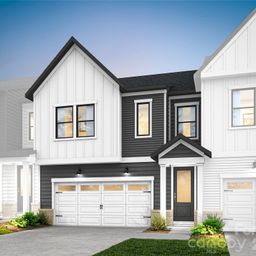 $449K
$449KCheck your messages
We sent a code to .
Verify your number and we'll text you price drops and new Southbridge listings. 1–2 texts a month, stop anytime.
Enjoy full access to this home and every home on Palmetto Park.