Pending
$475,000 $215/sqft
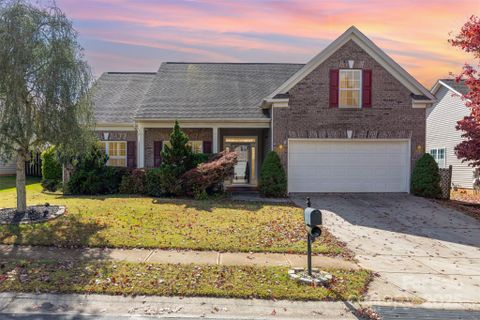
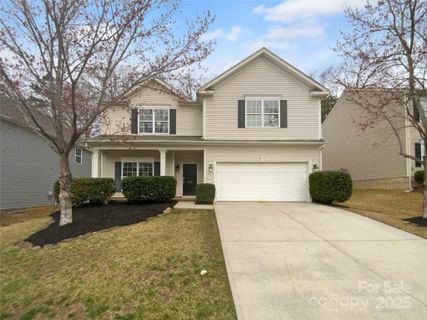
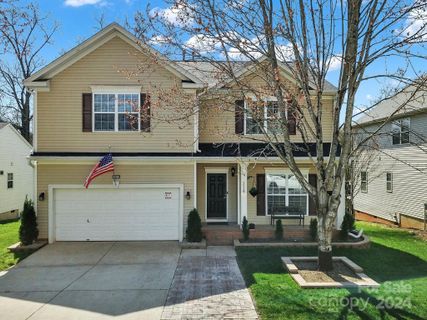
10234 Tintinhull Drive
Fort Mill, SC 29707
4 bd · 2 ba · 2,208 sqft · 2005 · 2 mo ago
Pool Fireplace Garage
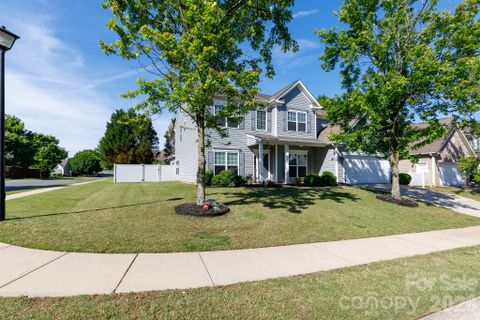
Clairemont in Fort Mill has the feel of a well-kept suburban pocket with a clear identity: established homes, thoughtful layouts, and a setting that keeps daily life practical.
Listing summary: 1 Pending41 Recently Sold
$475,000 $215/sqft
Fort Mill, SC 29707
4 bd · 2 ba · 2,208 sqft · 2005 · 2 mo ago
$515,000 $174/sqft
Fort Mill, SC 29707
4 bd · 2 ba · 2,965 sqft · 2005 · DOM: 26 d
$450,000 $206/sqft
Fort Mill, SC 29707
4 bd · 2 ba · 2,180 sqft · 2005 · DOM: 167 d
$419,999 $221/sqft
Fort Mill, SC 29707
4 bd · 2 ba · 1,900 sqft · 2004 · DOM: 85 d
$450,000 $209/sqft
Fort Mill, SC 29707
4 bd · 2 ba · 2,152 sqft · 2004 · DOM: 41 d
$280,000 $152/sqft
Fort Mill, SC 29707
3 bd · 2 ba · 1,840 sqft · 2004 · DOM: 16 d
$466,000 $167/sqft
Fort Mill, SC 29707
4 bd · 2 ba · 2,793 sqft · 2006 · DOM: 85 d
$425,000 $186/sqft
Fort Mill, SC 29707
3 bd · 2 ba · 2,284 sqft · 2005 · DOM: 99 d
$449,000 $220/sqft
Fort Mill, SC 29707
4 bd · 2 ba · 2,039 sqft · 2005 · DOM: 41 d
Upstate South Carolina / Charlotte metro edge
Walkability: Medium
$459,900 $205/sqft
Fort Mill, SC 29707
4 bd · 2 ba · 2,243 sqft · 2005 · DOM: 41 d
$489,900 $174/sqft
Fort Mill, SC 29707
5 bd · 2 ba · 2,821 sqft · 2006 · DOM: 70 d
$385,000 $219/sqft
Fort Mill, SC 29707
4 bd · 2 ba · 1,760 sqft · 2005 · DOM: 27 d
Community overview based on MLS listing data for Clairemont, Fort Mill
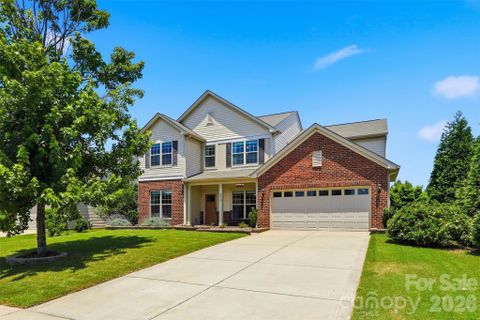
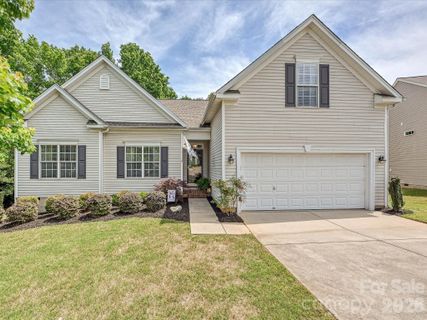
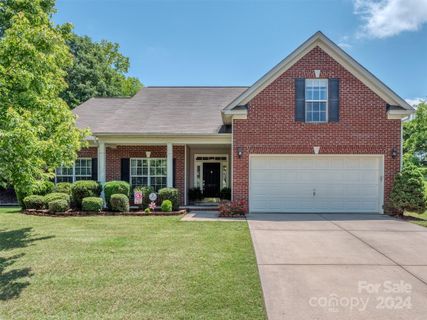
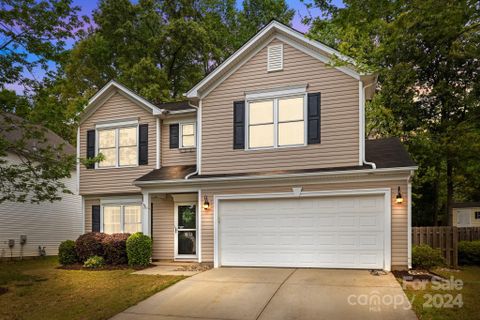
Clairemont in Fort Mill has the feel of a well-kept suburban pocket with a clear identity: established homes, thoughtful layouts, and a setting that keeps daily life practical. Built mostly in the mid-2000s, the neighborhood leans into comfortable single-family living with front porches, open interiors, and yards that are easy to enjoy without feeling oversized. Sidewalk-lined streets and mature landscaping give the community a polished look, while the low-rise streetscape keeps the mood residential and grounded.
"Clairemont blends everyday convenience with a polished, lived-in neighborhood setting."
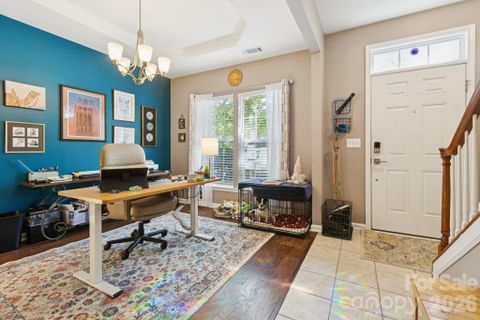
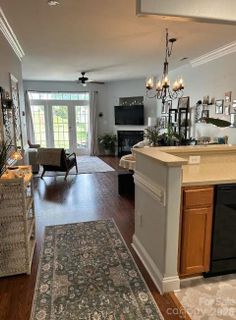
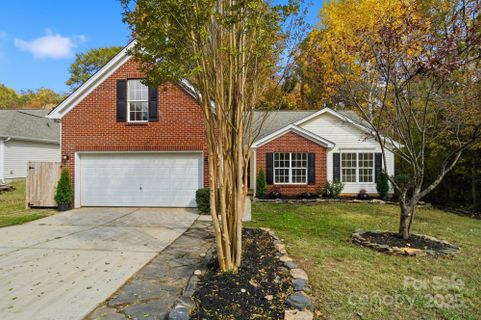
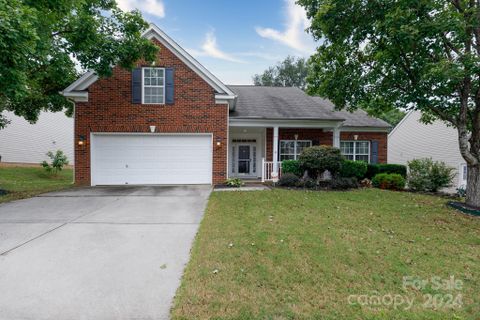
Most homes here are two-story or 1.5-story designs, often with bonus rooms, sunrooms, and main-level primary suites. That mix creates flexibility without losing a cohesive neighborhood character. Interiors commonly feature open floor plans, vaulted or high ceilings, granite or quartz counters, hardwood flooring, gas fireplaces, and attached garages. Many homes also include patios, screened porches, or private backyards, which adds to the easy indoor-outdoor rhythm that defines the area. The lot sizes are manageable, and the overall presentation feels neat and well cared for rather than sprawling.
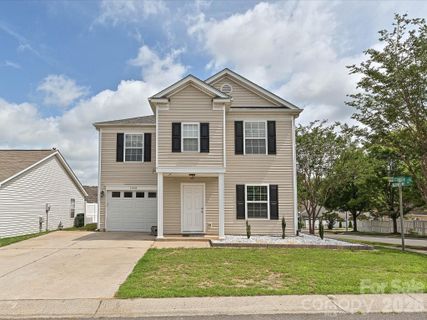
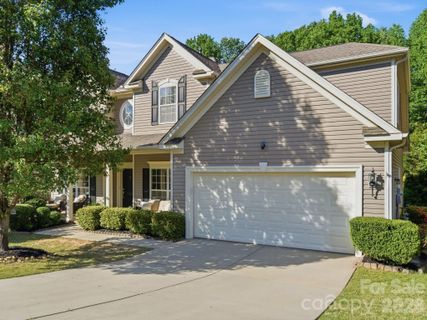
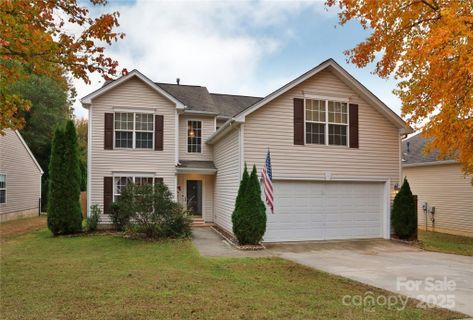
Clairemont’s appeal is also in its consistency. The homes were built within a tight window, so the streets feel unified in age and style. You’ll see a blend of updated finishes and practical floor plans that fit a range of living needs, from first-floor primary suites to flexible upstairs bonus spaces.
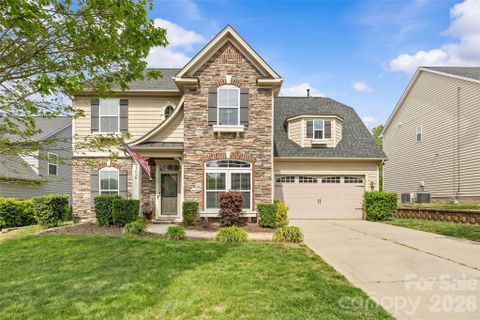
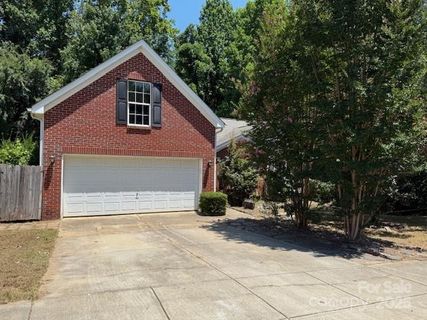
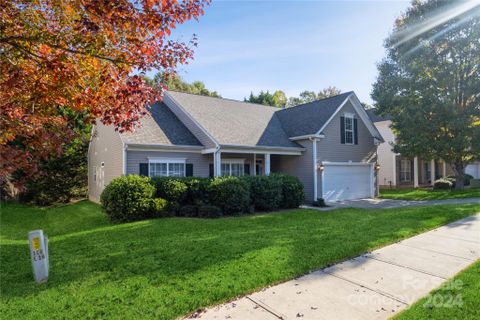
The community pool and playground are central features, and sidewalks make it easy to move around the neighborhood on foot. That gives Clairemont a pleasant, connected rhythm without relying on a large amenity package. The outdoor spaces matter here: patios, decks, screened porches, fenced yards, and wooded backdrops show up often, giving many homes a private feel at the edge of the neighborhood.
"It’s the kind of place where the house, the yard, and the neighborhood amenities all work together."
Daily life is also shaped by convenience beyond the subdivision. Nearby retail and dining in Ballantyne, RedStone, and the broader Fort Mill/Indian Land area keep errands straightforward, while larger shopping destinations are close enough for a quick drive. The setting balances neighborhood comfort with access to a much larger South Charlotte corridor.
Clairemont sits in the Fort Mill / Indian Land area near the Ballantyne corridor, with direct access to the shopping and dining network that stretches toward south Charlotte. Public remarks place it just minutes from Ballantyne, less than 2 miles from RedStone shopping area, about 5 miles from The Amp Ballantyne and Blakeney Shopping Center, 7 miles from Stonecrest Shopping Center, 8 miles from Waverly Shopping Center, 13 miles from Southpark Shopping Center, 17 miles from uptown Charlotte, and 20 miles from CLT Airport. The community is also close to the new Costco and Target, plus the broader North and South Carolina shopping areas.
School references commonly point to Harrisburg Elementary, Indian Land Middle, and Indian Land High, with the area described as lower in South Carolina taxes. That combination of location, access, and school zoning helps explain why Clairemont remains a steady name in this part of Fort Mill.
Talk to a local agent about homes in Clairemont, Fort Mill
Communities similar to Clairemont
41 recently sold in Clairemont, Fort Mill
| Property | Sold | List Price | DOM | Size | List $/SF |
|---|---|---|---|---|---|
| | May 12 2026 | $515,000 | 26 | 2,965 sq ft | $174 |
| | Apr 16 2026 | $450,000 | 167 | 2,180 sq ft | $206 |
| | Feb 6 2026 | $419,999 | 85 | 1,900 sq ft | $221 |
| | Dec 18 2025 | $450,000 | 41 | 2,152 sq ft | $209 |
| | Aug 8 2025 | $280,000 | 16 | 1,840 sq ft | $152 |
| | Jun 10 2025 | $466,000 | 85 | 2,793 sq ft | $167 |
| | Dec 20 2024 | $425,000 | 99 | 2,284 sq ft | $186 |
| | Dec 5 2024 | $449,000 | 41 | 2,039 sq ft | $220 |
| | Jul 12 2024 | $459,900 | 41 | 2,243 sq ft | $205 |
| | Jun 7 2024 | $489,900 | 70 | 2,821 sq ft | $174 |
| | May 16 2024 | $385,000 | 27 | 1,760 sq ft | $219 |
| | Sep 15 2023 | $480,000 | 35 | 2,939 sq ft | $163 |
| | Nov 1 2021 | $1,650 | 2246 | 3,237 sq ft | $1 |
| | Sep 27 2021 | $364,900 | 30 | 2,187 sq ft | $167 |
| | Aug 18 2020 | $312,000 | 64 | 2,010 sq ft | $155 |
| | May 29 2020 | $250,000 | 28 | 1,727 sq ft | $145 |
| | Jun 28 2019 | $297,000 | 114 | 2,233 sq ft | $133 |
| | Oct 31 2017 | $209,900 | 56 | 1,627 sq ft | $129 |
| | Oct 11 2017 | $194,000 | 35 | 1,302 sq ft | $149 |
| | Sep 29 2017 | $249,900 | 149 | 2,795 sq ft | $89 |
| | Aug 11 2017 | $1,750 | 3 | 3,237 sq ft | $1 |
| | Apr 20 2017 | $314,900 | 48 | 2,987 sq ft | $105 |
| | Feb 15 2017 | $276,000 | 106 | 2,637 sq ft | $105 |
| | Oct 13 2016 | $319,500 | 116 | 3,484 sq ft | $92 |
| | Aug 25 2016 | $264,900 | 46 | 2,335 sq ft | $113 |
| | Apr 5 2016 | $218,900 | 64 | 2,187 sq ft | $100 |
| | Apr 5 2016 | $218,900 | 64 | 2,186 sq ft | $100 |
| | Feb 26 2016 | $225,000 | 75 | 2,027 sq ft | $111 |
| | Dec 18 2015 | $172,900 | 31 | 1,601 sq ft | $108 |
| | Jun 30 2015 | $219,900 | 46 | 2,019 sq ft | $109 |
| | Apr 6 2015 | $227,900 | 96 | 1,950 sq ft | $117 |
| | Apr 6 2015 | $227,900 | 96 | 1,950 sq ft | $117 |
| | Nov 7 2014 | $174,000 | 99 | 1,295 sq ft | $134 |
| | Jul 31 2014 | $175,000 | 122 | 1,739 sq ft | $101 |
| | Jul 22 2014 | $225,000 | 78 | 2,210 sq ft | $102 |
| | Jul 1 2014 | $1,650 | 9 | 3,237 sq ft | $1 |
| | May 12 2014 | $199,900 | 60 | 2,002 sq ft | $100 |
| | Nov 26 2013 | $225,000 | 81 | 3,482 sq ft | $65 |
| | Jun 14 2013 | $239,900 | 100 | 2,738 sq ft | $88 |
| | Jan 18 2013 | $149,900 | 43 | 1,285 sq ft | $117 |
| | Apr 19 2012 | $159,900 | 43 | 2,175 sq ft | $74 |
Aggregated from MLS listing history for Clairemont, Fort Mill
The Clairemont real estate market shows buyer's market conditions. Homes typically sell within 62 days. With 2 active listings and 5 homes sold in the past year, buyers have more negotiating power and time to decide.
Listings taken off the market in the past year in Clairemont, Fort Mill
These homes are no longer available, but they show recent pricing and listing activity in Clairemont. Our agents can help you watch for new listings in this area.
Contact an agent