Sold
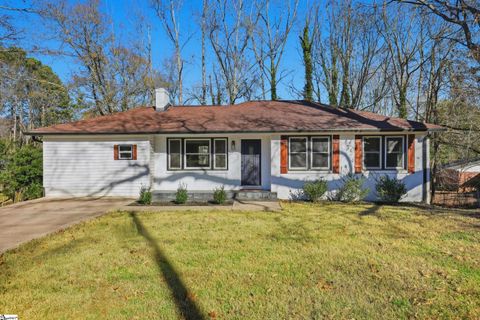
$545,000 $185/sqft
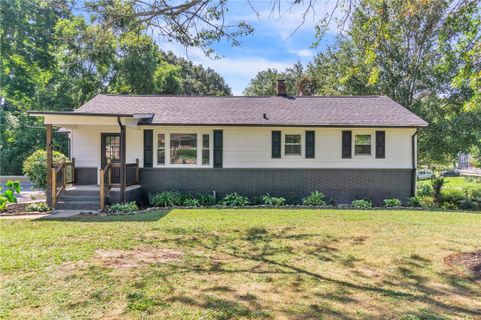
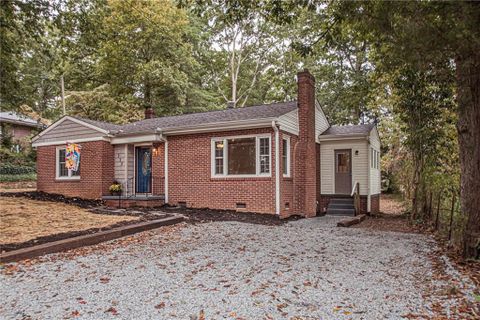
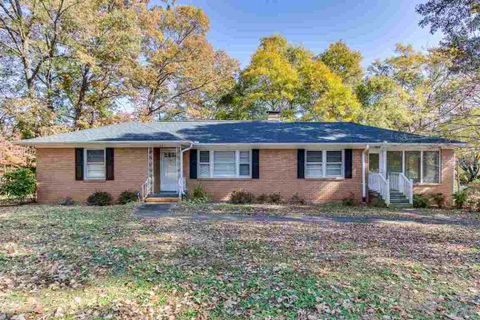
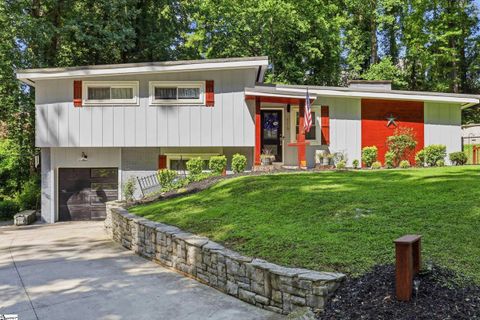
401 Southway Street
Easley, SC 29640
3 bd · 2 ba · 2,944 sqft · 1965 · DOM: 39 d
Fireplace Garage
Wyatt Ag has the feel of an established Easley address with a distinctly lived-in, residential character.
Community overview based on MLS listing data for Wyatt Ag, Easley
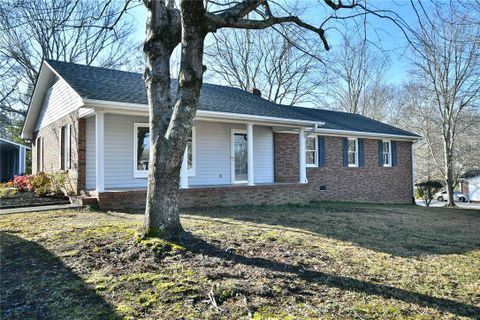
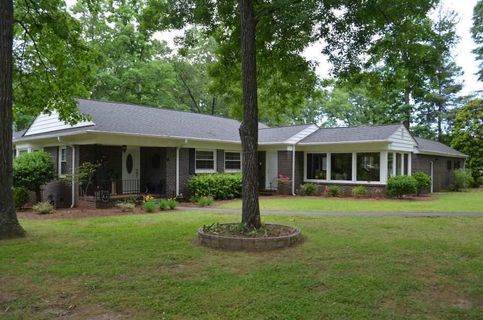
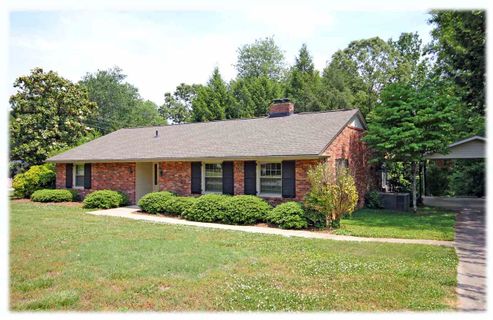
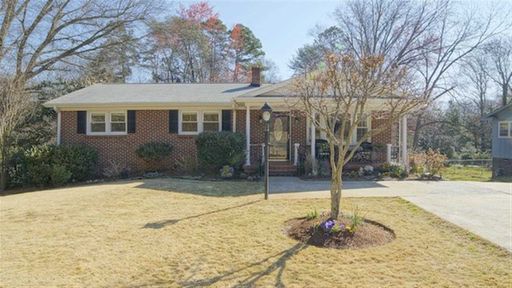
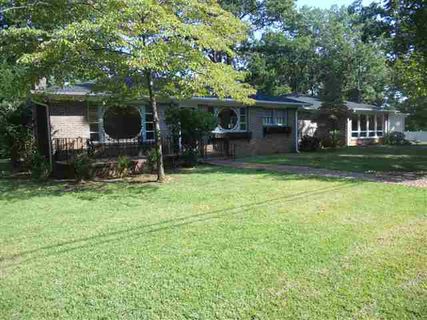
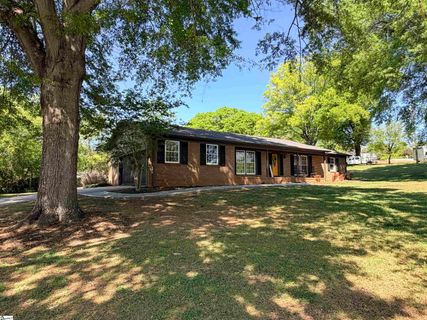
Wyatt Ag has the feel of an established Easley address with a distinctly lived-in, residential character. The streetscape is a mix of classic bungalows, renovated ranches, and newer custom homes, so the neighborhood never feels one-note. Mature trees, corner lots, and generous yard space give many properties an open, settled look, while the homes themselves often carry the kind of details buyers notice right away: hardwood floors, brick exteriors, porches, patios, and practical outbuildings.
"A well-rooted Easley neighborhood where character, updates, and everyday convenience meet."
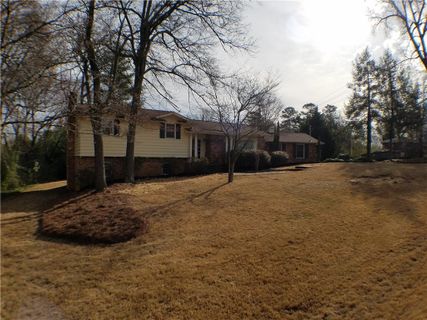
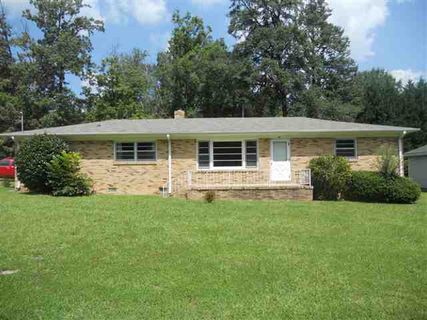
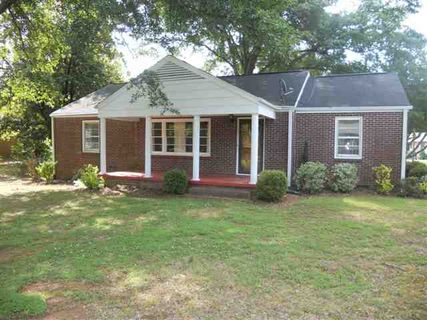
The housing here leans single-family, with a wide spread of eras and finishes. Older homes from the late 1940s through the 1960s sit alongside newer construction, and that blend gives Wyatt Ag a flexible personality. Many homes feature brick exteriors, and several have been thoughtfully updated with granite counters, modern kitchens, refreshed baths, and newer mechanical systems. Garage space is common, and basement options appear on select homes, adding extra storage or expansion potential.
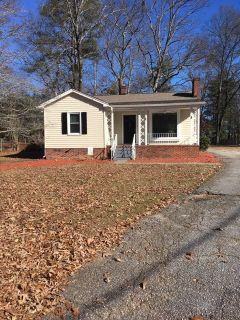
Lot sizes are a real part of the appeal. Some properties sit on compact city lots, while others stretch close to an acre, creating room for patios, gardens, detached garages, or extra parking. The overall effect is relaxed and practical rather than tightly packed, with enough variety to suit different home styles and renovation levels.
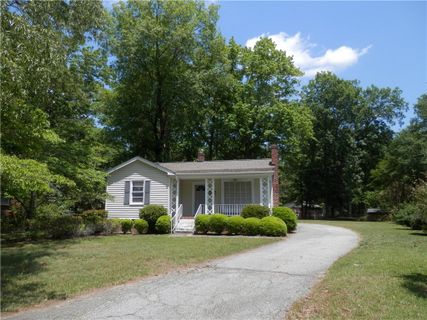
Daily life in Wyatt Ag tends to center on the home itself and the surrounding Easley conveniences. Listings point to fenced yards, sunrooms, screened porches, decks, patios, and mature landscaping, which makes outdoor living feel like a natural extension of the house. Several homes also highlight storage buildings, workshops, detached garages, and driveways sized for multiple vehicles. That combination gives the neighborhood a comfortable, hands-on rhythm: a place where projects, hobbies, and outdoor gatherings can fit easily into the day.
"Close to downtown, but with enough space and character to feel like your own corner of Easley."
Wyatt Ag sits in the Easley core, with strong ties to Downtown Easley, Highway 123, Main Street, and Calhoun Memorial Highway. Several listings note being just minutes from downtown, and one describes the area as about 25 minutes from Downtown Greenville. The Doodle Trail is another nearby draw, and The Silos and the Southern Weaving pavilion come up as part of the local downtown scene. Shopping, dining, coffee spots, and everyday services are close at hand, along with Easley’s hospital and other city conveniences.
School assignments are consistent across the community: East End Elementary, Gettys Middle School, and Easley High School. That, paired with the central Easley location and straightforward access to major corridors, keeps Wyatt Ag connected to the rest of Pickens County and the Greenville area without losing its neighborhood-scale feel.
Palmetto Park Realty Team · Easley
Ask about Wyatt Ag — we answer fast
See what it's worth — your home's own sale history plus recent Wyatt Ag sales, free.
What's my home worth?Communities similar to Wyatt Ag
 1.3 mi
 Northview, Easley
4 active · $350,099
 3.1 mi
 Forest Park Sub, Easley
2 active · $332,500
 1.2 mi
 The Reserve At Livingston Park, Easley
4 active · $387,490
A G Wyatt Estate, Easley
2 active · $347,450
 0.7 mi
 Rc Jack Oates, Easley
2 active · $237,500
 1.3 mi
 Forest Acres, Easley
3 active · $329,900
Closed sales from MLS history for Wyatt Ag, Easley
Wyatt Ag median sale price is $270,500; Easley is up 1.6%.
The Wyatt Ag real estate market shows balanced market conditions. Homes typically sell within 55 days. With 1 active listing and 5 homes sold in the past year, a healthy balance exists between buyers and sellers.
Listings taken off the market in the past year in Wyatt Ag, Easley
Easley, SC 29640
3 bd · 2 ba · 2,944 sqft
Easley, SC 29640
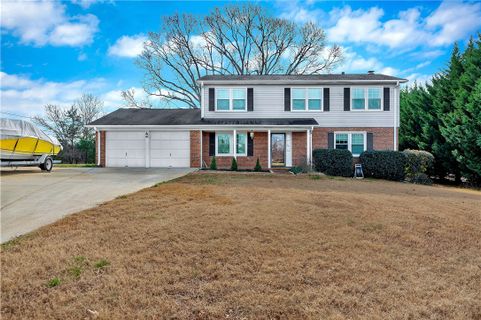
4 bd · 2 ba · 2,528 sqft
These homes are no longer available, but they show recent pricing and listing activity in Wyatt Ag. Our agents can help you watch for new listings in this area.
Contact an agentFree account needed — create one to continue viewing homes.
Members see everything — free👋 Still browsing Wyatt Ag?
Full photos, price history, and every active & pending home in Wyatt Ag with a free account.
Palmetto Park Realty Team
Check your messages
We sent a code to .
Verify your number and we'll text you price drops and new Wyatt Ag listings. 1–2 texts a month, stop anytime.
Enjoy full access to this home and every home on Palmetto Park.