Active
New
$2,095,000 $631/sqft
21300 Blakely Shores Drive
Cornelius, NC 28031
3 bd · 2 ba · 3,320 sqft · 1991 · 7 d ago
Fireplace Water Garage
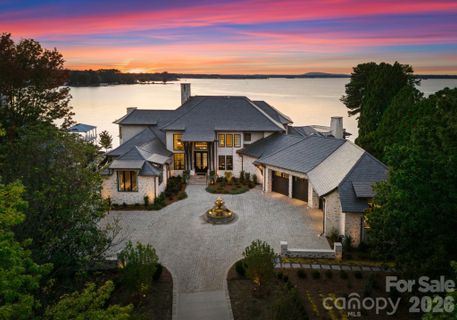
Waterford Point is one of Cornelius' established Lake Norman addresses where lake access shapes daily life without giving up quick reach to town.
Community overview based on MLS listing data for Waterford Point, Cornelius
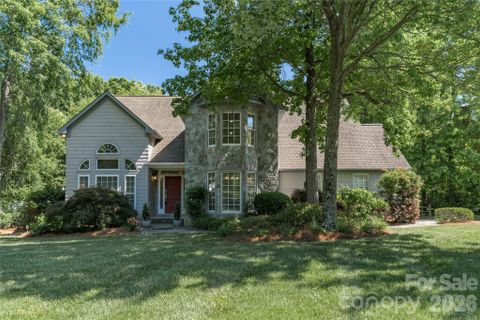
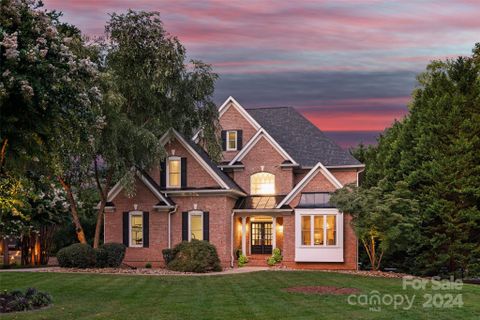
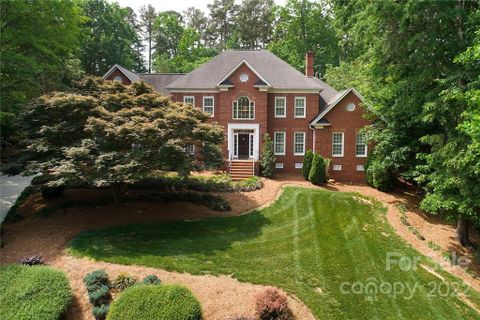
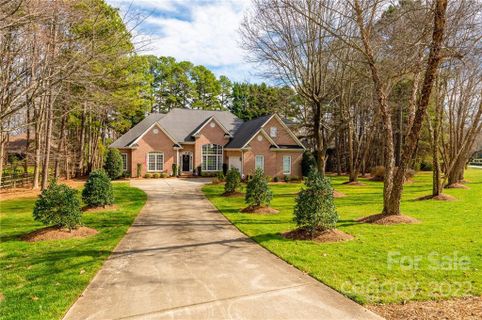
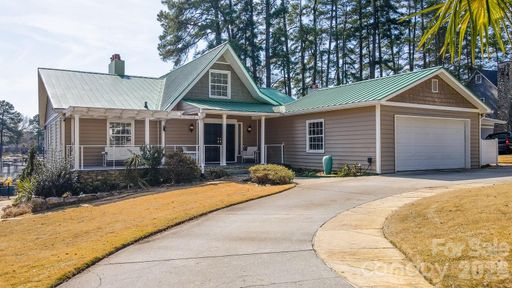
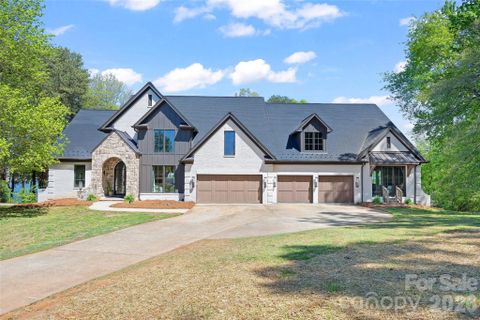
Waterford Point is one of Cornelius' established Lake Norman addresses where lake access shapes daily life without giving up quick reach to town. The neighborhood is built around detached homes on notably generous lots, averaging about 0.57 acre, and the strongest stretch of construction runs from the late 1980s into the early 1990s, giving the community a cohesive, mature look rather than a piecemeal feel.
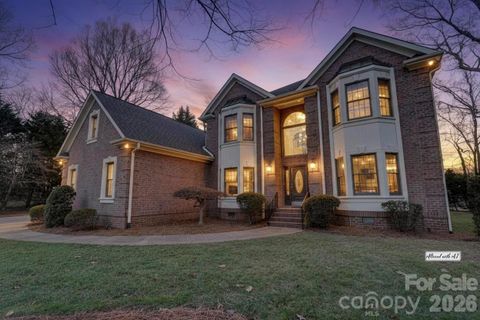
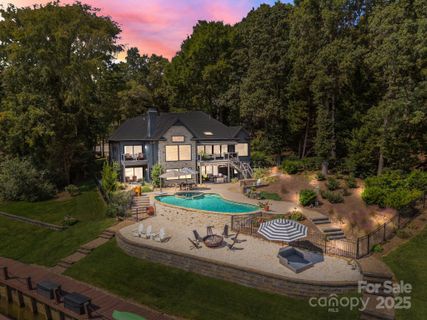
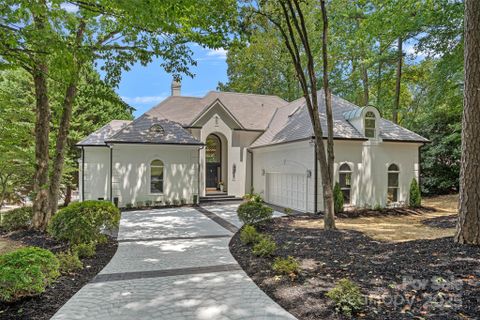
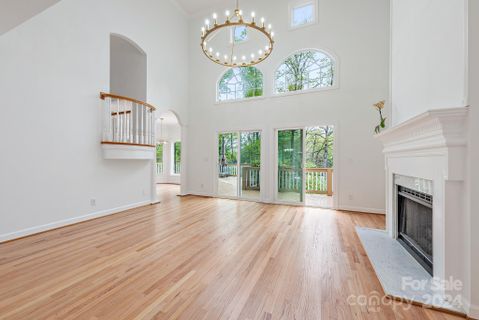
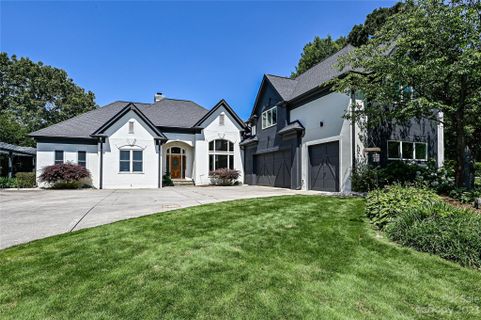
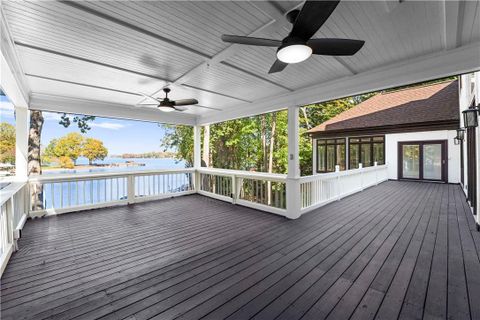
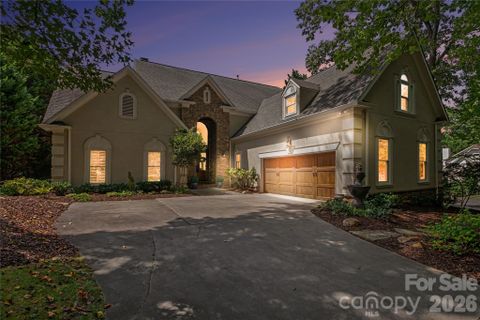
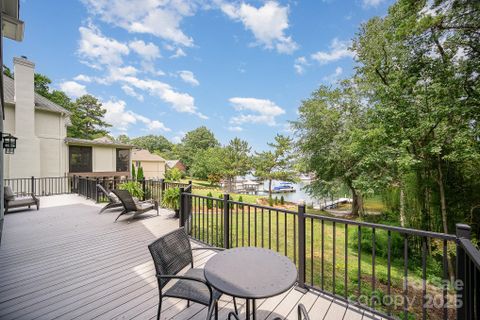
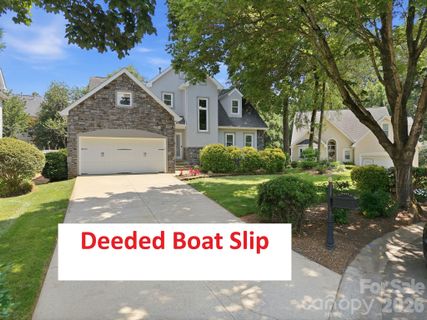
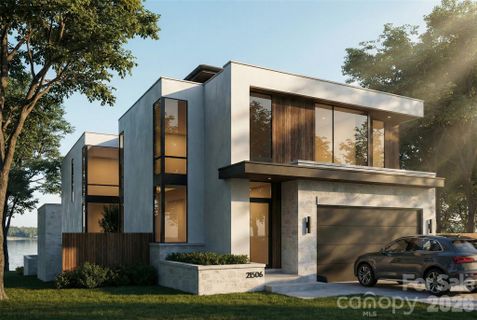
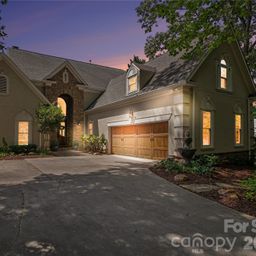
Most homes are waterfront or directly tied to the shoreline, and the listing language repeatedly centers on docks, day-dock access, boat lifts, cove views, and broad back-deck living. Garages are standard, basements appear in about a third of listings, and the architecture leans toward traditional lake houses with brick showing up often alongside stone details and some cedar accents. Inside, the recurring floor-plan elements are main-level primary suites, hardwood floors, bonus rooms, fireplaces, built-ins, and walk-in attic storage.
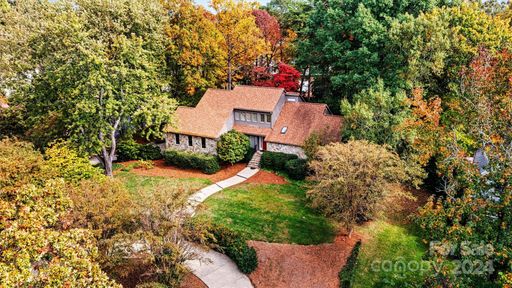
The community identity here is strongly lake-oriented. A shared boat ramp and day dock appear repeatedly, while many of the higher-end sales layer in private docks, lifts, pools, spas, fire pits, and long terraces aimed at the water. Outdoor living is not treated as an afterthought: decks appear throughout the neighborhood, screened porches are common, and cul-de-sac siting shows up often enough to feel like part of the streetscape.
Waterford Point also carries a distinctive visual rhythm. Several listings call out tree-canopied streets and gas lantern lighting, and the better waterfront addresses combine that setting with landscaped yards, cove frontage, and larger entertaining spaces. Rosslare Court, in particular, has produced some of the community's strongest pricing, running well above the neighborhood's closed-sale average.
For a lake neighborhood, the location stays closely tied to Cornelius conveniences. Listings repeatedly point to shopping and dining near Torrence Chapel, downtown Cornelius, nearby marinas and parks, and quick access to I-77 via Exit 28, with one sale placing the interstate roughly a mile away. School assignments in the community record are Cornelius Elementary, Bailey Middle, and William Amos Hough High.
Waterford Point works best for buyers who want a mature Lake Norman setting with large lots, established trees, and genuine boating utility, while still staying connected to everyday Cornelius errands and regional access.
Palmetto Park Realty Team · Cornelius
Ask about Waterford Point — we answer fast
See what it's worth — your home's own sale history plus recent Waterford Point sales, free.
What's my home worth?Communities similar to Waterford Point
 2.0 mi
 Island Forest, Cornelius
7 active · $1,799,900
 1.0 mi
 Chapel Point, Cornelius
3 active · $885,000
 0.2 mi
 Crown Harbor, Cornelius
3 active · $975,000
 0.7 mi
 Blue Stone Harbor, Cornelius
4 active · $736,500
 3.1 mi
 The Peninsula, Cornelius
25 active · $2,250,000
 0.6 mi
 Bahia Bay, Cornelius
6 active · $742,500
43 recently sold in Waterford Point, Cornelius
| Property | Sold | Sold Price | Days on Market | Size | Sold to Ask | Sold $/SF |
|---|---|---|---|---|---|---|
| | Apr 2 2026 | $969,000 | 34 | 3,342 sq ft | 103.2% | $290 |
| | Nov 10 2025 | $2,403,000 | 46 | 4,446 sq ft | 92.6% | $540 |
| | Sep 18 2025 | $1,775,000 | 47 | 3,404 sq ft | 100.0% | $521 |
| | Mar 17 2025 | $1,850,000 | 207 | 5,257 sq ft | 93.0% | $352 |
| | Feb 21 2025 | $930,000 | 112 | 2,669 sq ft | 95.0% | $348 |
| | Jun 27 2024 | $1,225,000 | 76 | 3,111 sq ft | 87.8% | $394 |
| | Aug 2 2023 | $2,350,000 | 59 | 6,495 sq ft | 94.0% | $362 |
| | May 12 2023 | $2,075,000 | 195 | 6,105 sq ft | 98.8% | $340 |
| | Jun 2 2022 | $1,225,000 | 27 | 4,320 sq ft | 102.1% | $284 |
| | Apr 8 2022 | $817,000 | 22 | 2,743 sq ft | 105.4% | $298 |
| | Jul 1 2021 | $1,450,000 | 49 | 3,394 sq ft | 103.6% | $427 |
| | Jul 1 2021 | $553,000 | 20 | 2,819 sq ft | 100.7% | $196 |
| | May 20 2021 | $890,000 | 77 | 3,125 sq ft | 101.1% | $285 |
| | Apr 13 2021 | $1,599,900 | 24 | 4,317 sq ft | 100.0% | $371 |
| | Oct 15 2020 | $950,000 | 108 | 3,008 sq ft | 95.5% | $316 |
| | Aug 4 2020 | $550,000 | 38 | 3,017 sq ft | 101.9% | $182 |
| | Jul 28 2020 | $526,000 | 32 | 2,869 sq ft | 102.1% | $183 |
| | Jul 10 2020 | $1,085,000 | 49 | 3,441 sq ft | 99.5% | $315 |
| | Jun 4 2020 | $627,000 | 91 | 3,501 sq ft | 100.3% | $179 |
| | May 14 2020 | $450,000 | 73 | 2,495 sq ft | 94.7% | $180 |
| | Jun 11 2019 | $1,340,000 | 33 | 6,467 sq ft | 97.5% | $207 |
| | Jun 10 2019 | $942,000 | 332 | 3,348 sq ft | 99.3% | $281 |
| | Mar 7 2019 | $507,000 | 41 | 2,819 sq ft | 97.7% | $180 |
| | Dec 20 2018 | $525,000 | 32 | 2,927 sq ft | 96.3% | $179 |
| | Nov 1 2018 | $453,100 | 87 | 3,055 sq ft | 93.9% | $148 |
| | Jan 9 2018 | $790,000 | 96 | 3,306 sq ft | 95.2% | $239 |
| | Aug 15 2017 | $395,000 | 57 | 2,374 sq ft | 99.0% | $166 |
| | May 15 2017 | $769,000 | 98 | 3,040 sq ft | 97.5% | $253 |
| | Dec 16 2016 | $445,000 | 120 | 3,017 sq ft | 98.9% | $147 |
| | May 27 2016 | $990,000 | 73 | 4,074 sq ft | 100.5% | $243 |
| | Nov 23 2015 | $465,000 | 115 | 2,722 sq ft | 97.9% | $171 |
| | Nov 20 2015 | $872,000 | 166 | 3,490 sq ft | 97.0% | $250 |
| | Jul 7 2015 | $775,000 | 89 | 3,900 sq ft | 97.0% | $199 |
| | Oct 8 2014 | $406,000 | 154 | 3,055 sq ft | 94.4% | $133 |
| | Aug 11 2014 | $712,875 | 123 | 4,094 sq ft | 89.7% | $174 |
| | Dec 23 2013 | $325,000 | 488 | 2,482 sq ft | 92.9% | $131 |
| | Oct 1 2013 | $667,720 | 99 | 3,040 sq ft | 95.5% | $220 |
| | Aug 30 2013 | $413,000 | 99 | 3,243 sq ft | 96.3% | $127 |
| | Jun 27 2013 | $762,000 | 440 | 3,447 sq ft | 98.3% | $221 |
| | Apr 30 2013 | $730,000 | 425 | 5,022 sq ft | 94.2% | $145 |
| | Oct 15 2012 | $1,100,000 | 212 | 5,363 sq ft | 91.7% | $205 |
| | Jul 20 2012 | $370,000 | 456 | 3,248 sq ft | 92.5% | $114 |
| | Mar 23 2012 | $737,000 | 103 | 3,448 sq ft | 89.3% | $214 |
Closed sales from MLS history for Waterford Point, Cornelius
Waterford Point median sale price is $950,000; Cornelius is up 7.3%.
Below trend-line threshold — city median shown for context
The Waterford Point real estate market shows buyer's market conditions. Homes typically sell within 87 days. With 2 active listings and 3 homes sold in the past year, buyers have more negotiating power and time to decide.
Listings taken off the market in the past year in Waterford Point, Cornelius
These homes are no longer available, but they show recent pricing and listing activity in Waterford Point. Our agents can help you watch for new listings in this area.
Contact an agentFree account needed — create one to continue viewing homes.
Members see everything — free👋 Still browsing Waterford Point?
Full photos, price history, and every active & pending home in Waterford Point with a free account.
Palmetto Park Realty Team
 $2.1M
$2.1M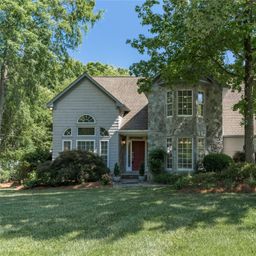 $890K
$890KCheck your messages
We sent a code to .
Verify your number and we'll text you price drops and new Waterford Point listings. 1–2 texts a month, stop anytime.
Enjoy full access to this home and every home on Palmetto Park.