Active
New
Open House Sat, Jul 25 3-5 PM
$650,000 $309/sqft
21334 Sandy Cove Road
Cornelius, NC 28031
3 bd · 3 ba · 2,101 sqft · 1984 · 1 d ago
Water
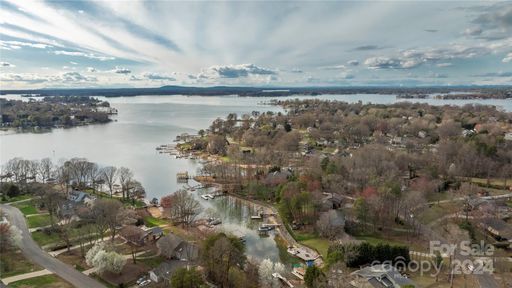
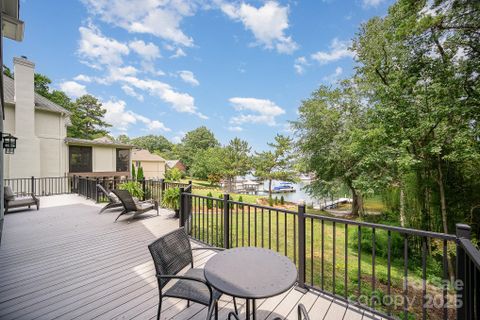
Rockridge Shores is one of those Cornelius neighborhoods where Lake Norman shapes the daily backdrop without turning the community into a high-density waterfront enclave.
Scheduled open houses in Rockridge Shores, Cornelius
Community overview based on MLS listing data for Rockridge Shores, Cornelius
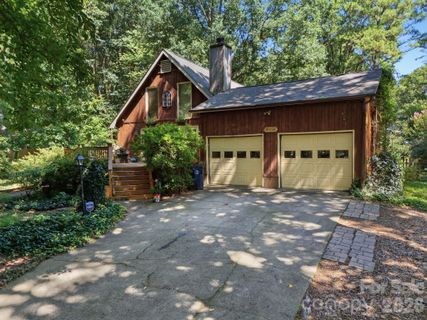
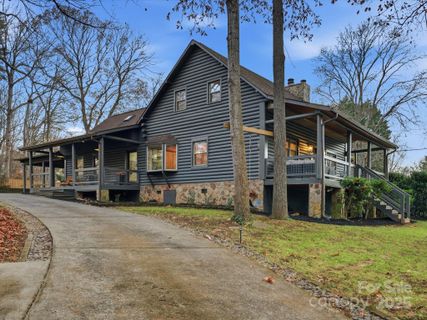
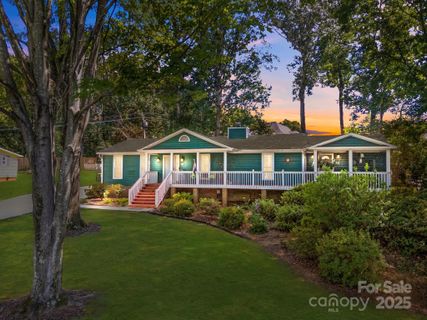
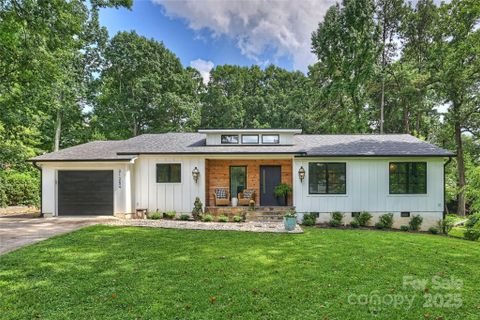
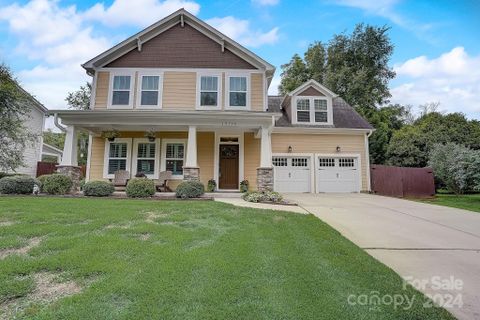
Rockridge Shores is one of those Cornelius neighborhoods where Lake Norman shapes the daily backdrop without turning the community into a high-density waterfront enclave. The streets mix ranch homes, rustic log designs, updated cottages, and newer custom construction, while the neighborhood boat ramp and waterfront picnic area keep the lake close at hand.
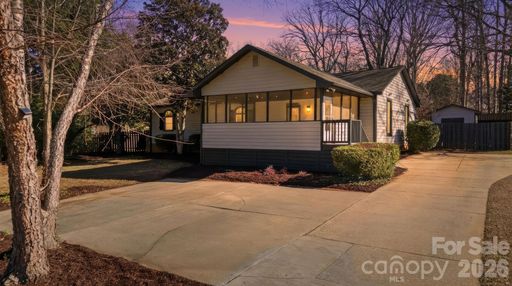
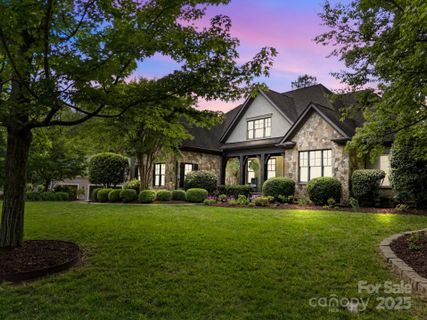
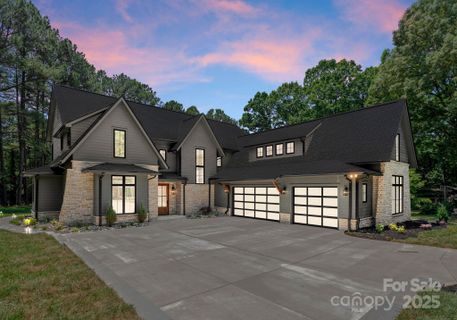
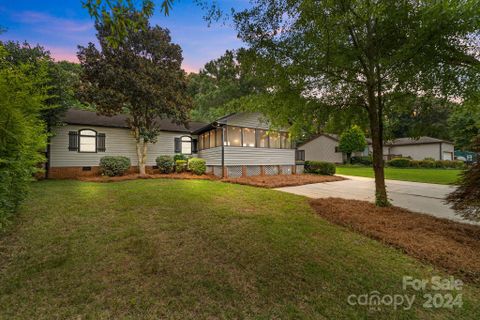
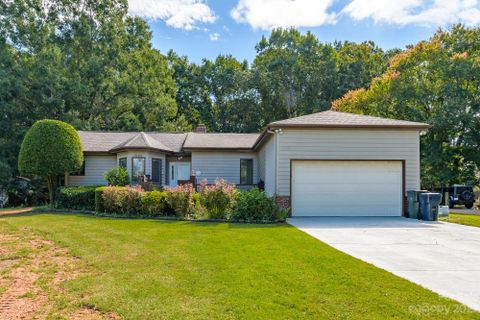
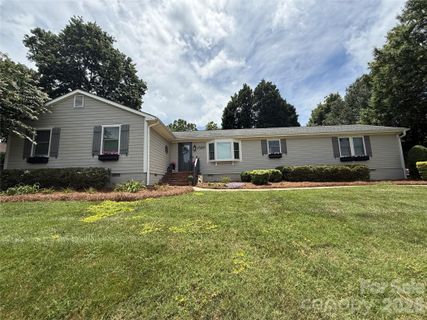
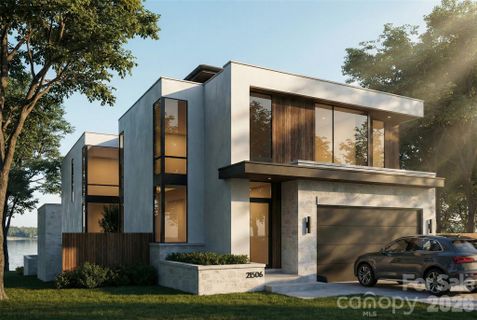
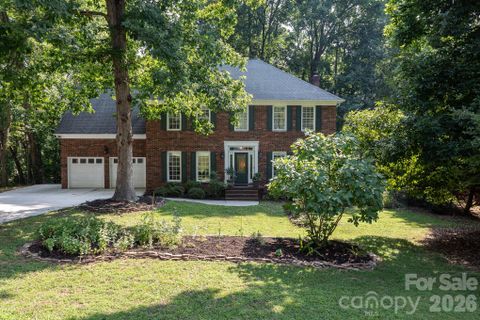
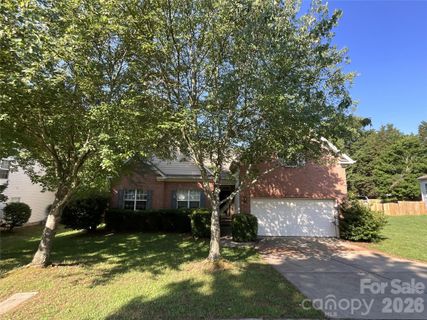
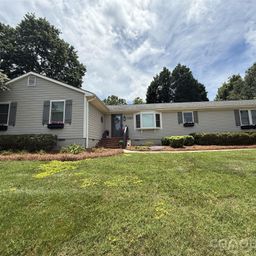
Rockridge Shores stands out for its lot sizes as much as its lake access. The community average runs just over half an acre, and the median recorded lot size lands near 20,500 square feet, giving many homes room for fenced yards, detached storage, long driveways, and outdoor living areas that would be harder to find in tighter Cornelius subdivisions. The housing stock is anchored by late-1970s through mid-1980s construction, but newer infill and custom homes add range at the upper end, including recent sales above $1 million and a 2025 new-construction close above $2 million.
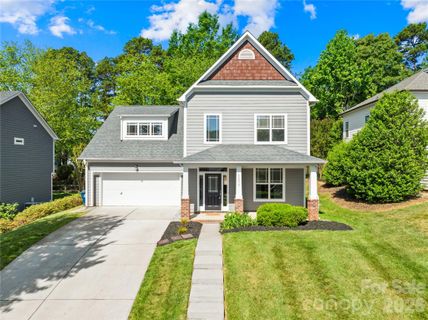
The architecture is varied rather than uniform. Ranch layouts appear often, but so do vaulted great rooms, fireplaces, screened or covered porches, and kitchens updated with granite or quartz surfaces and stainless appliances. Sandy Cove Road has produced the community’s strongest closed pricing, helped by a higher concentration of custom homes, water-oriented sites, and broader lake views.
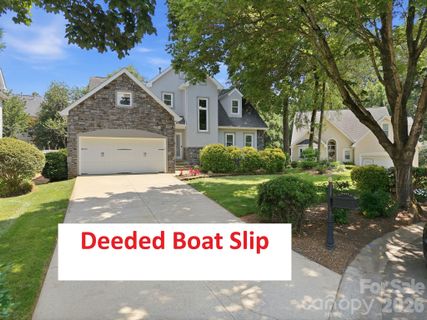
Lake access is the defining amenity here. Rockridge Shores has a community boat ramp, and several homes are marketed within a short walk of the neighborhood lake lot, day-dock access, or paddlesport launch. The waterfront picnic area gives the community a shared gathering spot, but the overall feel stays residential rather than resort-driven. There is no strong evidence of a clubhouse or pool package; instead, the appeal centers on simple Lake Norman access, larger yards, and the ability to keep boats, trailers, and other gear at home.
That practical character shows up throughout the neighborhood. Listings repeatedly highlight open living areas, fenced backyards, mature trees, lake views, and a balance of renovation and original character. Private pools do appear at a few of the higher-end homes, but they are individual property upgrades rather than a neighborhood-wide feature.
The setting places Rockridge Shores in western Cornelius near everyday shopping, dining, and quick access to I-77, with several listings calling out the short drive to Charlotte. Torrence Chapel Park is close by, and the common school assignment points to Cornelius Elementary, Bailey Middle, and William Amos Hough High. In practice, Rockridge Shores offers a Lake Norman address with more elbow room than many nearby neighborhoods and a housing mix that ranges from approachable lake-access ranch homes to custom waterfront showpieces.
Palmetto Park Realty Team · Cornelius
Ask about Rockridge Shores — we answer fast
See what it's worth — your home's own sale history plus recent Rockridge Shores sales, free.
What's my home worth?Communities similar to Rockridge Shores
 0.4 mi
 Bahia Bay, Cornelius
8 active · $742,500
 0.4 mi
 Blue Stone Harbor, Cornelius
4 active · $731,500
 1.2 mi
 Magnolia Estates, Cornelius
2 active · $689,500
 0.7 mi
 McKenzie Place, Cornelius
2 active · $520,000
 0.6 mi
 Chapel Point, Cornelius
3 active · $849,000
 0.3 mi
 Torrence Chapel Estates, Cornelius
2 active · $712,450
46 recently sold in Rockridge Shores, Cornelius
| Property | Sold | Sold Price | Days on Market | Size | Sold to Ask | Sold $/SF |
|---|---|---|---|---|---|---|
| | May 26 2026 | $799,900 | 131 | 2,504 sq ft | 100.0% | $319 |
| | Feb 23 2026 | $455,000 | 178 | 1,897 sq ft | 99.1% | $240 |
| | Feb 11 2026 | $534,000 | 21 | 1,816 sq ft | 102.7% | $294 |
| | Aug 25 2025 | $795,000 | 45 | 2,416 sq ft | 94.6% | $329 |
| | Jul 25 2025 | $1,350,000 | 85 | 4,000 sq ft | 94.7% | $338 |
| | Jul 21 2025 | $2,150,000 | 53 | 4,203 sq ft | 95.6% | $512 |
| | Aug 29 2024 | $500,000 | 41 | 1,833 sq ft | 96.2% | $273 |
| | Jul 1 2024 | $799,900 | 24 | 2,612 sq ft | 100.0% | $306 |
| | Apr 19 2024 | $1,450,000 | 40 | 2,257 sq ft | 103.6% | $642 |
| | Dec 21 2023 | $510,000 | 79 | 2,155 sq ft | 92.7% | $237 |
| | Nov 15 2023 | $619,000 | 84 | 2,504 sq ft | 100.0% | $247 |
| | Mar 7 2023 | $355,000 | 50 | 2,366 sq ft | 91.0% | $150 |
| | Nov 17 2022 | $1,437,500 | 97 | 4,737 sq ft | 90.0% | $303 |
| | Aug 25 2022 | $435,000 | 44 | 1,406 sq ft | 90.6% | $309 |
| | Jul 1 2022 | $233,000 | 128 | — | 93.2% | — |
| | Dec 30 2021 | $469,900 | 47 | 1,945 sq ft | 100.0% | $242 |
| | Oct 14 2021 | $375,000 | 77 | 1,714 sq ft | 89.3% | $219 |
| | Sep 3 2021 | $440,500 | 28 | 1,792 sq ft | 102.7% | $246 |
| | Jun 11 2021 | $556,000 | 28 | 2,700 sq ft | 103.9% | $206 |
| | Mar 18 2021 | $925,000 | 53 | 1,967 sq ft | 97.4% | $470 |
| | Sep 30 2020 | $330,000 | 28 | 1,597 sq ft | 104.8% | $207 |
| | Apr 21 2020 | $329,900 | 167 | 1,818 sq ft | 100.0% | $181 |
| | Dec 20 2019 | $450,000 | 93 | 2,700 sq ft | 100.2% | $167 |
| | Jul 23 2019 | $265,000 | 138 | 1,584 sq ft | 101.9% | $167 |
| | May 30 2019 | $375,000 | 84 | 2,278 sq ft | 87.2% | $165 |
| | Mar 29 2019 | $247,500 | 105 | 2,423 sq ft | 88.4% | $102 |
| | Jan 8 2019 | $302,000 | 151 | 2,345 sq ft | 94.7% | $129 |
| | Aug 15 2018 | $255,000 | 38 | 1,609 sq ft | 96.2% | $158 |
| | Jun 4 2018 | $725,000 | 135 | 1,951 sq ft | 100.0% | $372 |
| | Mar 22 2018 | $72,000 | 22 | — | 93.5% | — |
| | Jun 29 2017 | $745,000 | 85 | 2,951 sq ft | 87.6% | $252 |
| | Jun 14 2017 | $279,000 | 79 | 2,753 sq ft | 93.0% | $101 |
| | Jan 27 2017 | $650,000 | 84 | 2,293 sq ft | 94.9% | $283 |
| | Aug 19 2016 | $737,000 | 67 | 2,861 sq ft | 95.1% | $258 |
| | Feb 25 2016 | $635,000 | 626 | 3,518 sq ft | 93.5% | $181 |
| | Nov 24 2015 | $790,000 | 65 | 4,655 sq ft | 97.5% | $170 |
| | Aug 19 2015 | $375,000 | 57 | 2,580 sq ft | 100.0% | $145 |
| | Mar 19 2015 | $205,000 | 62 | 1,768 sq ft | 102.6% | $116 |
| | Oct 1 2014 | $238,000 | 57 | 2,753 sq ft | 97.1% | $86 |
| | Aug 26 2014 | $615,000 | 146 | 3,542 sq ft | 96.2% | $174 |
| | May 6 2014 | $185,000 | 146 | 1,599 sq ft | 94.9% | $116 |
| | Oct 24 2013 | $390,000 | 436 | 3,167 sq ft | 94.0% | $123 |
| | May 10 2013 | $460,000 | 149 | 2,146 sq ft | 100.5% | $214 |
| | Jun 25 2012 | $567,500 | 103 | 3,719 sq ft | 94.6% | $153 |
| | Mar 9 2012 | $154,900 | 162 | 2,310 sq ft | 100.0% | $67 |
| | Jan 10 2012 | $196,000 | 69 | 2,748 sq ft | 98.0% | $71 |
Closed sales from MLS history for Rockridge Shores, Cornelius
Rockridge Shores median sale price is $797,450; Cornelius is up 7.3%.
+1 outside price range.
The Rockridge Shores real estate market shows buyer's market conditions. Homes typically sell within 84 days. With 2 active listings and 5 homes sold in the past year, buyers have more negotiating power and time to decide.
Free account needed — create one to continue viewing homes.
Members see everything — free👋 Still browsing Rockridge Shores?
Full photos, price history, and every active & pending home in Rockridge Shores with a free account.
Palmetto Park Realty Team
 $650K
$650K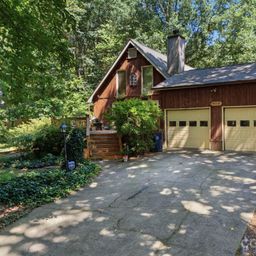 $450K
$450KCheck your messages
We sent a code to .
Verify your number and we'll text you price drops and new Rockridge Shores listings. 1–2 texts a month, stop anytime.
Enjoy full access to this home and every home on Palmetto Park.