Active
$299,900 $193/sqft
1550 Indian Springs Drive
Conover, NC 28613
3 bd · 2 ba · 1,552 sqft · 2003 · 1 mo ago
Fireplace Garage
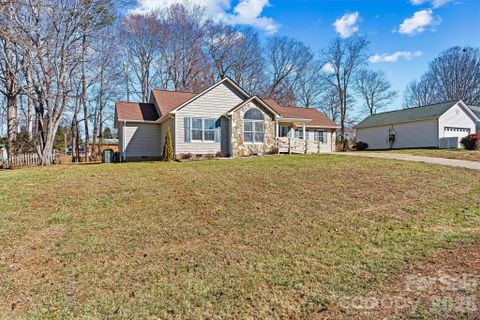
Indian Springs in Conover has the feel of an established suburban pocket that has settled into its own rhythm.
Community overview based on MLS listing data for Indian Springs, Conover
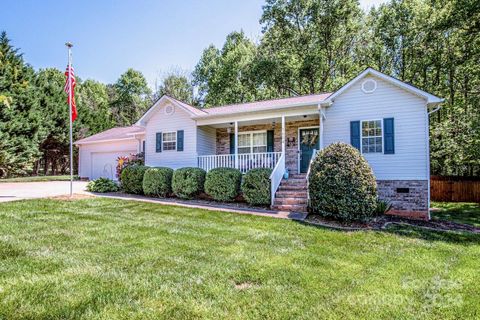
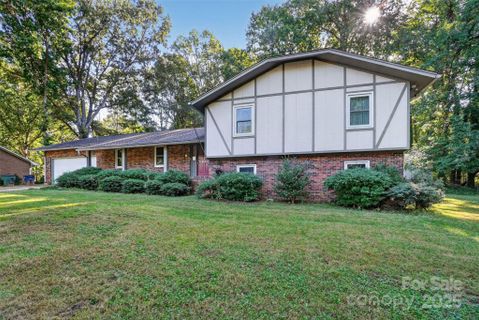
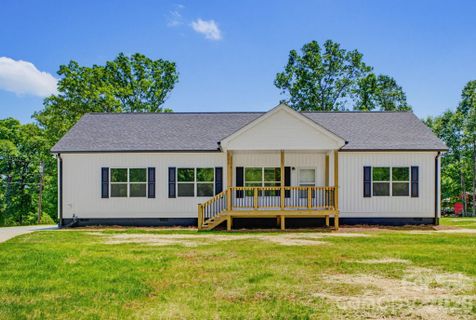
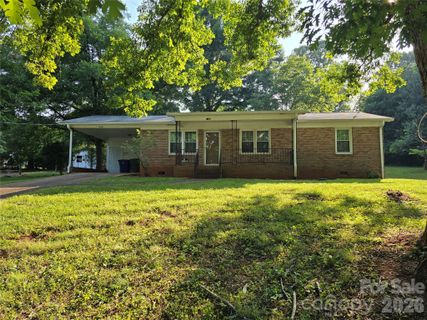
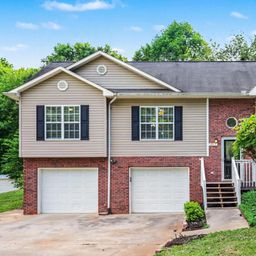
Indian Springs in Conover has the feel of an established suburban pocket that has settled into its own rhythm. Most homes sit on generous lots, with mature landscaping, level yards, and a street pattern that reads as comfortably residential rather than overly formal. The neighborhood’s character comes through in the homes themselves: practical ranch layouts, split-level designs, and a steady mix of updates that make the community feel lived-in and well cared for.
"A well-kept Conover neighborhood where everyday convenience meets roomy, usable homes."
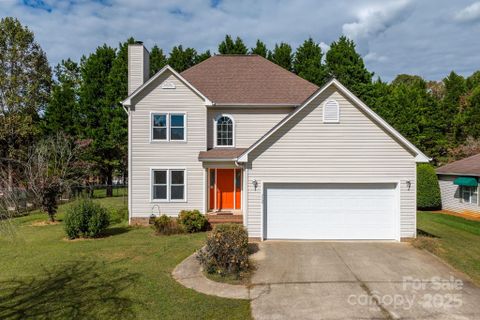
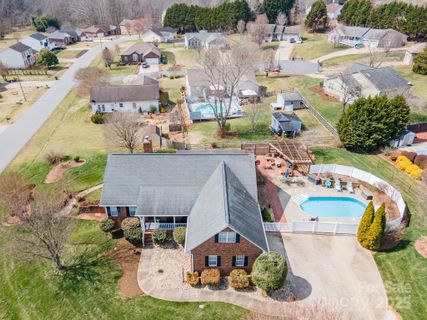
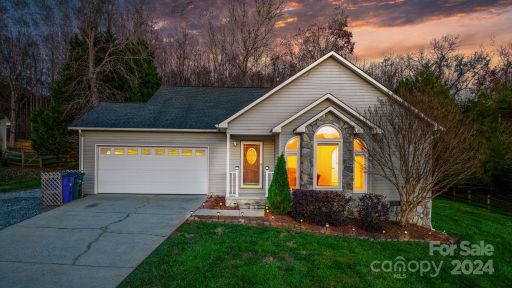
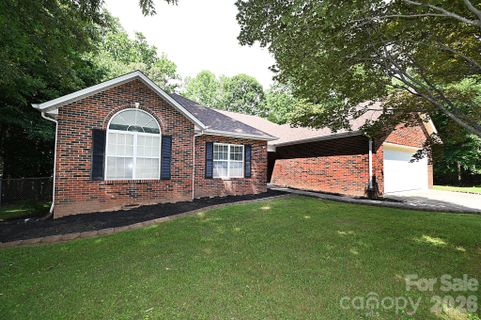
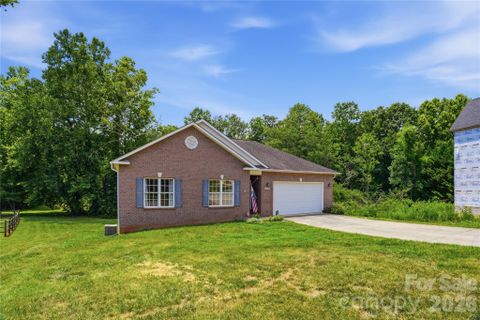
The housing here is almost entirely single-family, with construction concentrated from the mid-1990s through the late 2000s. Many homes feature brick exteriors, and some are full brick while others pair brick with vinyl siding for a lower-maintenance look. Inside, the floor plans tend to favor open living areas, vaulted ceilings, fireplaces, and flexible spaces such as sunrooms, bonus rooms, or finished lower levels. Garages are a defining feature of the neighborhood, and fenced back yards, decks, screened porches, and patios show up often enough to shape the way these homes are used day to day.
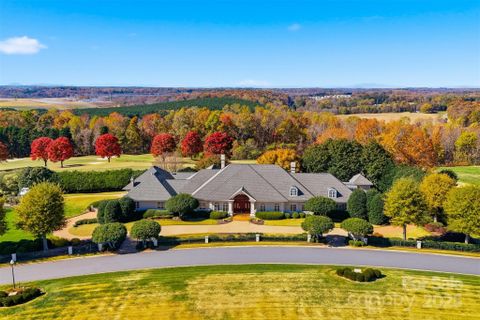
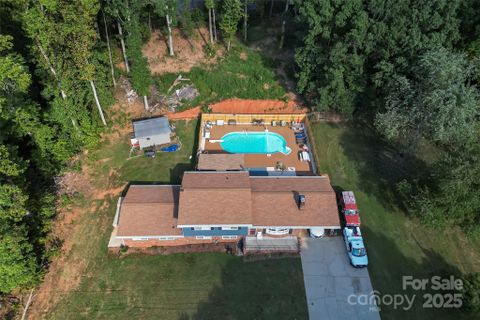
Lot sizes are a real part of the appeal. With average acreage approaching half an acre, the setting gives homes more breathing room than you find in many newer subdivisions. That extra space supports landscaping, outdoor seating, storage buildings, and room for hobbies without feeling cramped.
Indian Springs is not a place built around a clubhouse lifestyle or shared recreation complex; instead, the appeal is in the homes and the ease of getting around town. The neighborhood’s daily rhythm is straightforward and practical. Residents can move from a morning coffee on the back deck to a short drive for errands, school drop-offs, or a trip into nearby shopping and dining corridors. Several homes mention quick access to major highways, which makes the community feel connected without being on top of the traffic.
"Roomy lots, flexible interiors, and quick highway access define the neighborhood’s everyday appeal."
Indian Springs sits in Conover with a strong connection to the I-40 and Hwy 16 corridor, and some listings also note access to Hwy 321 and Hwy 70. Public remarks repeatedly point to quick trips into downtown Conover, plus easy reach to Newton and Hickory. Charlotte Douglas International Airport is also cited at roughly 45 minutes from one listing, underscoring the community’s regional connectivity. Nearby conveniences include shopping, dining, recreation, and medical facilities, though the listings stay broad rather than naming one dominant center.
School assignments are consistent: Shuford Elementary, Newton Conover Middle, and Newton Conover High. That continuity, along with the neighborhood’s established feel and practical location, helps explain why Indian Springs remains a recognizable Conover address.
Palmetto Park Realty Team · Conover
Ask about Indian Springs — we answer fast
See what it's worth — your home's own sale history plus recent Indian Springs sales, free.
What's my home worth?Communities similar to Indian Springs
Showing 1-48+ recently sold in Indian Springs, Conover
| Property | Sold | Sold Price | Days on Market | Size | Sold to Ask | Sold $/SF |
|---|---|---|---|---|---|---|
| | Mar 27 2026 | $303,000 | 28 | 1,718 sq ft | 101.0% | $176 |
| | Mar 26 2026 | $293,000 | 42 | 1,848 sq ft | 97.7% | $159 |
| | Feb 25 2026 | $303,000 | 120 | 1,792 sq ft | 94.7% | $169 |
| | Aug 26 2025 | $499,000 | 78 | 2,129 sq ft | 100.0% | $234 |
| | May 30 2025 | $475,000 | 74 | 2,274 sq ft | 105.6% | $209 |
| | Mar 3 2025 | $320,000 | 87 | 1,425 sq ft | 98.5% | $225 |
| | Jan 17 2025 | $319,900 | 49 | 1,375 sq ft | 100.0% | $233 |
| | Jan 15 2025 | $328,000 | 61 | 2,931 sq ft | 95.1% | $112 |
| | Aug 21 2024 | $310,000 | 92 | 1,970 sq ft | 98.4% | $157 |
| | Jul 11 2024 | $319,000 | 73 | 1,746 sq ft | 100.0% | $183 |
| | Mar 11 2024 | $269,900 | 32 | 1,326 sq ft | 100.0% | $204 |
| | May 19 2023 | $305,000 | 33 | 2,079 sq ft | 101.7% | $147 |
| | Dec 12 2022 | $260,000 | 38 | 1,476 sq ft | 98.9% | $176 |
| | Dec 9 2022 | $15,000 | 46 | — | 100.0% | — |
| | Dec 8 2022 | $5,900 | 45 | — | 100.0% | — |
| | Nov 18 2022 | $425,000 | 39 | 2,110 sq ft | 106.3% | $201 |
| | Sep 22 2022 | $275,000 | 34 | 1,684 sq ft | 98.2% | $163 |
| | Aug 26 2022 | $345,000 | 45 | 1,729 sq ft | 104.9% | $200 |
| | Apr 14 2022 | $306,500 | 45 | 1,807 sq ft | 102.2% | $170 |
| | Mar 28 2022 | $315,300 | 42 | 1,853 sq ft | 98.8% | $170 |
| | Feb 1 2022 | $275,000 | 33 | 1,426 sq ft | 110.0% | $193 |
| | Nov 29 2021 | $288,000 | 28 | 1,763 sq ft | 100.9% | $163 |
| | Oct 18 2021 | $250,000 | 38 | 1,276 sq ft | 100.0% | $196 |
| | May 28 2021 | $230,000 | 43 | 1,445 sq ft | 102.3% | $159 |
| | Mar 5 2021 | $282,000 | 102 | 2,402 sq ft | 100.8% | $117 |
| | Feb 22 2021 | $222,000 | 31 | 1,792 sq ft | 101.0% | $124 |
| | Feb 12 2021 | $270,000 | 56 | 2,337 sq ft | 101.9% | $116 |
| | Feb 4 2021 | $266,000 | 63 | 2,235 sq ft | 96.8% | $119 |
| | Nov 16 2020 | $159,900 | 32 | 1,274 sq ft | 100.0% | $126 |
| | Oct 20 2020 | $218,200 | 46 | 1,724 sq ft | 99.6% | $127 |
| | Oct 6 2020 | $186,000 | 36 | 1,300 sq ft | 99.5% | $143 |
| | Jul 31 2020 | $180,000 | 185 | 1,530 sq ft | 100.0% | $118 |
| | May 28 2020 | $185,000 | 81 | 1,675 sq ft | 88.1% | $110 |
| | Aug 29 2019 | $199,900 | 104 | 2,187 sq ft | 100.0% | $91 |
| | Jul 17 2019 | $189,900 | 128 | 1,644 sq ft | 100.0% | $116 |
| | May 24 2019 | $283,000 | 14 | 2,646 sq ft | 99.3% | $107 |
| | Feb 28 2019 | $240,000 | 48 | 2,418 sq ft | 102.2% | $99 |
| | Feb 22 2019 | $218,000 | 35 | 1,767 sq ft | 103.8% | $123 |
| | Jul 20 2018 | $166,500 | 56 | 1,489 sq ft | 98.2% | $112 |
| | Jun 28 2018 | $163,625 | 42 | 1,388 sq ft | 102.3% | $118 |
| | Dec 20 2017 | $174,000 | 66 | 1,963 sq ft | 96.7% | $89 |
| | Dec 15 2017 | $146,000 | 67 | 1,388 sq ft | 100.7% | $105 |
| | Dec 15 2017 | $146,000 | 74 | 1,388 sq ft | 100.7% | $105 |
| | Dec 14 2017 | $190,000 | 62 | 1,635 sq ft | 100.0% | $116 |
| | Nov 14 2017 | $173,500 | 98 | 1,484 sq ft | 102.1% | $117 |
| | Sep 28 2017 | $236,000 | 49 | 2,143 sq ft | 104.9% | $110 |
| | Sep 28 2017 | $236,000 | 49 | 2,143 sq ft | 104.9% | $110 |
| | Aug 3 2017 | $138,000 | 44 | 1,735 sq ft | 100.0% | $80 |
Closed sales from MLS history for Indian Springs, Conover
Indian Springs median sale price is $303,000, down 5.3% from a year ago; Conover is up 0.0%.
+1 outside price range.
The Indian Springs real estate market shows buyer's market conditions. Homes typically sell within 65 days. With 2 active listings and 4 homes sold in the past year, buyers have more negotiating power and time to decide.
Free account needed — create one to continue viewing homes.
Members see everything — free👋 Still browsing Indian Springs?
Full photos, price history, and every active & pending home in Indian Springs with a free account.
Palmetto Park Realty Team
 $310K
$310K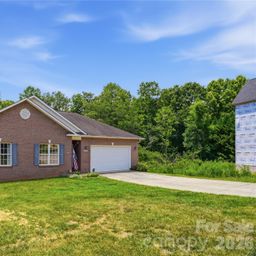 $300K
$300KCheck your messages
We sent a code to .
Verify your number and we'll text you price drops and new Indian Springs listings. 1–2 texts a month, stop anytime.
Enjoy full access to this home and every home on Palmetto Park.