Active
New
Homesite
$85,000
0 Ragans Pointe Pointe
Columbus, NC 28722
4.1 ac · 13 d ago
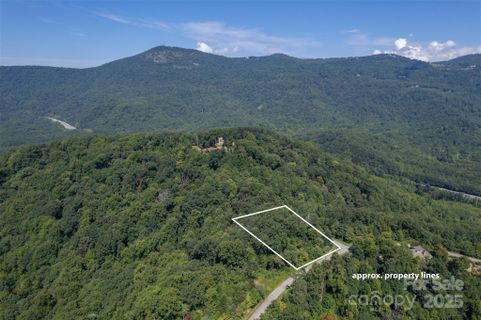
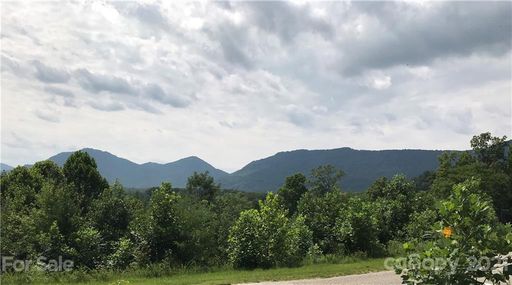
The Sanctuary of Tryon feels like a mountain enclave built for people who want big views, generous lots, and an easy connection to the Tryon-Columbus area.
Community overview based on MLS listing data for The Sanctuary Of Tryon, Columbus
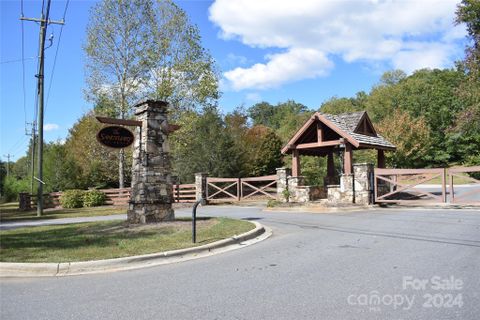
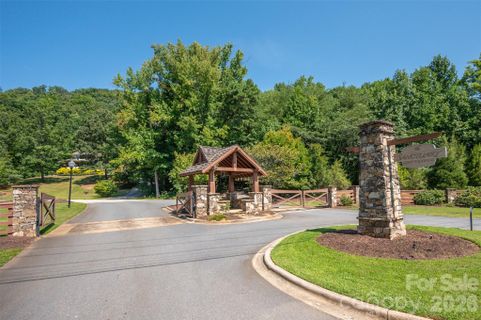
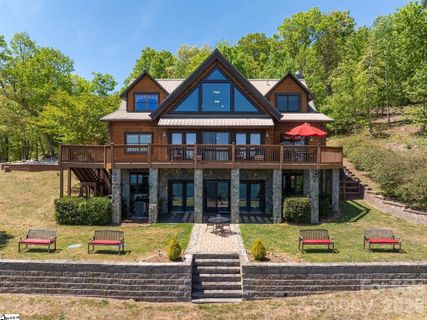
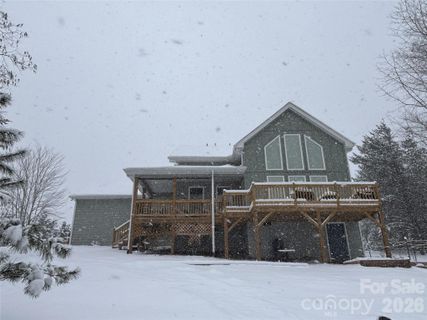
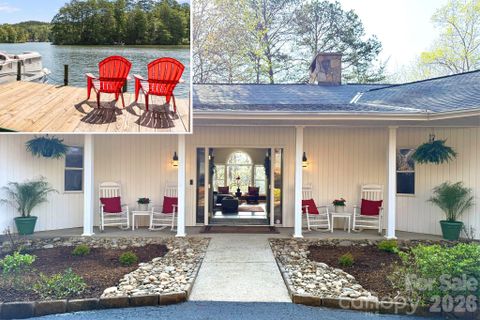
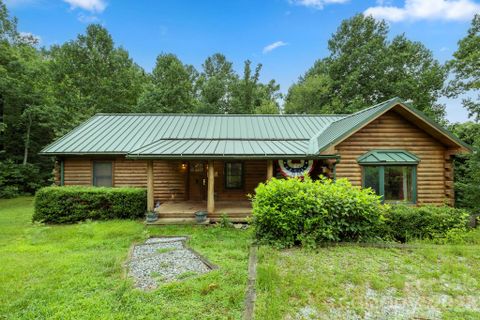
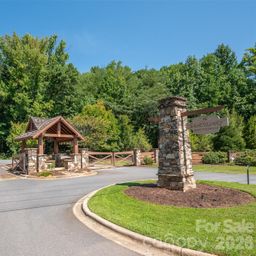
The Sanctuary of Tryon feels like a mountain enclave built for people who want big views, generous lots, and an easy connection to the Tryon-Columbus area. Most of the community is made up of homesites, so the first impression is less about a uniform streetscape and more about elevation, privacy, and the sense that each parcel has room to breathe. Gated access, paved roads, and underground utilities give the neighborhood a finished feel, while the ridgeline setting keeps the scenery front and center.
"Mountain views and everyday convenience meet on a quiet ridgeline setting."
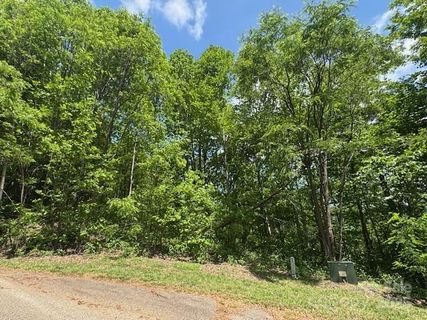
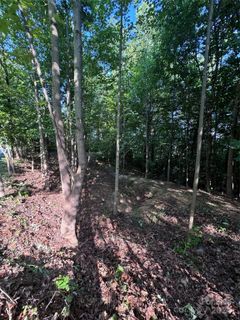
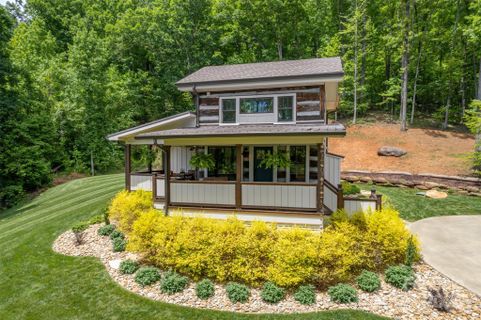
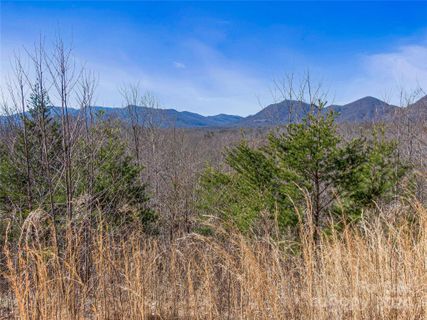
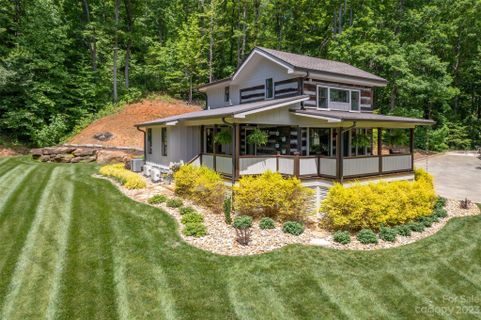
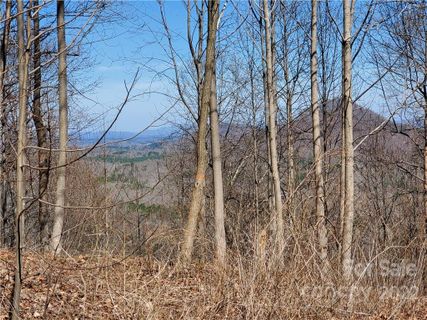
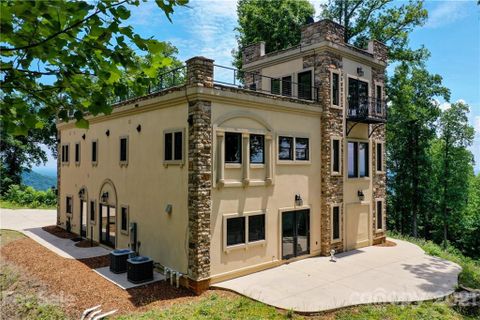
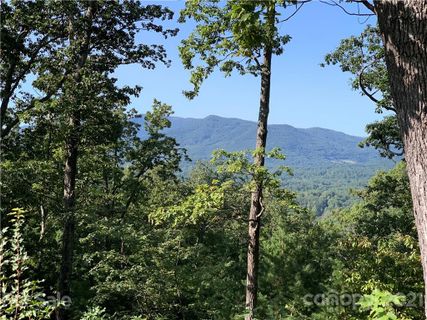
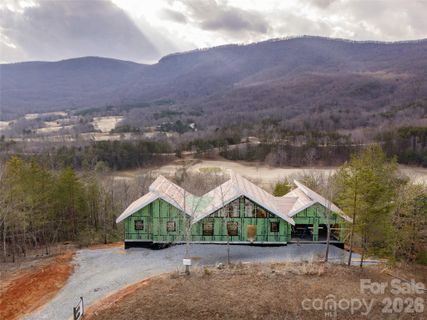
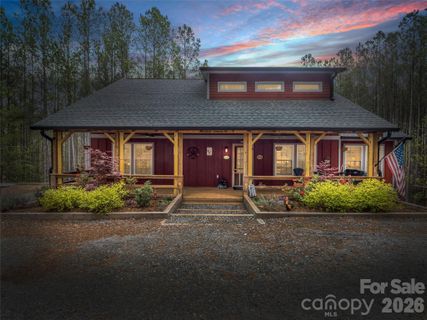
This is primarily a land community, with residential lots ranging from compact building sites to multi-acre parcels. A few homes have already been built, including a fully renovated cabin that blends vintage log character with newer additions, but the overall identity is still shaped by custom-home potential. That means buyers are often looking at long-range mountain views, cleared homesites, cul-de-sac positions, and room to design a residence around the land rather than the other way around.
The feel here is polished but not overdeveloped. Many parcels emphasize western or panoramic views, and several remarks highlight underground power, city or community water, and internet availability. The result is a setting that keeps its mountain character while still offering practical infrastructure for building.
Daily life here revolves around access and outlook. The community’s gated entry, paved private roads, and utility-ready lots make it easy to picture a build without sacrificing the mountain setting. Outdoor living is a recurring theme, whether that means a tucked-away cul-de-sac lot, a treetop escape, or a site overlooking the town of Columbus. Nearby, the Tryon International Equestrian Center adds a distinct regional draw, and Green River Game Lands offers another layer of outdoor recreation.
"It is a place where the landscape does the selling, but the infrastructure makes the vision workable."
The Sanctuary of Tryon sits in the Columbus/Tryon area with especially strong access to I-26 and Highway 74. Several remarks place downtown Tryon about 5 to 10 minutes away, downtown Columbus just minutes away, and the Tryon International Equestrian Center roughly 15 minutes from the neighborhood. Downtown Tryon’s library, hospital, and grocery stores are also called out, along with easy reach to Landrum, Saluda, Hendersonville, Asheville, Spartanburg, and both Greenville-Spartanburg International Airport and Asheville Regional Airport.
School assignments in the community are tied to Polk County, with Polk Middle and Polk High noted in the records. That county setting, combined with the road network and nearby services, gives the neighborhood a practical foothold in a scenic mountain location.
Palmetto Park Realty Team · Columbus
Ask about The Sanctuary Of Tryon — we answer fast
Communities similar to The Sanctuary Of Tryon
 1.9 mi
 White Oak Mountain, Columbus
16 active · $21,250
 6.7 mi
 Mountain Park At Lake Adger, Mill Spring
4 active · $237,450
 6.3 mi
 Lake Adger, Mill Spring
26 active · $220,750
 3.7 mi
 Little Warrior Mtn Estates, Saluda
8 active · $44,450
 7.0 mi
 Brights Creek, Mill Spring
57 active · $154,900
 9.7 mi
 Hillcrest, Mill Spring
6 active · $225,000
20 recently sold in The Sanctuary Of Tryon, Columbus
| Property | Sold | List Price | DOM | Size | List $/SF |
|---|---|---|---|---|---|
| | May 8 2026 | $444,000 | 210 | 1,282 sq ft | $346 |
| | Sep 4 2025 | $75,000 | 28 | — | — |
| | May 6 2025 | $35,000 | 234 | — | — |
| | Jul 26 2023 | $425,000 | 61 | 1,282 sq ft | $332 |
| | Jun 30 2022 | $38,000 | 128 | — | — |
| | Dec 16 2021 | $785,000 | 140 | 3,122 sq ft | $251 |
| | Sep 28 2021 | $79,900 | 54 | — | — |
| | Sep 22 2021 | $89,900 | 351 | — | — |
| | Nov 30 2020 | $84,900 | 83 | — | — |
| | Sep 25 2020 | $90,000 | 199 | — | — |
| | May 28 2019 | $39,900 | 326 | — | — |
| | May 28 2019 | $29,900 | 326 | — | — |
| | Apr 1 2019 | $32,750 | 416 | — | — |
| | Mar 18 2019 | $530,000 | 112 | — | — |
| | Nov 15 2017 | $42,000 | 933 | — | — |
| | Sep 1 2017 | $175,000 | 2 | — | — |
| | Jun 30 2017 | $31,000 | 717 | — | — |
| | Dec 29 2016 | $64,900 | 493 | — | — |
| | Jul 21 2015 | $29,000 | 88 | — | — |
| | May 21 2015 | $49,000 | 7 | — | — |
Aggregated from MLS listing history for The Sanctuary Of Tryon, Columbus
The The Sanctuary Of Tryon real estate market shows buyer's market conditions. Homes typically sell within 119 days. With 4 active listings and 2 homes sold in the past year, buyers have more negotiating power and time to decide.
Free account needed — create one to continue viewing homes.
Members see everything — free👋 Still browsing The Sanctuary Of Tryon?
Full photos, price history, and every active & pending home in The Sanctuary Of Tryon with a free account.
Palmetto Park Realty Team
 $85K
$85K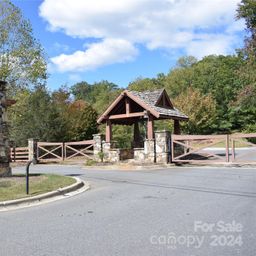 $79K
$79K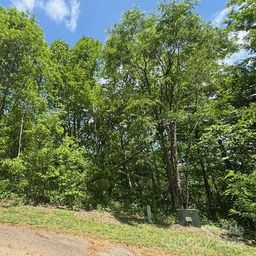 $69K
$69K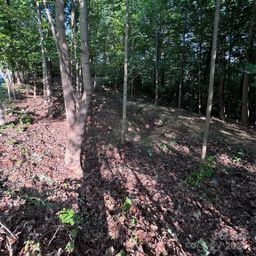 $55K
$55KCheck your messages
We sent a code to .
Verify your number and we'll text you price drops and new The Sanctuary Of Tryon listings. 1–2 texts a month, stop anytime.
Enjoy full access to this home and every home on Palmetto Park.