Active
$885,000 $317/sqft
711 Winfield Drive
Clyde, NC 28721
3 bd · 3 ba · 2,793 sqft · 2 ac · 2015 · 3 mo ago
Fireplace Garage
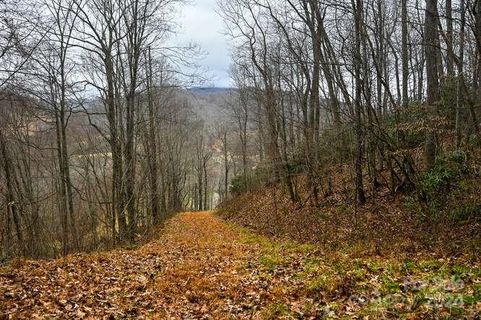
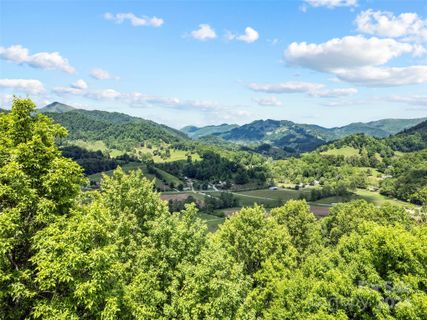
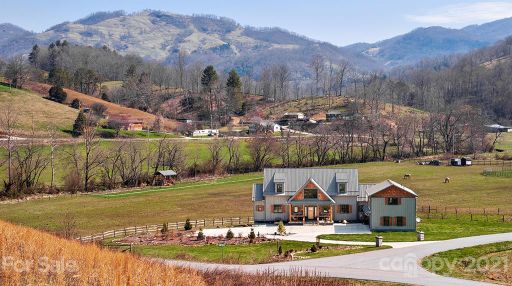
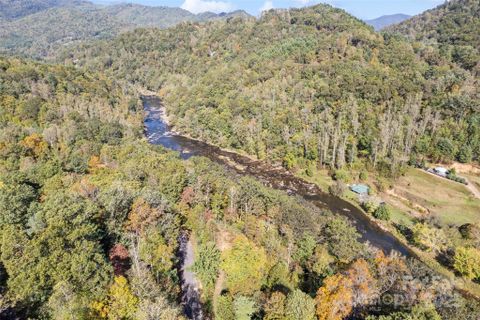
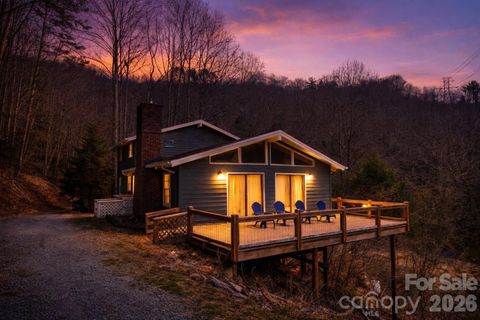
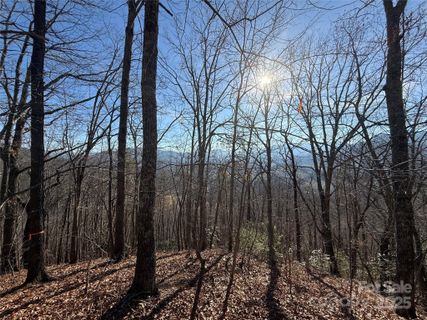
Winfield Estates sits in the Crabtree area of Clyde with a distinctly mountain-country setting: long views, paved access, and a sense of space that comes from large homesites and rolling topography.
Community overview based on MLS listing data for Winfield Estates, Clyde
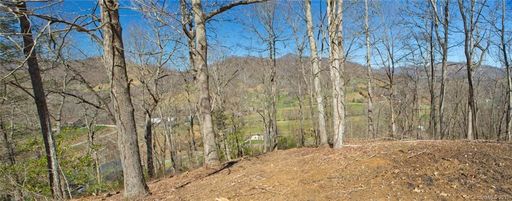
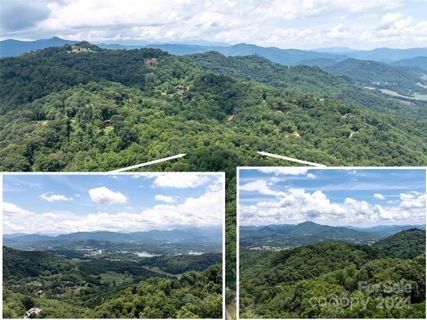
Winfield Estates sits in the Crabtree area of Clyde with a distinctly mountain-country setting: long views, paved access, and a sense of space that comes from large homesites and rolling topography. The community’s early identity was built around estate tracts and buildable ridgelines, and that still shapes the feel today. Many properties are designed to take in the scenery, whether that means a cleared building pad, a deck overlooking the valley, or a home positioned to capture layered mountain views.
"Estate-sized lots and long-range views define the everyday experience here."
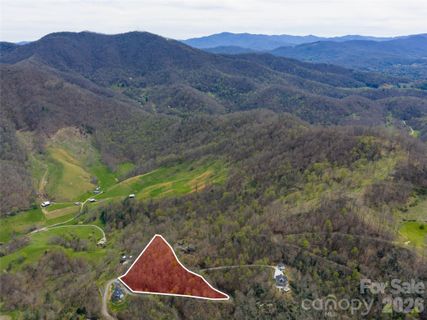
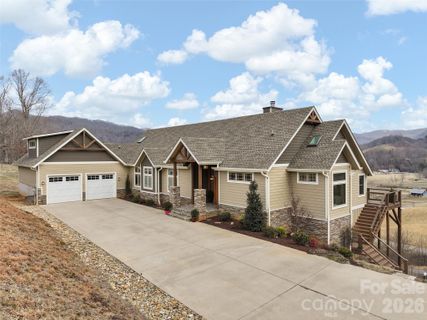
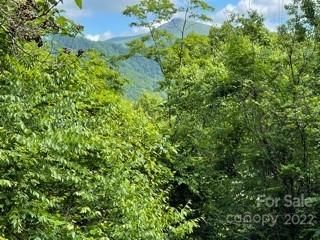
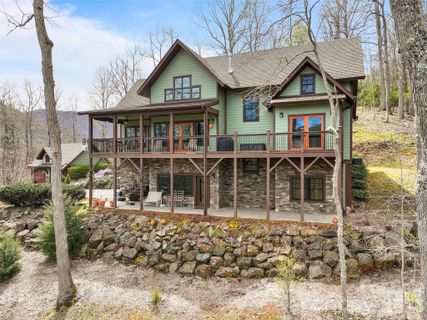
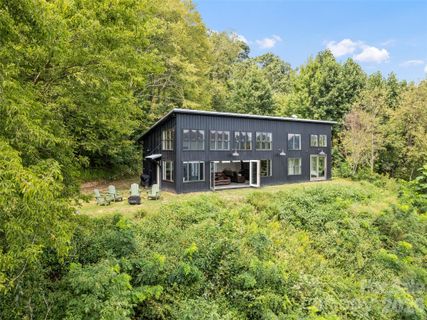
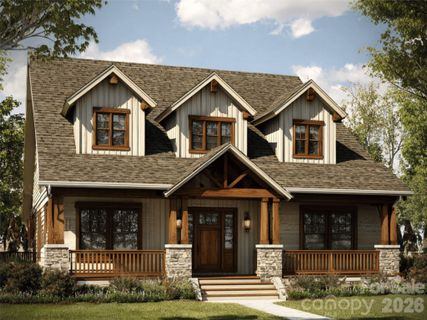
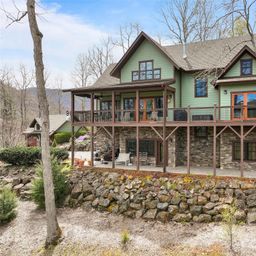
The neighborhood leans strongly toward custom, higher-end mountain homes alongside vacant residential lots ready for new construction. Existing residences show a clear preference for Craftsman and custom mountain architecture, with open layouts, vaulted or cathedral ceilings, stone fireplaces, generous windows, and outdoor living spaces that extend the home into the landscape. Several homes also include features that support flexible use of space, such as lower-level family rooms, guest apartments, workshops, and oversized garages. Lot sizes are notably generous, and the community’s low-density layout gives each address room to breathe. With underground utilities, paved roads, and a setting that feels tucked into the hills, Winfield Estates balances refinement with a rural edge.
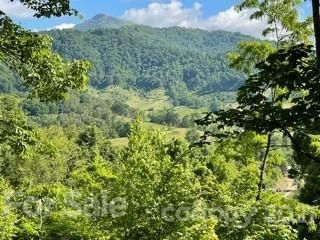
Daily life here is shaped less by shared recreation and more by the land itself. Homesites emphasize privacy, view corridors, and practical access, while finished properties often highlight decks, fireplaces, garages, and workshop space. Fiber optic internet appears in community remarks, which is a useful modern touch in a setting that otherwise feels deeply rooted in the mountains. The pace is unhurried, with winding drives, wooded edges, and open stretches of pastoral land contributing to the character.
"This is a place where the scenery is part of the architecture."
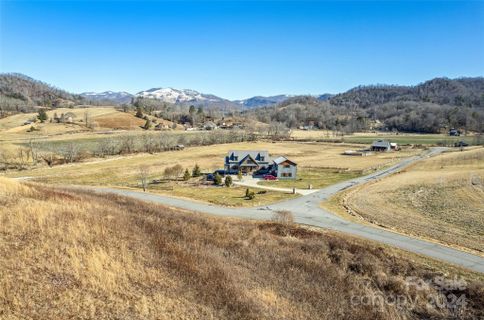
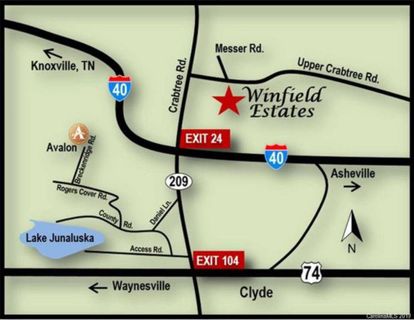
Winfield Estates is positioned in the Crabtree Valley area of Clyde, with direct references to I-40 access, about 3 miles away in some listings. Waynesville is commonly described as 15 minutes from the community, Lake Junaluska about 10 minutes away, and Asheville roughly 25 to 30 minutes by car. One listing also notes 24 miles to the Tennessee border, underscoring the community’s western mountain setting. Nearby destinations called out in remarks include Lake Junaluska, the Asheville area, and the broader Waynesville corridor. School assignments associated with the community are Riverbend Elementary, Waynesville Middle, and Tuscola High, with the overall school profile best described as well-regarded.
Palmetto Park Realty Team · Clyde
Ask about Winfield Estates — we answer fast
Communities similar to Winfield Estates
 3.8 mi
 River Woods, Waynesville
2 active · $165,000
 2.4 mi
 Rich Top Mountain, Clyde
3 active · $450,000
 4.3 mi
 Avalon, Waynesville
13 active · $285,000
 5.1 mi
 Dream Valley, Clyde
9 active · $109,000
 4.7 mi
 Panther Creek Estates, Clyde
4 active · $92,500
 4.3 mi
 Rabbits Ridge, Waynesville
8 active · $44,555
15 recently sold in Winfield Estates, Clyde
| Property | Sold | List Price | DOM | Size | List $/SF |
|---|---|---|---|---|---|
| | Mar 31 2026 | $1,180,000 | 46 | 2,471 sq ft | $478 |
| | Apr 10 2025 | $89,900 | 448 | — | — |
| | Jul 15 2024 | $59,700 | 49 | — | — |
| | Oct 10 2022 | $89,500 | 472 | — | — |
| | Jul 26 2022 | $99,500 | 396 | — | — |
| | Jul 26 2022 | $94,500 | 396 | — | — |
| | Sep 14 2021 | $1,445,000 | 142 | 4,810 sq ft | $300 |
| | Jul 25 2019 | $86,500 | 671 | — | — |
| | Jun 10 2019 | $86,500 | 41 | — | — |
| | Aug 30 2018 | $675,000 | 84 | 3,502 sq ft | $193 |
| | May 18 2016 | $499,900 | 68 | 3,660 sq ft | $137 |
| | Dec 7 2015 | $375,000 | 89 | 1,750 sq ft | $214 |
| | Apr 2 2014 | $149,950 | 1501 | — | — |
| | Aug 8 2013 | $99,950 | 1264 | — | — |
| | Nov 23 2012 | $84,250 | 1006 | — | — |
Aggregated from MLS listing history for Winfield Estates, Clyde
The Winfield Estates real estate market shows buyer's market conditions. Homes typically sell within 396 days. With 3 active listings and 1 home sold in the past year, buyers have more negotiating power and time to decide.
Free account needed — create one to continue viewing homes.
Members see everything — free👋 Still browsing Winfield Estates?
Full photos, price history, and every active & pending home in Winfield Estates with a free account.
Palmetto Park Realty Team
 $885K
$885K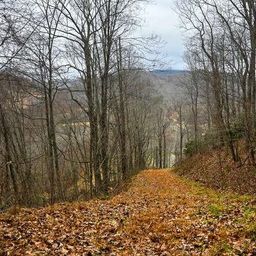 $250K
$250K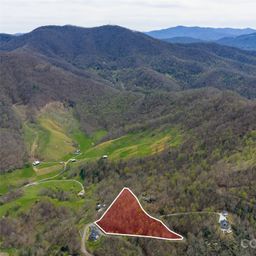 $145K
$145KCheck your messages
We sent a code to .
Verify your number and we'll text you price drops and new Winfield Estates listings. 1–2 texts a month, stop anytime.
Enjoy full access to this home and every home on Palmetto Park.