Active
$659,900 $180/sqft
2431 Napa Terrace
Clover, SC 29710
5 bd · 4 ba · 3,664 sqft · 2022 · 11 d ago
Pool Fireplace Garage
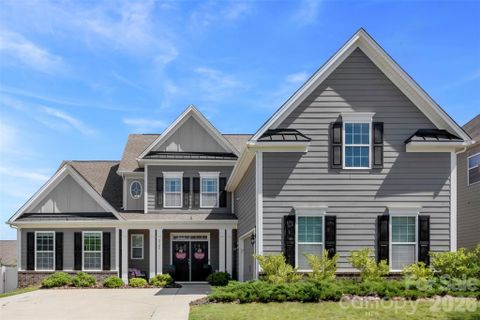
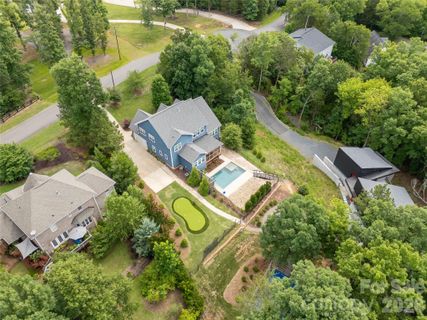
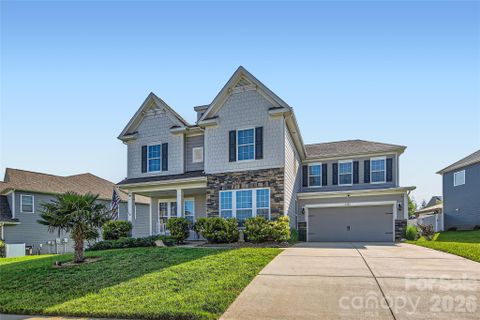
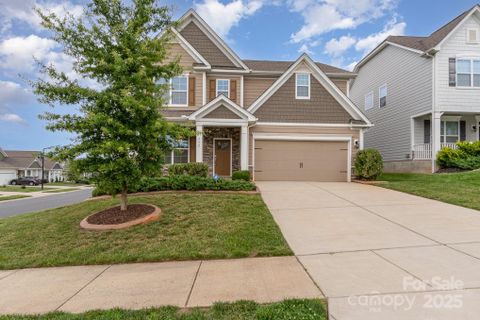
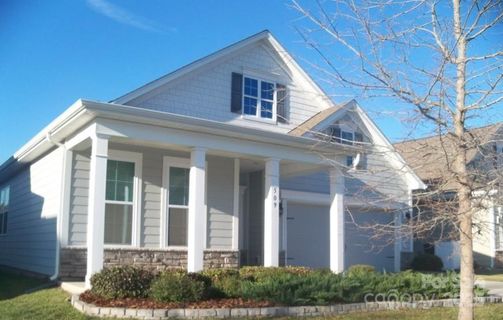
Cypress Point has the polished feel of a newer Lake Wylie community, with homes built from 2018 through 2022 and a streetscape shaped by well-kept lots, attached garages, and open, contemporary plans.
Listing summary: 1 Active30 Recently Sold
$659,900 $180/sqft
Clover, SC 29710
5 bd · 4 ba · 3,664 sqft · 2022 · 11 d ago
$675,000 $177/sqft
Clover, SC 29710
5 bd · 4 ba · 3,813 sqft · 2021 · DOM: 80 d
$695,000 $193/sqft
Clover, SC 29710
5 bd · 4 ba · 3,607 sqft · 2020 · DOM: 76 d
$675,000 $191/sqft
Clover, SC 29710
5 bd · 4 ba · 3,542 sqft · 2020 · DOM: 81 d
$475,000 $260/sqft
Clover, SC 29710
3 bd · 2 ba · 1,827 sqft · 2019 · DOM: 35 d
$700,000 $186/sqft
Clover, SC 29710
5 bd · 4 ba · 3,769 sqft · 2021 · DOM: 46 d
$459,900 $164/sqft
Clover, SC 29710
4 bd · 4 ba · 2,800 sqft · 2019 · DOM: 145 d
$649,900 $172/sqft
Clover, SC 29710
5 bd · 4 ba · 3,769 sqft · 2022 · DOM: 78 d
$750,000 $165/sqft
Clover, SC 29710
5 bd · 4 ba · 4,541 sqft · 2021 · DOM: 29 d
York County, South Carolina; Lake Wylie / Charlotte metro fringe
Walkability: Medium
$598,000 $185/sqft
Clover, SC 29710
4 bd · 3 ba · 3,232 sqft · 2020 · DOM: 82 d
$425,900 $227/sqft
Clover, SC 29710
4 bd · 2 ba · 1,877 sqft · 2019 · DOM: 44 d
$555,000 $224/sqft
Clover, SC 29710
4 bd · 3 ba · 2,478 sqft · 2020 · DOM: 35 d
Community overview based on MLS listing data for Cypress Point, Clover
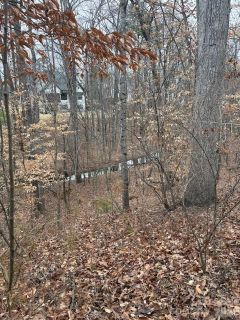
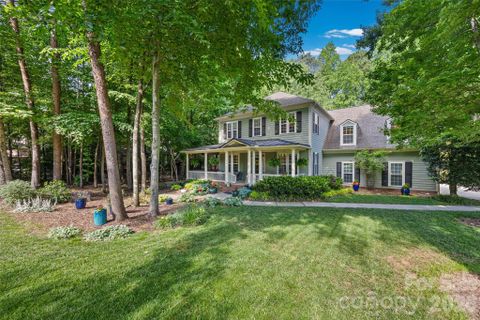
Cypress Point has the polished feel of a newer Lake Wylie community, with homes built from 2018 through 2022 and a streetscape shaped by well-kept lots, attached garages, and open, contemporary plans. The setting leans toward spacious, move-in-ready living, where front porches, extended patios, and fenced backyards create an easy indoor-outdoor rhythm. Many homes also make the most of the surroundings with seasonal lake views, wooded backdrops, or cul-de-sac placements.
"A newer Lake Wylie neighborhood where polished finishes and resort-style amenities shape the daily experience."
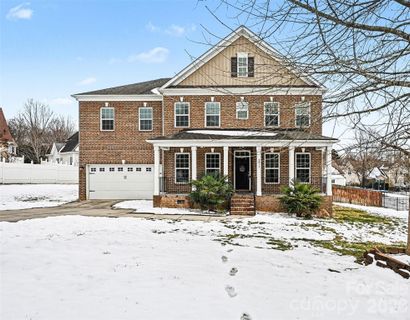
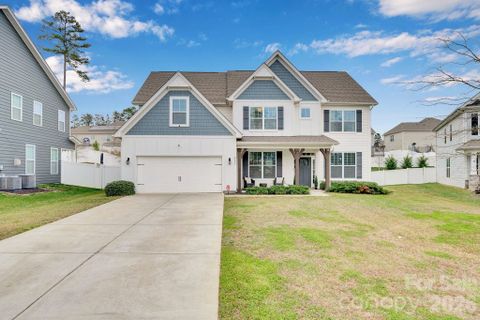
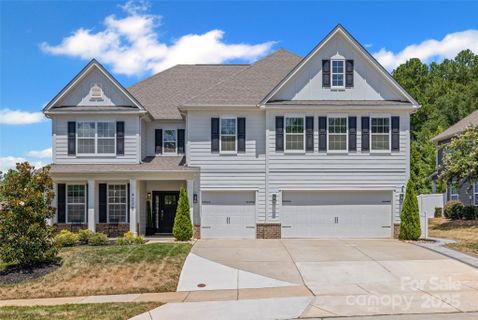
This is a single-family neighborhood at its core, and the homes tend to deliver the features buyers notice right away: open-concept main levels, large kitchen islands, granite or quartz surfaces, stainless appliances, gas cooking, and flexible rooms that work as offices, lofts, or bonus spaces. Main-level guest suites and first-floor primary bedrooms appear often enough to define the neighborhood’s appeal, while details like coffered ceilings, tray ceilings, hardwood or LVP flooring, and covered porches add a more finished look.
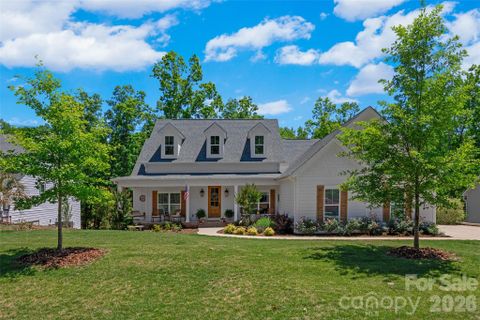
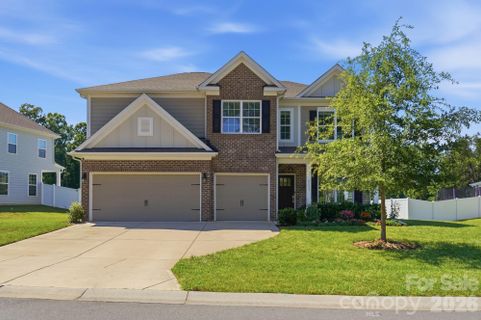
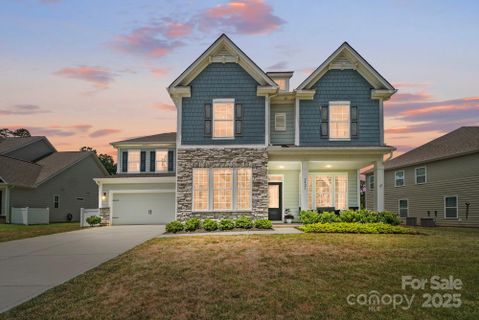
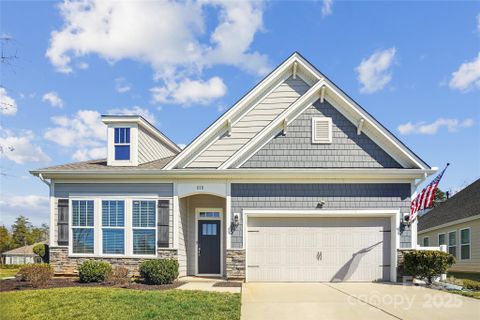
The architectural feel is consistent and upscale without being fussy. Lots are generally manageable in size, and the community’s newer construction gives the streets a cohesive, established-new look. With garage parking on every home and no basement presence, the emphasis stays on practical, low-maintenance living above grade.
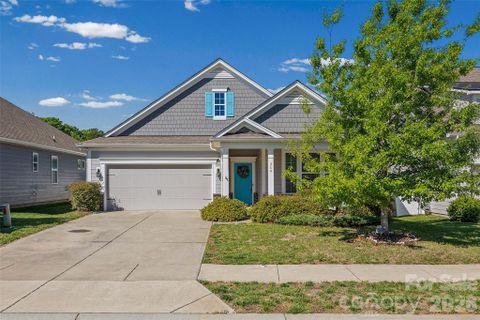
Cypress Point is built around amenities that encourage an active, social pace. The pool is a centerpiece, and remarks also point to pickleball, a clubhouse, fitness center, playground, tennis courts, bocce, picnic areas, and community events throughout the year. Sidewalks and pocket green space help the neighborhood feel connected, while private patios, fire pits, and outdoor kitchens make it easy to extend living space outside.
"Pool days, pickleball, and lake access give the neighborhood a distinctly resort-like cadence."
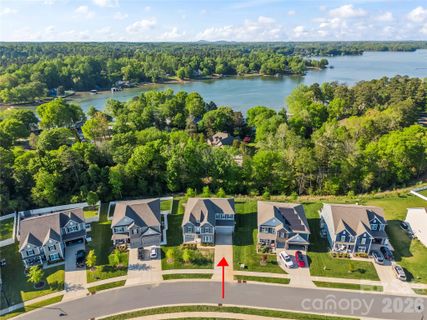
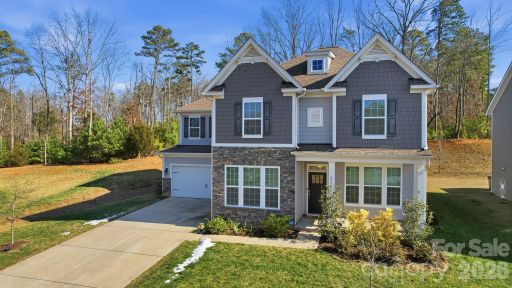
Lake Wylie is part of the everyday backdrop here, with nearby marinas and public boat access adding to the appeal for anyone who wants the water close at hand. Shopping and dining are also within an easy drive, so the community balances recreation with practical convenience.
Cypress Point sits in the Lake Wylie area of Clover, with convenient access to Charlotte and Charlotte Douglas International Airport. Public remarks consistently place the neighborhood close to shopping, dining, and recreation around Lake Wylie, and several listings note that the drive into Charlotte is straightforward. School references point to Oakridge Elementary, Oakridge Middle, and Clover High, with the broader Clover Schools system called out repeatedly.
For day-to-day orientation, think of Cypress Point as a Lake Wylie address with quick access to marinas, lake recreation, and the main retail and dining options serving the corridor. It is the kind of location that lets residents move easily between neighborhood amenities, the lake, and regional travel routes without giving up a settled residential setting.
Talk to a local agent about homes in Cypress Point, Clover
Communities similar to Cypress Point
30 recently sold in Cypress Point, Clover
| Property | Sold | List Price | DOM | Size | List $/SF |
|---|---|---|---|---|---|
| | Jul 2 2026 | $675,000 | 80 | 3,813 sq ft | $177 |
| | Jun 3 2026 | $695,000 | 76 | 3,607 sq ft | $193 |
| | Jun 1 2026 | $675,000 | 81 | 3,542 sq ft | $191 |
| | May 22 2026 | $475,000 | 35 | 1,827 sq ft | $260 |
| | Mar 31 2026 | $700,000 | 46 | 3,769 sq ft | $186 |
| | Oct 29 2025 | $459,900 | 145 | 2,800 sq ft | $164 |
| | Oct 1 2025 | $649,900 | 78 | 3,769 sq ft | $172 |
| | Aug 29 2025 | $750,000 | 29 | 4,541 sq ft | $165 |
| | Jun 4 2025 | $598,000 | 82 | 3,232 sq ft | $185 |
| | Apr 8 2025 | $425,900 | 44 | 1,877 sq ft | $227 |
| | Mar 27 2025 | $555,000 | 35 | 2,478 sq ft | $224 |
| | Jan 22 2025 | $440,000 | 153 | 1,747 sq ft | $252 |
| | Oct 2 2024 | $715,000 | 144 | 4,291 sq ft | $167 |
| | Sep 27 2024 | $450,000 | 49 | 1,819 sq ft | $247 |
| | Sep 17 2024 | $528,500 | 60 | 2,317 sq ft | $228 |
| | Aug 22 2024 | $499,000 | 21 | 2,443 sq ft | $204 |
| | Aug 6 2024 | $540,000 | 52 | 2,832 sq ft | $191 |
| | Apr 12 2024 | $560,000 | 57 | 2,766 sq ft | $202 |
| | Feb 28 2024 | $447,000 | 119 | 1,616 sq ft | $277 |
| | Feb 28 2022 | $624,900 | 81 | 4,439 sq ft | $141 |
| | Mar 11 2021 | $385,000 | 35 | 2,728 sq ft | $141 |
| | Aug 14 2019 | $382,760 | 76 | 3,119 sq ft | $123 |
| | Jun 4 2019 | $348,906 | 173 | 3,119 sq ft | $112 |
| | May 31 2019 | $353,704 | 69 | 3,119 sq ft | $113 |
| | May 24 2019 | $348,703 | 217 | 3,119 sq ft | $112 |
| | May 22 2019 | $349,900 | 160 | 3,119 sq ft | $112 |
| | May 9 2019 | $299,382 | 161 | 1,883 sq ft | $159 |
| | Apr 17 2019 | $324,173 | 124 | 2,766 sq ft | $117 |
| | Apr 3 2019 | $365,626 | 111 | 3,119 sq ft | $117 |
| | Mar 30 2019 | $352,199 | 0 | 3,119 sq ft | $113 |
Aggregated from MLS listing history for Cypress Point, Clover
The Cypress Point real estate market shows buyer's market conditions. Homes typically sell within 77 days. With 1 active listing and 8 homes sold in the past year, buyers have more negotiating power and time to decide.