Active
New
$215,000 $186/sqft
7301 Pebblestone Drive
Charlotte, NC 28212
2 bd · 1 ba · 1,153 sqft · 1984 · 9 d ago
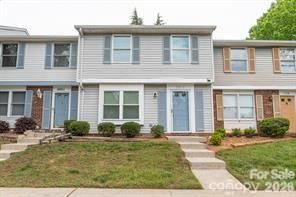
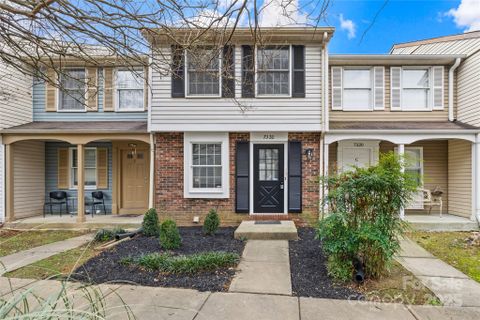
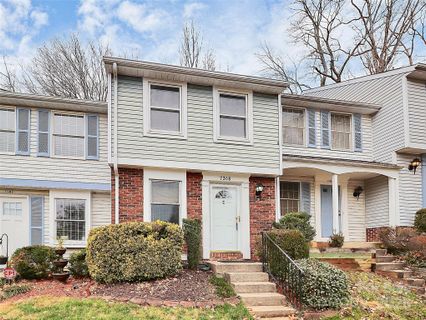
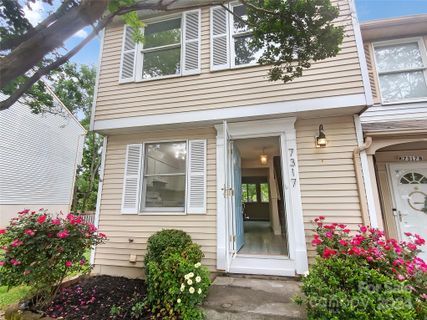
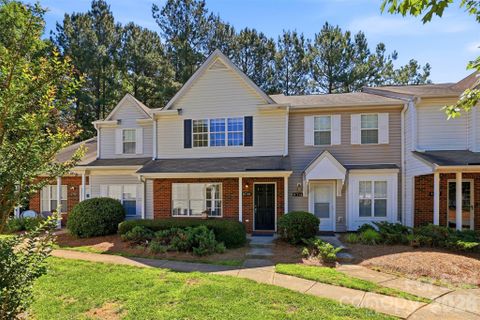
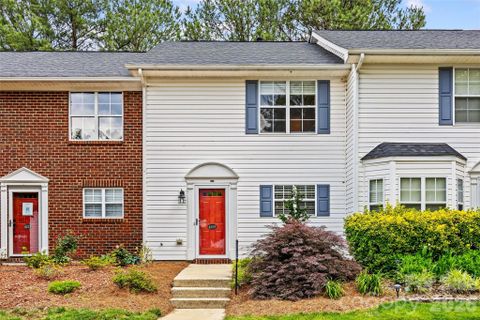
Waterford Townhomes has the feel of an established East Charlotte pocket where three-level layouts, compact lots, and mature landscaping create a distinctly townhouse rhythm.
Community overview based on MLS listing data for Waterford Townhomes, Charlotte
Waterford Townhomes has the feel of an established East Charlotte pocket where three-level layouts, compact lots, and mature landscaping create a distinctly townhouse rhythm. Built in the early-to-mid 1980s, the community leans into practical living rather than excess, with many homes offering flexible lower-level spaces, fenced outdoor areas, and end-unit privacy that stands out from the street. Prices have generally sat in an approachable range, which helps explain the steady interest here.
"A compact townhouse community with flexible space and an easy East Charlotte setting."
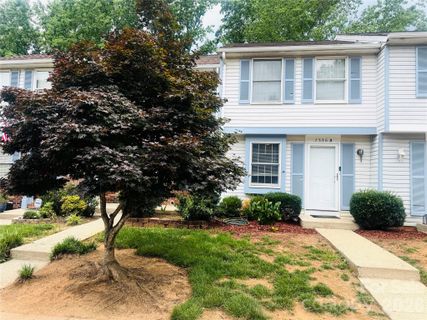
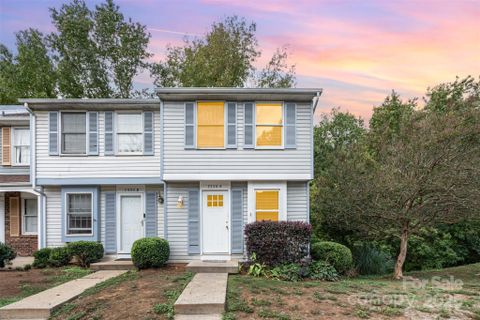
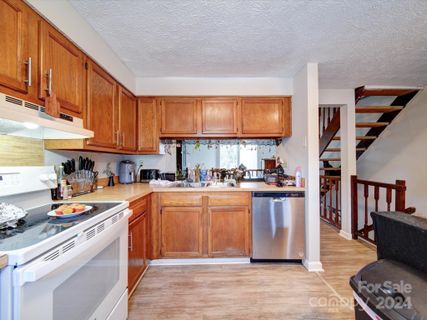
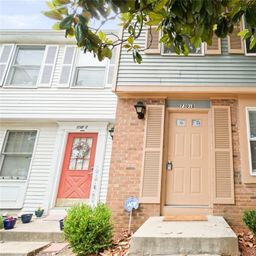
The neighborhood is made up of residential townhomes, mostly from 1982 through 1987, and the floor plans commonly stretch across multiple levels. That vertical layout is a defining part of the experience: main living spaces often sit above a lower-level bonus room, while upper floors hold the bedrooms. Many homes feature updated kitchens, fireplaces, fresh paint, new flooring, and fenced patios or backyards. Basement space is a major theme here, and it adds real versatility for storage, work, or extra living area. End units are especially appealing for their added light and more open side exposure. With assigned parking and no garage presence, the community keeps things simple and low-maintenance.
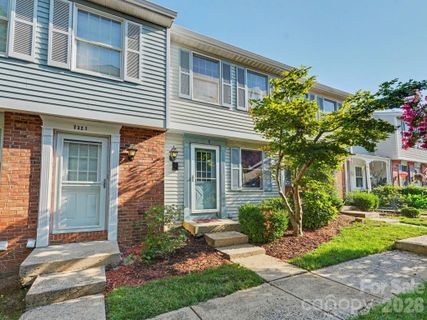
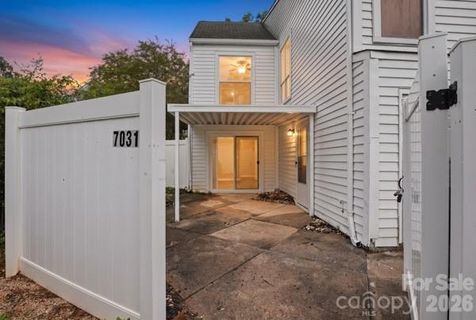
Waterford Townhomes does not read like a resort-style neighborhood; instead, it offers the kind of practical conveniences that make daily routines easier. Assigned parking is common, and the community’s compact scale keeps everything close at hand. Several homes open to fenced patios, decks, or small courtyards, giving residents a private outdoor extension without much upkeep. Creekside views, tree-top outlooks, and open common areas show up often enough to shape the setting, and some homes back to a lake or overlook shared green space. The overall mood is relaxed and functional, with a clear emphasis on livable square footage, storage, and adaptable rooms.
"Flexible interiors, fenced outdoor spaces, and a location that keeps errands within easy reach."
The community sits in East Charlotte near the Monroe Road and Independence Boulevard corridor, with quick access to I-485, I-277, and major thoroughfares that connect toward Uptown Charlotte and Matthews. Public remarks place it about 12 minutes from Uptown Charlotte, about 9 minutes from downtown Matthews, and less than 10 minutes from Cotswold/Oakhurst in some listings. McAlpine Creek Park is about a mile away, and McAlpine Creek Greenway, shopping, dining, and bus service are all called out as nearby conveniences. School names are not consistently specified in the current listing set, so the most reliable location cues are the corridor, commute times, and nearby recreation and retail destinations.
Palmetto Park Realty Team · Charlotte
Ask about Waterford Townhomes — we answer fast
See what it's worth — your home's own sale history plus recent Waterford Townhomes sales, free.
What's my home worth?Communities similar to Waterford Townhomes
 3.1 mi
 Stonington, Charlotte
4 active · $204,450
 3.9 mi
 Bay Village, Charlotte
2 active · $282,500
 5.1 mi
 Milton Commons, Charlotte
2 active · $178,500
 4.6 mi
 Kimmerly Woods, Charlotte
4 active · $239,499
Parkview At Matthews, Matthews
3 active · $315,000
 2.0 mi
 Melrose Townhomes, Matthews
2 active · $207,500
31 recently sold in Waterford Townhomes, Charlotte
| Property | Sold | Sold Price | Days on Market | Size | Sold to Ask | Sold $/SF |
|---|---|---|---|---|---|---|
| | Mar 26 2026 | $208,000 | 77 | 1,284 sq ft | 99.1% | $162 |
| | Feb 24 2026 | $208,000 | 48 | 1,364 sq ft | 96.7% | $152 |
| | Jan 21 2026 | $208,000 | 271 | 1,273 sq ft | 96.7% | $163 |
| | Dec 18 2025 | $205,000 | 189 | 1,295 sq ft | 95.3% | $158 |
| | Nov 13 2025 | $206,000 | 41 | 1,426 sq ft | 103.1% | $144 |
| | Aug 6 2024 | $210,000 | 88 | 1,198 sq ft | 95.5% | $175 |
| | Jul 16 2024 | $221,000 | 68 | 967 sq ft | 97.8% | $229 |
| | Jun 3 2024 | $205,000 | 47 | 1,352 sq ft | 100.0% | $152 |
| | Mar 28 2024 | $180,000 | 118 | 1,259 sq ft | 94.7% | $143 |
| | Aug 31 2023 | $215,000 | 79 | 1,225 sq ft | 97.7% | $176 |
| | Jul 13 2023 | $225,000 | 37 | 1,267 sq ft | 100.0% | $178 |
| | Jul 6 2023 | $230,000 | 21 | 1,316 sq ft | 95.8% | $175 |
| | May 23 2023 | $225,000 | 123 | 1,159 sq ft | 104.7% | $194 |
| | May 18 2023 | $240,000 | 28 | 1,396 sq ft | 100.8% | $172 |
| | May 9 2023 | $230,000 | 91 | 1,337 sq ft | 97.9% | $172 |
| | Mar 10 2023 | $241,000 | 36 | 1,314 sq ft | 102.6% | $183 |
| | Dec 9 2022 | $189,000 | 34 | 1,250 sq ft | 100.0% | $151 |
| | Jul 26 2022 | $213,000 | 47 | 1,329 sq ft | 96.8% | $160 |
| | Jul 1 2022 | $228,000 | 22 | 1,152 sq ft | 106.1% | $198 |
| | Jun 15 2022 | $229,000 | 48 | 1,301 sq ft | 99.6% | $176 |
| | May 16 2022 | $170,000 | 24 | 1,370 sq ft | 114.1% | $124 |
| | May 13 2022 | $227,000 | 64 | 1,188 sq ft | 103.2% | $191 |
| | Feb 2 2022 | $209,000 | 56 | 1,215 sq ft | 88.9% | $172 |
| | Jan 28 2022 | $155,000 | 30 | 1,217 sq ft | 114.8% | $127 |
| | Aug 27 2021 | $180,000 | 48 | 1,170 sq ft | 97.3% | $154 |
| | Aug 6 2021 | $175,000 | 29 | 1,459 sq ft | 103.0% | $120 |
| | Jul 23 2021 | $165,000 | 50 | 1,210 sq ft | 122.4% | $136 |
| | Jul 14 2021 | $155,000 | 40 | 1,260 sq ft | 103.4% | $123 |
| | Nov 18 2020 | $127,000 | 44 | 1,160 sq ft | 101.6% | $109 |
| | Nov 17 2020 | $129,900 | 46 | 1,215 sq ft | 100.0% | $107 |
| | Aug 7 2020 | $128,000 | 51 | 1,650 sq ft | 94.8% | $78 |
Closed sales from MLS history for Waterford Townhomes, Charlotte
Waterford Townhomes median sale price is $208,000.
The Waterford Townhomes real estate market shows balanced market conditions. Homes typically sell within 48 days. With 5 active listings and 7 homes sold in the past year, a healthy balance exists between buyers and sellers.
Free account needed — create one to continue viewing homes.
Members see everything — free👋 Still browsing Waterford Townhomes?
Full photos, price history, and every active & pending home in Waterford Townhomes with a free account.
Palmetto Park Realty Team
 $215K
$215K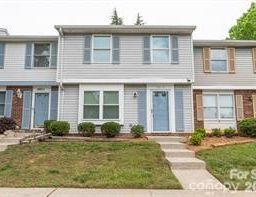 $210K
$210K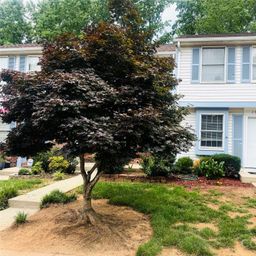 $205K
$205K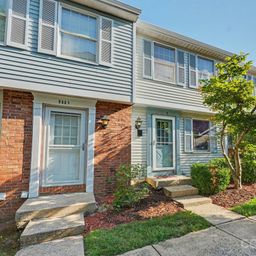 $200K
$200K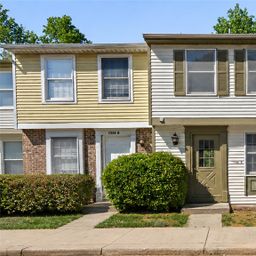 $200K
$200KCheck your messages
We sent a code to .
Verify your number and we'll text you price drops and new Waterford Townhomes listings. 1–2 texts a month, stop anytime.
Enjoy full access to this home and every home on Palmetto Park.