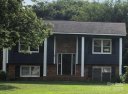
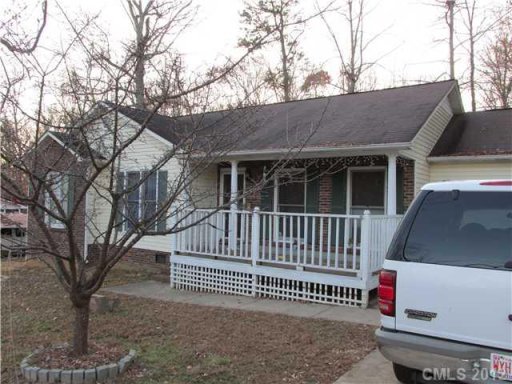
Hoover Acres Homes for Sale
1 pending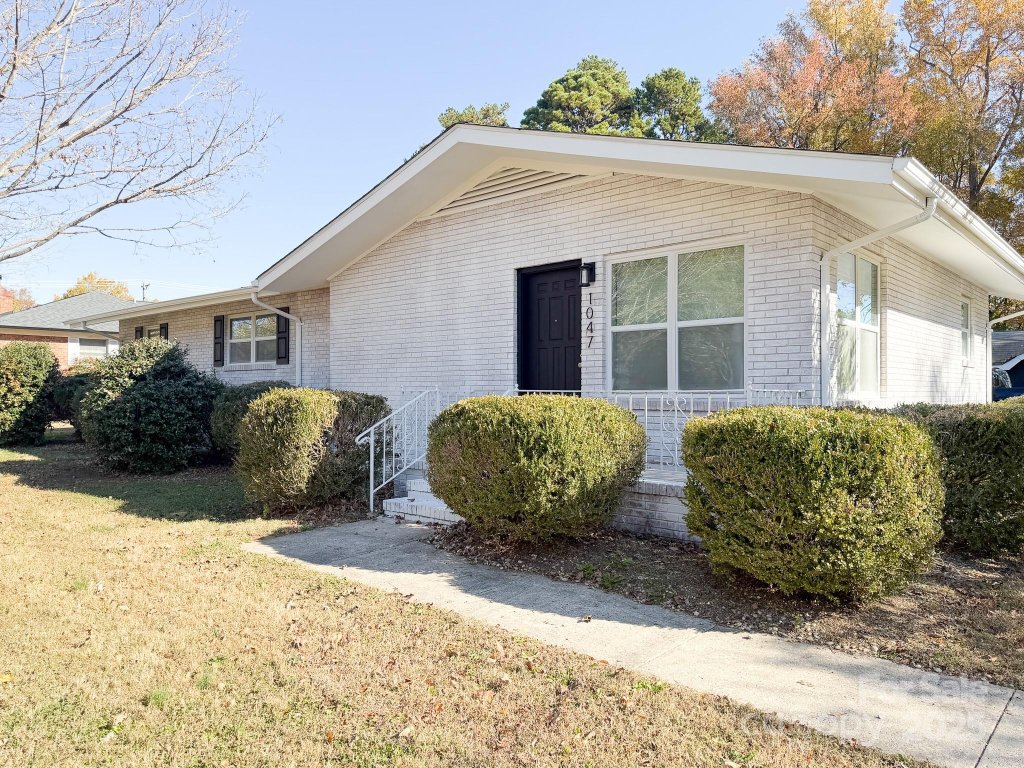


Market Trends
Buyers have more negotiating power. Properties may take longer to sell. Prices have increased 10%. Homes are frequently selling above list price.
Year-over-Year Comparison
Last 12 months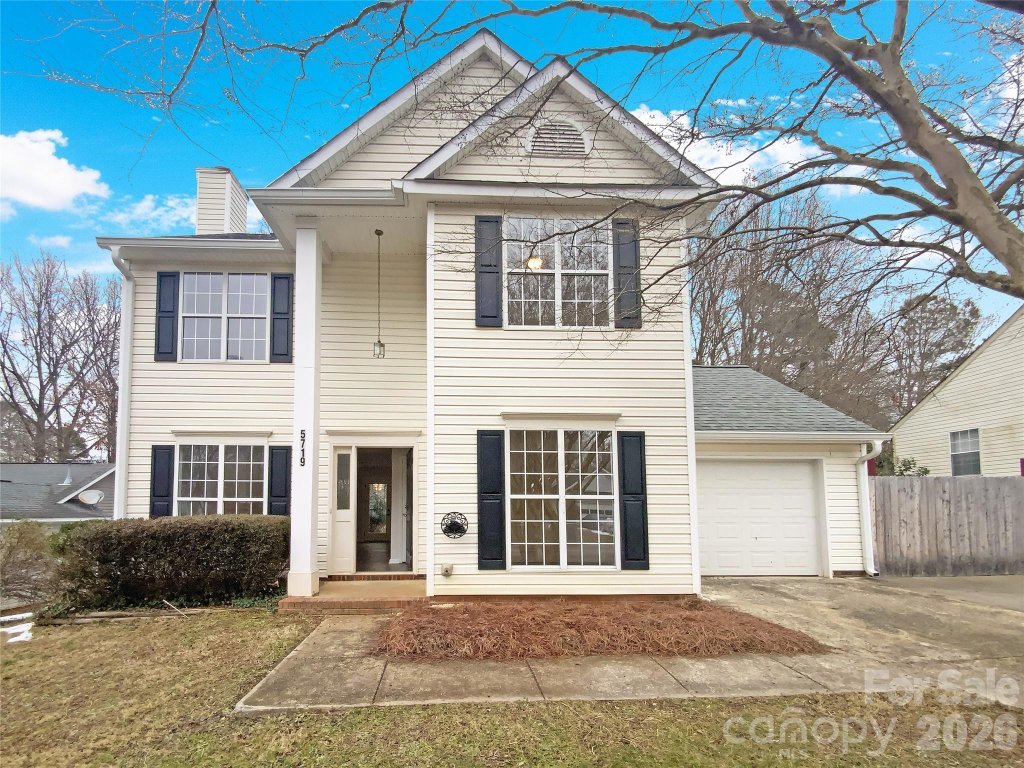
Recently Sold Properties
| Property | Sold Date▼ | Sale Price↕ | DOM↕ | LP/SP↕ | Size↕ | $/SF↕ |
|---|---|---|---|---|---|---|
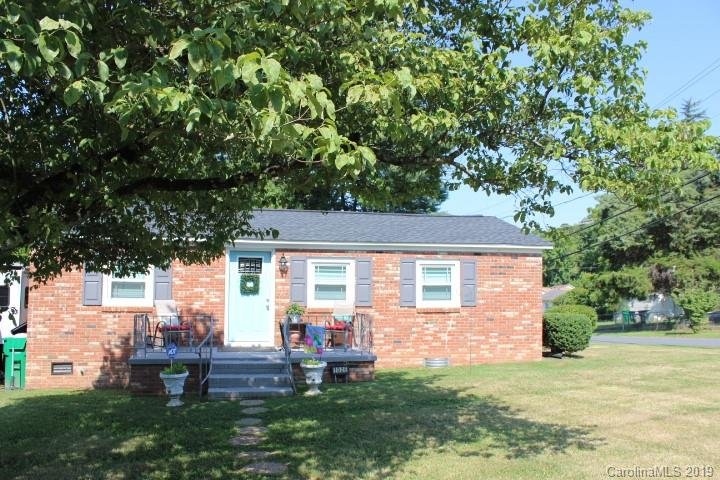
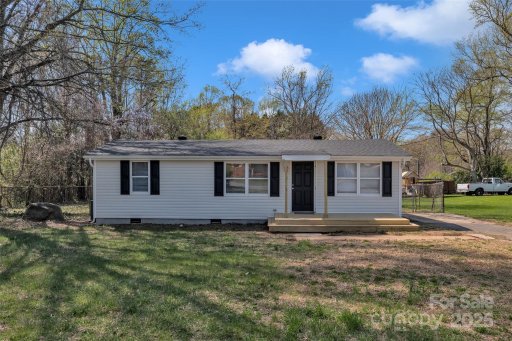
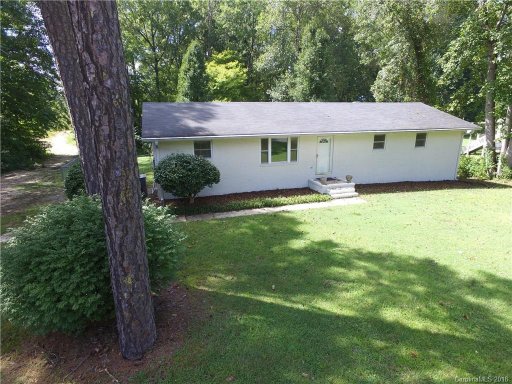
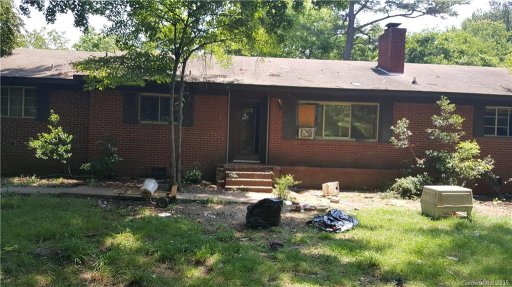
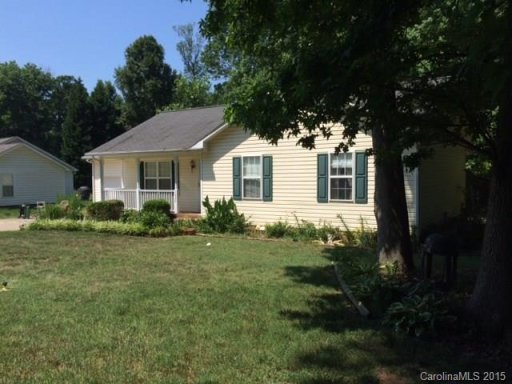
 SOLD 1028 Ashford Street 3 bed1 bath | Jan 9 2026 | $285,000 | 78 | 🎯102% | 1196 sq ft | $238 |
7 month gap in market activity | ||||||
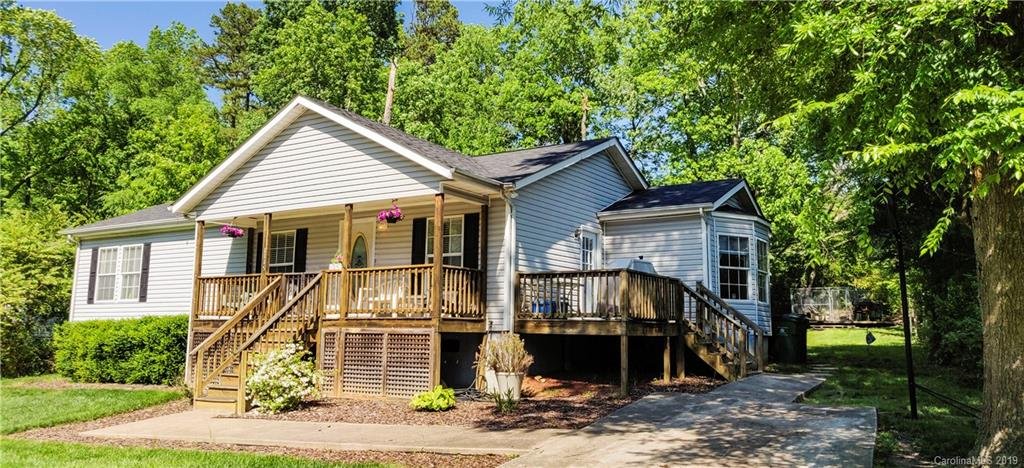
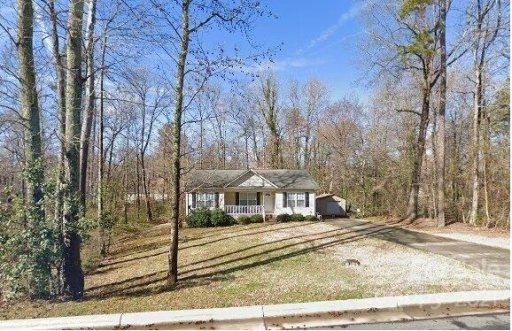
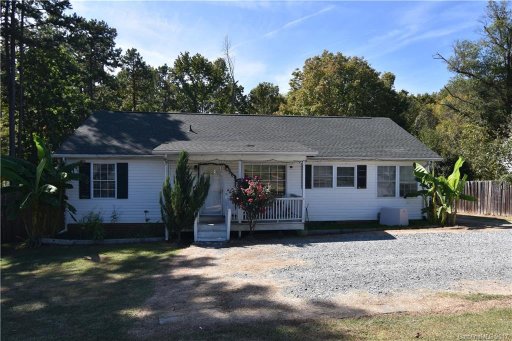
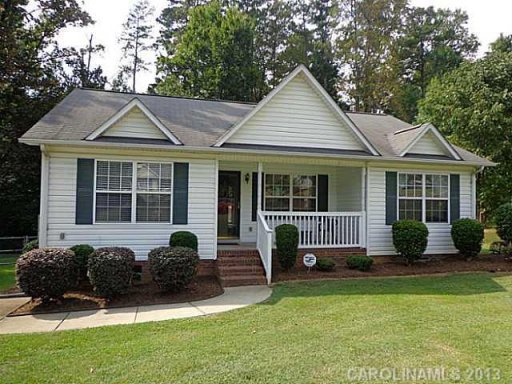
 SOLD 1034 Marietta Street 3 bed1 bath | Jun 12 2025 | $258,000 | 72 | 🎯101% | 813 sq ft | $317 |
1+ year gap in market activity | ||||||
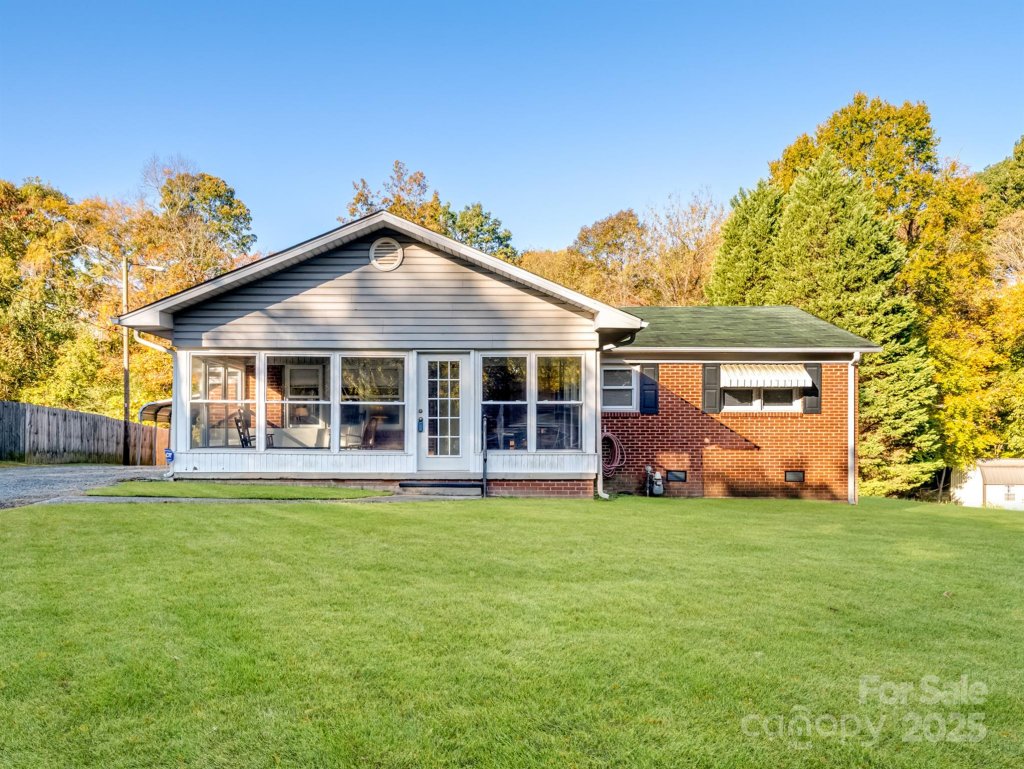
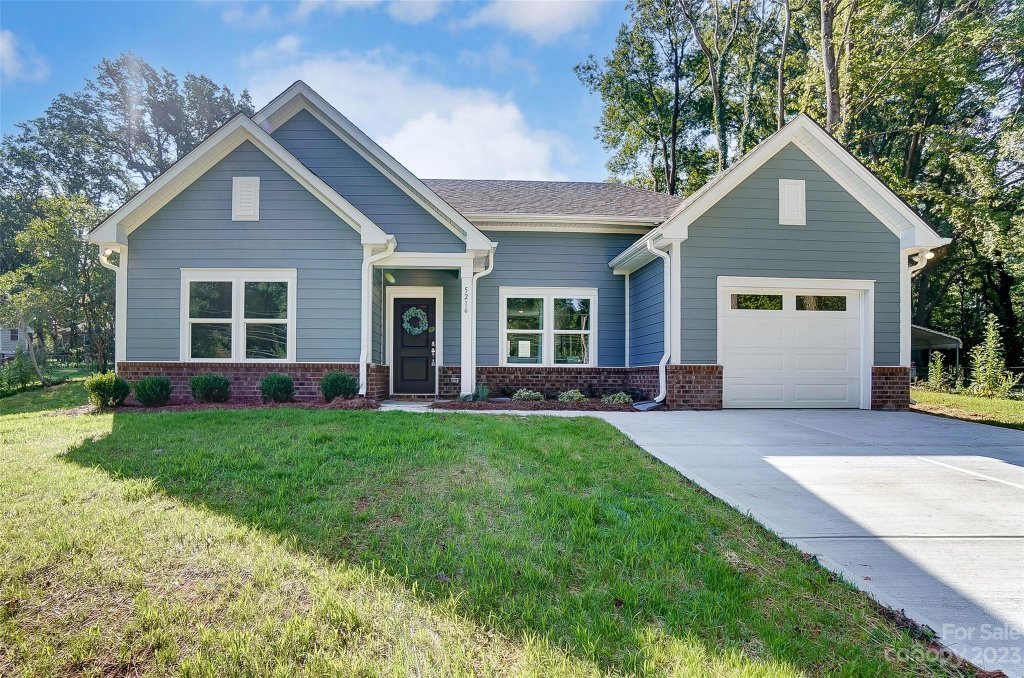
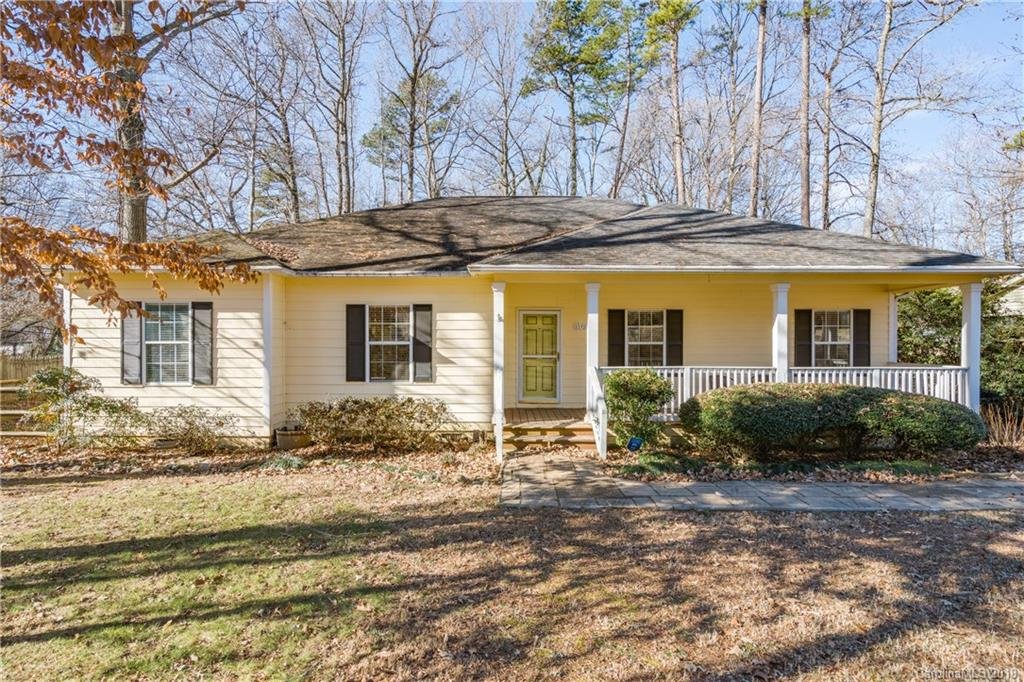
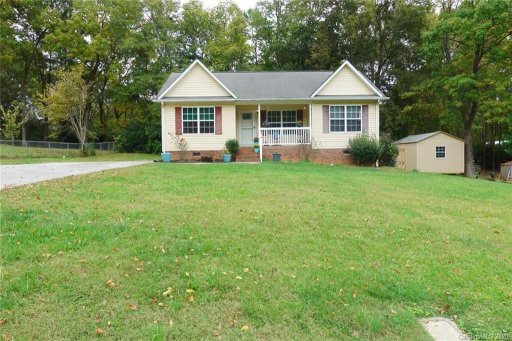
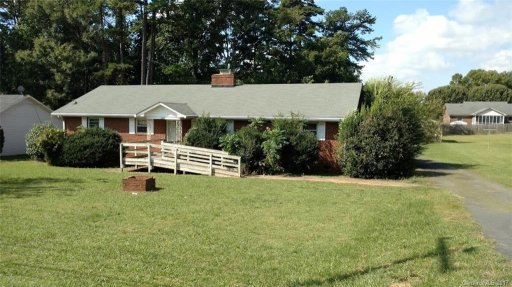
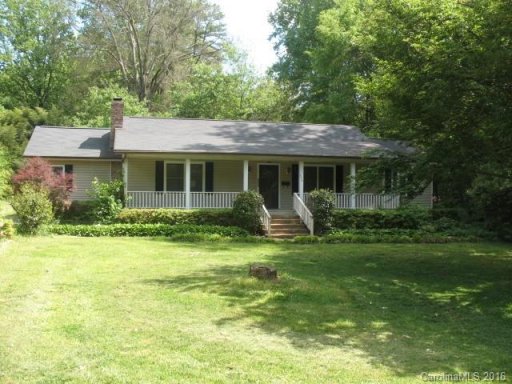
 SOLD 5216 Hoover Drive 3 bed2 bath | Oct 9 2023 | $373,000 | 32 | 99% | 1362 sq ft | $274 |
1+ year gap in market activity | ||||||
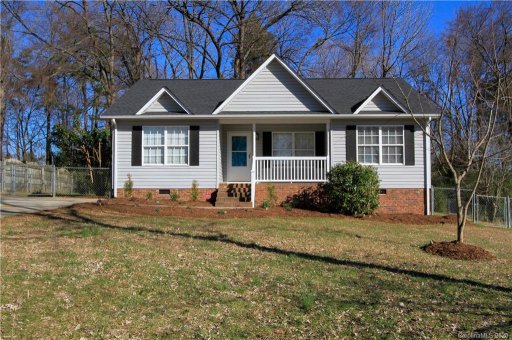
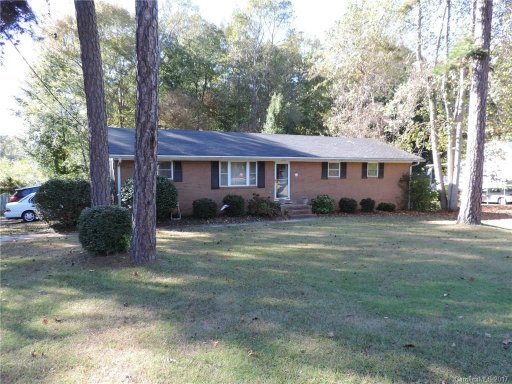
 SOLD 1100 Marietta Street 12 3 bed2 bath | Feb 2 2022 | $265,000 | 76 | 🎯102% | 1242 sq ft | $213 |
1+ year gap in market activity | ||||||
 SOLD 1059 Marietta Street 3 bed2 bath | Nov 25 2020 | $170,000 | 39 | 🎯103% | 1180 sq ft | $144 |
9 month gap in market activity | ||||||
 SOLD 1053 Marietta Street 3 bed2 bath | Feb 14 2020 | $181,000 | 17 | 🎯101% | 1186 sq ft | $153 |
2 month gap in market activity | ||||||
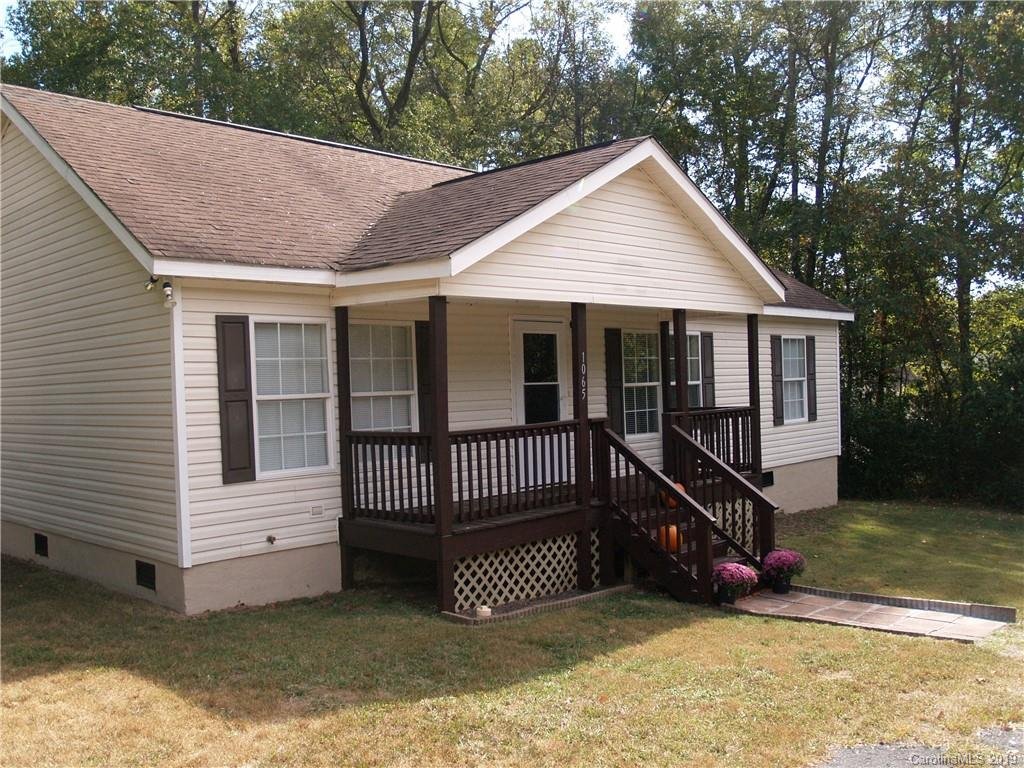
 SOLD 1065 Marietta Street 3 bed2 bath | Nov 19 2019 | $154,750 | 37 | 🎯100% | 1188 sq ft | $130 |
 SOLD 1026 Marietta Street 1 bed1 bath | Sep 30 2019 | $121,000 | 65 | 99% | 777 sq ft | $156 |
3 month gap in market activity | ||||||
 SOLD 1115 Marietta Street 3 bed2 bath | Jun 12 2019 | $155,000 | 44 | 92% | 1465 sq ft | $106 |
7 month gap in market activity | ||||||
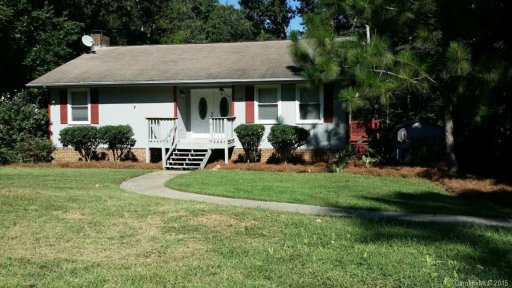
 SOLD 1148 Ashford Street 3 bed2 bath | Nov 13 2018 | $163,000 | 45 | 91% | 2496 sq ft | $65 |
9 month gap in market activity | ||||||
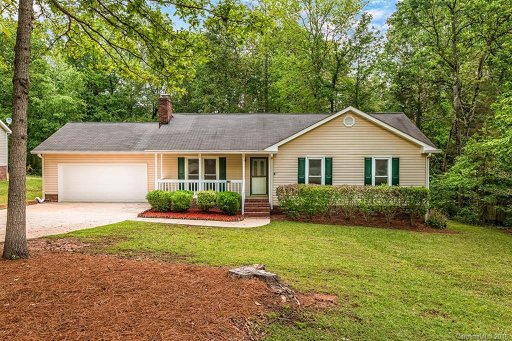
 SOLD 1132 Marietta Street 3 bed2 bath | Feb 16 2018 | $165,000 | 41 | 97% | 1794 sq ft | $92 |
 SOLD 1048 Little Rock Road 3 bed2 bath | Jan 23 2018 | $120,700 | 108 | 99% | 1387 sq ft | $87 |
8 month gap in market activity | ||||||
 SOLD 1010 Little Rock Road 3 bed2 bath | May 12 2017 | $140,000 | 68 | 🎯100% | 1680 sq ft | $83 |
 SOLD 1148 Ashford Street 3 bed2 bath | Mar 31 2017 | $132,900 | 85 | 🎯102% | 2496 sq ft | $53 |
5 month gap in market activity | ||||||
 SOLD 1203 Marietta Street 3 bed2 bath | Oct 27 2016 | $105,000 | 153 | 95% | 1725 sq ft | $61 |
 SOLD 5220 Hoover Drive 3 bed2 bath | Oct 20 2016 | $75,000 | 86 | 🎯103% | 1789 sq ft | $42 |
2 month gap in market activity | ||||||
 SOLD 1125 Ashford Street 3 bed2 bath | Jul 27 2016 | $120,000 | 75 | 🎯110% | 1158 sq ft | $104 |
10 month gap in market activity | ||||||
 SOLD 1133 Ashford Street 7 bed2 bath | Sep 2 2015 | $129,900 | 84 | 🎯100% | 2528 sq ft | $51 |
 SOLD 1020 Ashford Street 3 bed2 bath | Aug 13 2015 | $111,500 | 55 | 🎯106% | 1156 sq ft | $96 |
1+ year gap in market activity | ||||||
 SOLD 1058 Marietta Street 3 bed2 bath | Nov 15 2013 | $98,000 | 58 | 🎯101% | 1164 sq ft | $84 |
7 month gap in market activity | ||||||
 SOLD 1052 Marietta Street 3 bed2 bath | Apr 4 2013 | $55,000 | 97 | 🎯105% | 1116 sq ft | $49 |
 SOLD 1116 Ashford Street 3 bed2 bath | Feb 8 2013 | $89,900 | 66 | 🎯100% | 1312 sq ft | $69 |
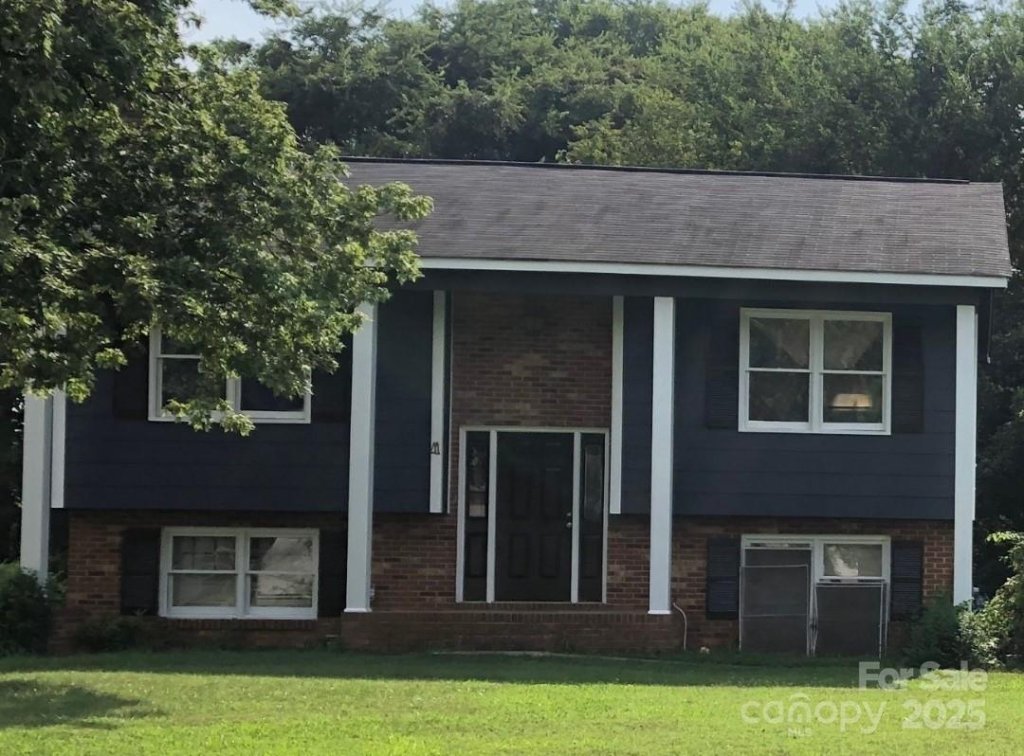
1028 Ashford Street
$285,000
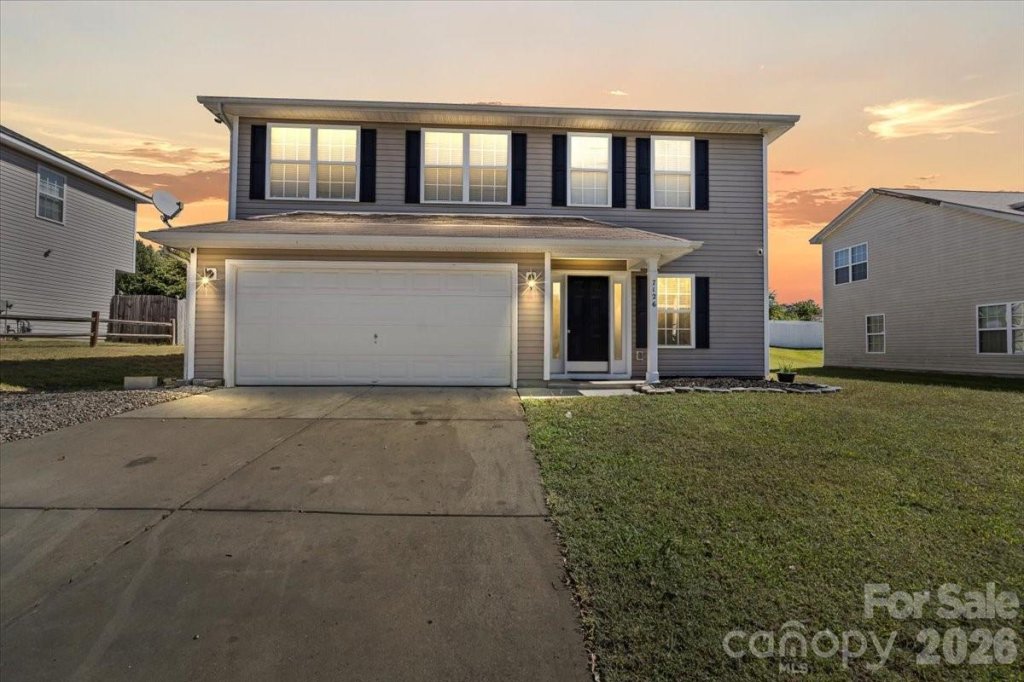
1034 Marietta Street
$258,000
5216 Hoover Drive
$373,000
1100 Marietta Street 12
$265,000
1059 Marietta Street
$170,000
1053 Marietta Street
$181,000
1065 Marietta Street
$154,750
1026 Marietta Street
$121,000
1115 Marietta Street
$155,000
1148 Ashford Street
$163,000
1132 Marietta Street
$165,000
1048 Little Rock Road
$120,700
1010 Little Rock Road
$140,000
1148 Ashford Street
$132,900
1203 Marietta Street
$105,000
5220 Hoover Drive
$75,000
1125 Ashford Street
$120,000
1133 Ashford Street
$129,900
1020 Ashford Street
$111,500
1058 Marietta Street
$98,000
1052 Marietta Street
$55,000
1116 Ashford Street
$89,900
Market Statistics
The Hoover Acres real estate market shows buyer's market conditions. Homes typically sell within 67 days. With 1 active listings and 2 homes sold in the past year, Buyers have more negotiating power and time to decide.
Pricing
Median Price:$384,000
Average Price:$384,000
Property Details
Avg Bedrooms:3.1
Avg Bathrooms:1.9
Avg Lot Size:0.44 acres
Market Activity
Active Listings:1
Sold Last Year:2
Median Days to Sell:67 days
Community Info
Has HOA:No
Median Year Built:1997
New Construction:0%
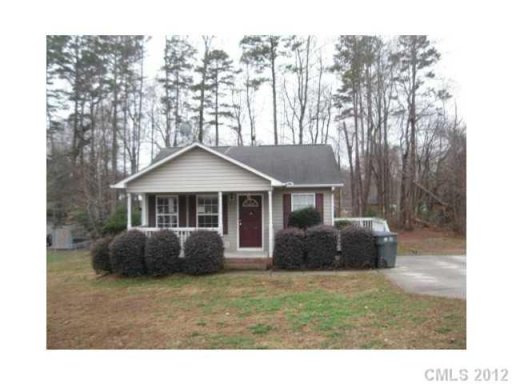
Recently Off Market Properties
1 propertyLooking for similar properties?
These properties are no longer available, but we can help you find similar homes in Hoover Acres. Our agents have access to upcoming listings and can notify you when new properties become available.